|
| ||||||
| |
 | |
|
|
CRITICS of capitalism are convinced that the gap between rich and poor is widening across the world. For them, the claim amounts almost to an article of faith: worsening inequality is a sure sign of the moral bankruptcy of “the system”. Whether rising inequality should in fact be seen as condemning capitalism in this way is a question worth addressing in its own right. There are reasons to doubt it. But it would also be interesting to know the answer to the narrow factual question. Is the familiar claim that capitalism makes global inequality worse actually true?
Unfortunately, this apparently straightforward question turns out to be harder to answer than one might suppose. There are three broad areas of difficulty. The first is measuring what people, especially the poorest people in developing countries, consume. The second is valuing consumption in a way that allows useful comparisons to be made across countries and over time. And the third, in effect, is settling on an appropriate basis of comparison. Which matters more, for instance: whether inequality is widening among nations, or whether inequality is widening among all the people of the world, regardless of which country they happen to live in? Judging any claim about global inequality is impossible without a clear understanding of how the researchers concerned have dealt with all three questions.
The third deserves to be emphasised at the outset. A thought-experiment reveals how easy it is to get muddled. Suppose it is true that inequality measured across countries is widening. (In other words, the gap between average incomes in the richest countries and average incomes in the poorest countries, measured without regard to changes in population, is growing.) Also suppose that inequality is worsening within every individual country. Given that cross-country inequality is widening, and that within-country inequality is getting worse as well, it would have to follow that global inequality, measured across all the world's individuals, is rising too, would it not? Actually, no. Even if those first two assumptions were true, global inequality measured across all the world's individuals might well be falling.
How so? Simply add a third assumption: namely, that a group of poor countries accounting for a big share of all the poor people in the world was growing very rapidly. Suppose, for instance, that average incomes in India and China were growing much faster than average incomes in the rich industrial economies. Then it could be true that inequality was widening within every country, including within China and India themselves; and also that the gap between the very poorest countries (of sub-Saharan Africa) and the richest (Europe and the United States) was widening; and yet, at the same time, that inequality measured across all the individuals in the world was falling fast, because average incomes in the two most populous poor countries were rapidly going up.
It so happens that average incomes in India and China are going up extremely rapidly. Without knowing anything else, one should therefore be sceptical about all the claims that are so confidently made about rising “global inequality”.
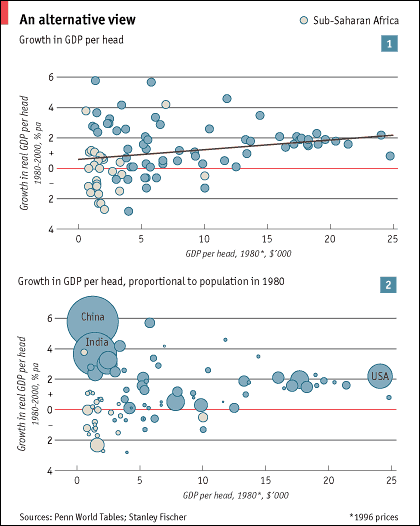
Attentive readers of The Economist will remember seeing before the panel of charts shown below. (They first appeared in a presentation given at the beginning of 2003 by Stanley Fischer, former deputy chief of the International Monetary Fund, to the American Economic Association. We wrote about them in this article of August 23rd last year.) We make no apologies for showing them to readers again: at a stroke, they cut through much of the statistical fog surrounding this subject.
In both charts, the horizontal axis shows the average level of GDP per head in 1980, and the vertical axis shows the rate of growth in inflation-adjusted GDP per head between 1980 and 2000. For the moment, concentrate on chart 1, which shows each country as a single point.
|
| |
 | |
|
|
If it were true, on average, that incomes in poor countries grew faster between 1980 and 2000 than incomes in rich countries, then the points in chart 1 would tend to lie on a downward-sloping line. In that case, one would say that the poor countries were on average catching up—and that global inequality measured across countries was trending downwards. In fact, as the first chart shows, poor countries are not on average catching up. A line of best fit drawn through the points actually slopes upwards, implying that the poor are falling behind, and that cross-country inequality is getting worse.
But now look at chart 2. This plots the same countries as circles with areas drawn in proportion to population. India and China stand out, both by virtue of their vast populations and also because their growth record in the 1980s and 1990s was so much better than the poor-country average. A population-weighted line of best fit drawn through this second chart would indeed slope downwards, implying both catch-up and narrowing inequality.
In short, once you take account of the fact that China and India have performed so well since 1980, and especially since 1990, together with the fact that these two countries account for such a big share of all the world's poor, it is difficult to stay as pessimistic about global trends in poverty and inequality as the critics of global capitalism wish to be. In effect, these critics must blind themselves to the extra information in the second chart.
Unfortunately, however, Mr Fischer's admirable diagrams say nothing about poverty as such: they contain no information about how many of China's people, or America's or any other country's, are poor. And they say nothing about whether growth in any particular country is good for poor people living there (of course, growth raises incomes on average by definition). To look more carefully at these questions one must peer through a cloud of statistical and econometric chaff.
Much of the frequently acrimonious debate among economists about global poverty and inequality turns out to revolve around a single technical issue: is it better to measure consumption (and hence living standards) using data drawn from national accounts or data drawn from household surveys? The two sources ought to marry up. In fact they differ systematically, and by a wide margin. Worse, growth in consumption, not merely levels of consumption, differs persistently according to which source is used. National-accounts data tend nearly always to give a much more optimistic view of trends in poverty than do household-survey data.
Accordingly, in a recent review of the literature* by Angus Deaton of Princeton University (Mr Deaton is perhaps the only economist at work in this area who is acknowledged by all sides both as authoritative and as having no ideological axe to grind) two sets of studies are contrasted. The first draws mainly on national-accounts data, the second on household surveys. Their results are at odds.
Work by Surjit Bhalla, by Xavier Sala-i-Martin, and by Francis Bourguignon and Christian Morrisson shows rapid—indeed historically unprecedented—falls in poverty during the 1980s and 1990s, the new golden age of global capitalism. According to these papers, the proportion of the world's people living on less than a dollar a day (inflation adjusted) has fallen so quickly that the decline has been enough to offset rising population in the developing countries. In other words, the number of people in poverty has been falling not only as a share of the world's population but also, remarkably, in absolute terms.
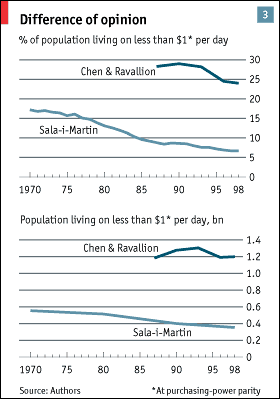
Mr Sala-i-Martin's calculations, for instance, show that the proportion of the world's people living in acute poverty (on less than a dollar a day) fell from 17% in 1970 to 7% in 1998; the proportion living on less than $2 a day fell from 41% to 19%. The absolute headcount of global $1-a-day poverty fell, according to the same estimates, by 200m (see chart 3); and the count of $2-a-day poverty fell by 350m. Mr Bhalla, who finds the sharpest drop in poverty of these authors, wryly states that in 2000 when the United Nations (UN) announced its Millennium Development Goal on poverty—to bring the number of people living on less than a dollar a day in 2015 down to half the level in 1990—the goal had already been achieved.
|
| |
 | |
|
|
But this is not at all the picture that emerges from the second, and far more widely cited, set of estimates. Calculations by the World Bank, using direct surveys of households, carry the official imprimatur of the UN, which uses them in monitoring progress towards its Millennium Development Goal on poverty. And they seem to show relatively little reduction in poverty over recent decades.
A paper by Shaohua Chen and Martin Ravallion of the Bank lays out the thinking behind the Bank's estimates. The authors put the proportion of people living on less than a dollar a day at 28% in 1987—far higher than the corresponding figure according to Mr Sala-i-Martin's work. By 1998, the proportion in poverty had in fact fallen (something which you might not guess if you listened only to those who deplore the wickedness of global capitalism), but only to 24%. Compare that with Mr Sala-i-Martin's estimate of just 7%.
That discrepancy draws attention to the danger of focusing too much on the dollar-a-day threshold. That is a crowded part of the global income distribution. For this reason alone, switching from one data source to another, or moving the official poverty line from one level to another, is apt to have a large effect on the figures. This underlines the importance of not regarding any of these numbers as holy writ.
Still, the question remains, why are the differences so big? Several factors are at work. The World Bank attempts to measure “consumption poverty”, as opposed to “income poverty”. To the extent that poor people manage to save, their consumption will be less than their income, and so there will be more poor people on the Bank's definition. Also, the Bank expresses its poverty ratios as proportions of population in the developing countries; Mr Sala-i-Martin, for instance, uses global population; the effect is to make Mr Sala-i-Martin's estimates, other things equal, smaller than the Bank's. Country samples also vary from study to study. And on top of all this comes the effect of basing estimates on national accounts rather than on household surveys.
It is revealing to consider why, according to the Chen-Ravallion study, poverty fell relatively slowly on their household-survey measure. It was not because of an increase in within-country inequality—in other words, brisk growth in average consumption was not being hogged by the better off. It was because growth in average consumption was slower than what growth in national incomes, as measured in the national accounts, would lead you to expect. Growth in consumption per head across the countries in the Chen-Ravallion sample was less than 1% a year between 1987 and 1998, according to the household surveys. Growth in consumption per head according to the national accounts was more than 3% a year.
Mr Deaton notes that a plethora of new data has so far failed to resolve this issue “because the new sources are mutually contradictory”. Summing up, he states: “If the surveys are wrong, and the national accounts right, either inequality has been widening in ways that our data do not appear to show, or poverty has been falling more rapidly than shown by the dollar-a-day counts. If the surveys are right, there has been less growth in the world in the 1990s than we are used to thinking.”
It would be a mistake to presume that either source of data is better in principle. Surveys are famously prone to error because of bad or fluctuating design, discrepancies in samples and poor execution. But national accounts have drawbacks as well, especially in poor countries. For instance, they fail to capture some sorts of non-market income and consumption. This makes them prone to understate the consumption of the poor, but also to overstate the growth of consumption of the poor as incomes rise and as more activities fall within the scope of market transactions.
Still, most of the discrepancy between the survey estimates and the national-accounts estimates—with the surveys persistently pessimistic on trends in poverty—is probably due to the fact that as people get better off, they are less likely to respond (accurately, or at all) to surveys. As a result, as countries get richer, the ratio of “survey consumption” to “national-accounts consumption” is usually found to fall. Consistent with this, the ratio of the two measures is highest in the poorest countries.
Mr Deaton argues that both sources ought to be used, though combining them properly raises a host of difficult technical issues. Meanwhile, the truth about global poverty and inequality presumably lies somewhere between the extremes suggested by the two methodologies.
One can at least conclude that the official World Bank data, used by the UN and other agencies, are too pessimistic: poverty has most likely fallen faster than these widely cited figures suggest, and possibly fast enough to reduce the global headcount of those living on less than a dollar a day, even as population rises. More accurate answers will require more work to be done. In the meantime, however, the official position on global poverty ought to start, at a minimum, to acknowledge the uncertainty surrounding the figures and, further, to concede that the truth is likely to be better than the official figures say.
But what of the fear that global capitalism is making progress at the expense of the poor? The true figures would probably be quite reassuring on this—but even if the more pessimistic official figures were correct, it would be worth questioning the conclusions that the anti-globalists draw from them. If poverty was proving as tenacious in the face of growth as the Bank's estimates say, would it make sense to blame global capitalism for that?
Hardly. On any estimate, poverty is at its most impervious in sub-Saharan Africa. Look again at charts 1 and 2. The countries of sub-Saharan Africa are represented by the white circles. These are not just the poorest countries in the world, but also the slowest-growing. Can it be plausibly claimed that these countries are the victims of globalisation? That would be an odd conclusion, given that sub-Saharan Africa's economies are so comparatively isolated from the rest of the world economy—by force of history, circumstance and, to a large extent, the policies of their own and other governments. Sub-Saharan Africa plainly suffers not from globalisation, but from lack of it. The focus of attention should be on how to extend the benefits of international economic linkages to the region. Removing every rich-country barrier to trade with these countries would be an excellent place to start.
By contrast, India and China are showing how great the benefits of international economic integration can be. Neither country is an exemplar of free-market capitalism—far from it. But it is undeniable that both countries have consciously chosen to seize the opportunities afforded by the global economy, through both trade and foreign investment. As incomes surge, while the living standards of the poorest improve more modestly, if at all, inequality within both countries may well be rising. The gaps between urban and rural incomes, especially, have widened lately.
This may prove a temporary phenomenon. But suppose otherwise; suppose the problem persists. Would any such worsening of inequality entitle one to conclude that India and China had taken a wrong turn these past 20 years? Of course not. Look at Africa to understand that there are worse things than inequality.
* “Measuring Poverty in a Growing World (or Measuring Growth in a Poor World)”, revised February 2004, by Angus Deaton (included extensive further references); “The World Distribution of Income” by Xavier Sala-i-Martin; NBER Working Paper 8933; “Imagine There Is No Country: Poverty, Inequality and Growth in the Era of Globalisation” by Surjit Bhalla, Institute for International Economics; “How Well Did the World's Poorest Fare in the 1990s?” by Shaohua Chen and Martin Ravallion, Review of Income and Wealth 47 (3); “Inequality Among World Citizens: 1820-1992” by Francois Bourguignon and Christian Morrison, American Economic Review 92 (4).
| Copyright © 2004 The Economist Newspaper and The
Economist Group. All rights reserved. |