Demonstration
Spectrometer
Fourier Transform Infrared Spectrometer
OVERVIEW
Interferometry for chemical applications was first applied to the far infrared region.Ā The main factors that influenced this were the relatively low energies emitted by the IR sources, relative simple optical requirements, and simplified mathematical requirements due to the fact that relatively few data points were required to perform the Fourier transformation.Ā The development of a fast computational method (Cooley-Tookey algorithm) and microelectronics expanded the use of interferometers to the NIR and fundamental Mid IR regions.Ā The purpose of this section is to highlight the principles behind the functioning of Fourier Transform Infrared (FT-IR) spectrometers and therefore facilitate your use of the instrument in the laboratory.
OBJECTIVES
After finishing this session and completing the individual write-up, you should be able to:
- Explain in your own words the theory behind interferometry.
- Summarize the operation of the FT-IR Spectrometer.
- Set the main parameters to collect the infrared spectrum of a given sample.
INTERFEROMETRY
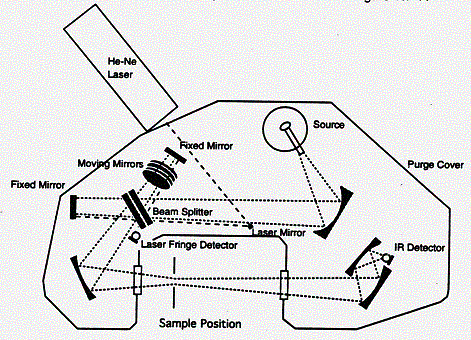
Most Fourier Transform Infrared (FT-IR) commercial spectrometers are based on the Michelson interferometer.Ā Michelson designed this device and together with Morley used it to disprove the existence of the ether, the hypothetical medium through which light waves were thought to propagate.
http://landau1.phys.virginia.edu/classes/109/lectures/michelson.htmlĀ
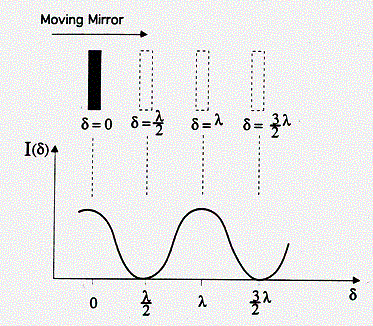
The Michelson interferometer is essentially an optical assembly composed of a beamsplitter, a moving mirror, and a stationary or fixed mirror.Ā The interferometer is used to split a beam of radiation into two beams and then recombining them after a path difference is introduced.Ā The division of the beam is achieved with the beamsplitter, which transmits about 50% and reflects about 50% of the radiation.
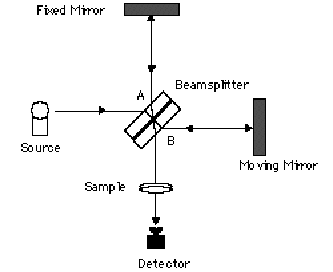
Figure 1.Ā Michelson Interferometer
ĀĀĀĀĀĀĀĀĀĀĀ If radiation from an infinitely narrow line source hits the
beamsplitter (Figure 1), one part of the beam (A), goes to the fixed mirror
and the other beam (B), to the moving mirror.Ā When the beams are recombined,
an interference pattern is obtained as the Optical Path Difference (OPD)
or the retardation d is varied (OPD = 2 x mirror displacement).Ā If the
position of the moving mirror is such that beam (B) travels exactly the
same distance as beam (A) before reaching the detector then the two beams
will be in phase and will reinforce each other. Constructive interference
occurs every time the value of the retardation d is an integer multiple
of the wavelength or d = nl Ātherefore, the energy arriving at the detector
as a function of retardation I(d) will be a maximum.Ā On the other hand,
if the position of the moving mirror is such that the optical pathlength
of beam (B) is different from that of beam (A) by ![]() Ā(where
Ā(where
![]() )
then the two beams are 180░ out of phase and will exactly cancel each other
on destructive interference.Ā In this case the energy that reaches the detector
is a minimum.Ā Thus, as the moving mirror travels a certain distance,
an interferogram as in Figure 2 will result.Ā The intensity of the radiation
at the detector, I(d), varies as a cosine function of the optical retardation
d.
)
then the two beams are 180░ out of phase and will exactly cancel each other
on destructive interference.Ā In this case the energy that reaches the detector
is a minimum.Ā Thus, as the moving mirror travels a certain distance,
an interferogram as in Figure 2 will result.Ā The intensity of the radiation
at the detector, I(d), varies as a cosine function of the optical retardation
d.

Figure 2.Ā Interferogram of a monochromatic, infinitely narrow line source
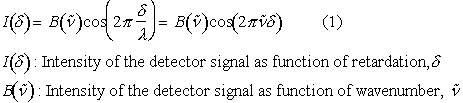
The resulting interferogram is described as an infinitely long cosine wave defined by the equation:
If the source emits more than one frequency (polychromatic radiation) every frequency is treated as if it resulted in a separate train of cosine waves.Ā The resultant interferogram is obtained after adding the cosine waves geometrically, as in Figure 3.Ā Mathematically this can be expressed as:
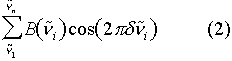
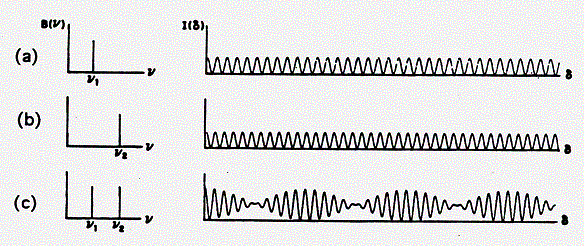
Figure 3.Ā The interferogram of a single frequency source is a cosine function with a periodicity that varies with the frequency of the emitting source (a and b).Ā The interferogram of a two-frequency source may be calculated by geometrically adding the cosine functions corresponding to each of the individual lines in the source (c).
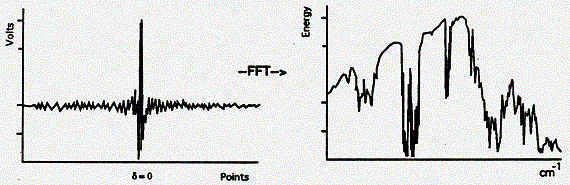
As the moving mirror changes positions, it causes the waves that compose the infrared radiation undergo constructive and destructive interference when they recombine at the beamsplitter, producing an interferogram (plot of the detector response, intensity in volts vs. the position of the moving mirror or retardation in cm).
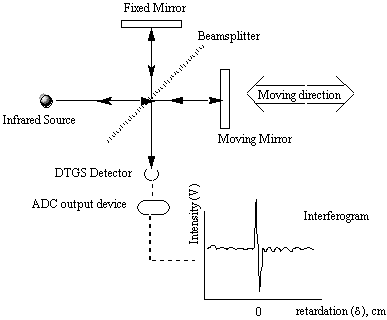
Figure 4.Ā Interferogram generation from a polychromatic IR source
For an IR source such as a nichrome wire electrically heated, the interferogram can be interpreted as a sum of cosine waves from each contributing frequency.Ā For a continuous infrared source, the sum (2) goes over to an integral (3):
![]()
Resulting the interferogram shown in figure 5, the primary data obtained with a FT-IR spectrometer:
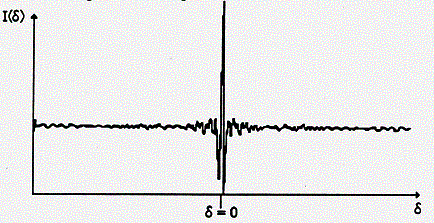
Figure 5.Ā Interferogram of a typical infrared source
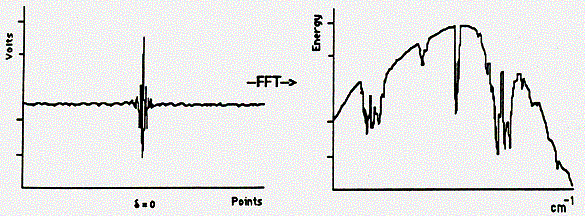
Note that at zero retardation, d = 0, all the waves are in phase, this maximum is called the centerburst or the Zero Path Difference (ZPD) of the interferogram.Ā Moving away from the ZPD in either direction, causes the intensity of the interferogram, I(d), to die off as contributions from the various frequencies go in and out of phase with each other.Ā The "spectrally meaningful" information is extracted from the wings of the interferogram as an infrared spectrum (plot of absorbance or %transmittance vs. reciprocal cm) by an operational amplifier that performs the mathematical operation called Fast Fourier Transform (FFT, conversion of the interferogram into a sum of sine and cosine functions).
The interferogram is measured by recording the detector signal as a function of the optical path difference between the two beams.Ā The signal has to be sampled at precise intervals corresponding to equal steps in path difference.Ā For signal averaging, successive interferograms have to be measured at exactly the same points.Ā This is achieved by using a helium-neon laser as a reference.Ā Radiation at exactly 632.8 nm traverses the same optical path as the IR beam.Ā A separate detector measures the interferogram produced, giving a sinusoidal signal with maxima separated by the laser frequency at 15,803 cm-1.Ā This signal is used to trigger the sampling of the IR signal very reproducibly.Ā However, the laser cannot detect the direction in which the mirror is moving.Ā In order for successive scans to start at the same point, the absolute path difference has to be re-established for each scan.Ā The most commonly used design is based on the helium-neon reference laser, as described above, to trigger interferogram sampling.Ā The centerburst of the interferogram is used to establish zero retardation.
An interferogram contains all of the IR absorption information albeit in a form not useful to a chemical spectroscopist.Ā The Fourier transform of this interferogram gives the conventional spectrum.Ā The relationship between the interferogram and the spectrum is given by equation (5).Ā This equation is the Fourier Transform pair of equation (3) given above.
![]()
The Fourier Transform operation changes the domain of the original data into its reciprocal; in this way the space domain data (interferogram) is turned into a reciprocal space domain data (the spectrum) as shown below.Ā Notice that he slope of the single beam spectra obtained accurately resembles the intensity distribution of a black body radiator with the absorptions due to sample and air respectively embedded in the distribution.
Generation of a FT-IR spectrum
The FT-IR spectrometer generates the infrared spectrum of a given sample by calculating the ratio of the signal obtained by scanning air (empty beam) to the signal obtained by scanning the sample. ĀThe process is schematically illustrated in the figures below: first an interferogram of the source (background) is scanned, transformed into a single beam spectrum, and stored in computer memory:
The sample, in this case a polystyrene film, is then placed in the sample holder and the process is repeated:
The ratio between the two single-beam spectra, in computer memory, is calculated and the "double beam" presentation with a flattened baseline is produced.Ā The features present in the background spectrum correspond to the emission profile of the source, the optical efficiency, or detectivity of the detector, the absorption of the film optical coatings, atmospheric water, and gaseous CO2.Ā The ratio process compensates for these bands and they don't appear in the spectrum of the sample as shown below.
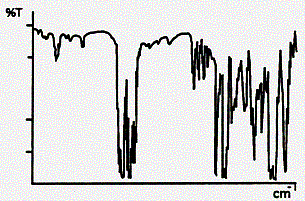
Figure 7.Ā IR spectrum of polystyrene.
(a) Source
The most frequently used sources in the Mid IR region are Nernst Glowers, cylinders composed of a mixture of zirconium, yttrium and thorium, Globars which are silicon carbide rods, and incandescent wires of nichrome, or rhodium sealed in a ceramic cylinder.Ā All of these sources exhibit the energy distribution of a theoretical black body radiator.Ā However, the thermal sources are inefficient in the far infrared region, and the mercury arc, a quartz jacketed tube filled with Hg vapor has to be used.
(b) Beamsplitter
For the Mid¢IR range 4,400 to 450 cm-1, the beamsplitter consists of a thin film of Germanium entirely deposited on a potassium bromide plate, except on its center for transmission purposes, this plate is covered by a clear potassium bromide plate.Ā Plates of CsI covered in the same way with Silicon are also used.Ā A film of iron (III) oxide deposited on CaCl2 plates is used for Near IR, and for Far IR applications a thin film of Mylar sandwiched between two plates of a low refractive index solid is used.
A Mid IR spectrometer should never be turned off, which would cause water condensation over the hygroscopic alkali beamsplitter, which will obscure the center of the plate impeding the transmission of light.Ā If the instrument needs to be moved, it has to be packed with a dehydrating agent such as calcium sulfate to avoid damage to the beamsplitter and alkali windows.
(b) Detector
FT-IR spectrometers use either pyroelectric or photoconductive detectors.Ā Pyroelectric detectors are a special kind of thermal detector consisting of single, thin, pyroelectric crystals such as deuterated triglycine sulfate (DTGS) or LITA (lithium tantalate).Ā When a pyroelectric material is polarized by an electric field, it remains polarized after the field is removed due to an effect called residual electric polarization.Ā This residual polarization is sensitive to changes in temperature.
ĀĀĀĀĀĀĀĀĀĀĀ Photoconductive detectors show an increase in electrical conductivity when illuminated with IR radiation.Ā They have a rapid response and high sensitivity.Ā The most commonly used photoconductive detector is the MCT (Mercury Cadmium Telluride), which must be cooled to liquid nitrogen temperatures for proper operation.
http://www.lasercomponentsusa.com/infratec/ pdf/temp performance 0902.pdf
FT-IR Scanning parameters
- Scanning Time: One scan taken with an FT-IR spectrometer is equivalent to a complete displacement of the moving mirror from the initial position to the final one.Ā This change of position is referred to as the Optical Path Difference (OPD) or retardation because it sets the difference between the paths of the beams of light that come from the fixed mirror and from the moving mirror and recombine at the beamsplitter as explained above.Ā The largest the distance traveled by the moving mirror, corresponds to the highest resolution that can be achieved.Ā For this reason, the scanning time increases with resolution.Ā
- Signal
to Noise Ratio (SNR): Indicates the quality of the baseline
of the sampleÆs infrared spectrum; mathematically, the SNR is a comparison
of the size of the noise to the size of the signal.Ā The SNR improves
with the number of scans acquired because of the averaging nature of the
data acquisition: after averaging each scan the signal increases in size
while the noise diminishes.Ā The dominant noise in FT-IR is the detector-limited
noise, which varies as the square root of the number of scans (
 for N scans).Ā Hence, combining these two factors, the SNR varies with
the number of scans N as
for N scans).Ā Hence, combining these two factors, the SNR varies with
the number of scans N as  .Ā Acquiring a larger number of scans will improve the SNR or a cleaner
baseline spectrum.Ā For transmission experiments of condensed phase samples,
4 scans will suffice to obtain a good SNR, because of the high energy
involved in the measurement.Ā For gases, at least 16 scans must be acquired
to assure good SNR.Ā When reflectance accessories such as Diffuse, Specular,
or Total reflectance are used, a minimum of 64 scans must be collected
due to the limitation on the energy that reaches the detector or optical
throughput.
.Ā Acquiring a larger number of scans will improve the SNR or a cleaner
baseline spectrum.Ā For transmission experiments of condensed phase samples,
4 scans will suffice to obtain a good SNR, because of the high energy
involved in the measurement.Ā For gases, at least 16 scans must be acquired
to assure good SNR.Ā When reflectance accessories such as Diffuse, Specular,
or Total reflectance are used, a minimum of 64 scans must be collected
due to the limitation on the energy that reaches the detector or optical
throughput.
Ę Resolution (spectral resolution): Indicates the ability of the spectrometer to distinguish two closely spaced vibrational or rotational modes.Ā The resolution of the interferometer increases with d and therefore with mirror travel.Ā To a good approximation, the best resolution is given by
![]()
ĀĀĀĀĀ Where: ∆ = dmax is the maximum mirror travel distance.Ā Since this mirror displacement cannot be infinite in an actual spectrometer, the resolution is somewhat less, as discussed below.Ā For condensed samples acquired in transmission mode, a resolution of 8 cm-1 will resolve most vibrational modes, which full width at half height (FWHH) is about 10 cm-1.Ā This resolution also allows the acquisition of a large number of scans at a relatively short time improving the SNR.Ā If the rotational fine structure is required for the calculation of molecular parameters for gas samples, the best resolution of the spectrometer must be utilized together with the acquisition of a large number of scans for good SNR.Ā Apodization functions limit spectral resolution, as it will be explained below, so for gas samples a simple truncation function called boxcar must be used.
Ę Apodization: The mathematical form of the Fourier pair, equations (3) and (5), sets the integration limits to retardation values from -∞ to +∞.Ā However, integration is physically impossible because the moving mirror travels a finite distance from -∆ cm to +∆ cm, which is determined by the design of the mirror drive. ĀĀSetting these limits is equivalent to truncating the interferogram, or setting it equal to zero for all values greater than ∆ and less than -∆.Ā This is known in mathematics as convoluting the complete interferogram (-∞< d < +∞) with a function that has the value 1.0 for (-∆<d < +∆) and zero for values of d outside these limits (Figure 8).Ā Because of its rectangular shape, this function is called boxcar and the process is called boxcar truncation.
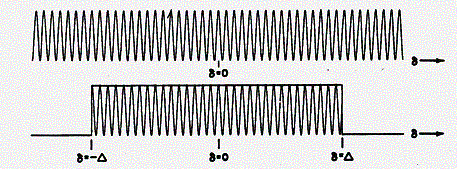
Figure 8.Ā Boxcar Truncation on a monochromatic infinitely narrow line.
When the Fourier transform with boxcar truncation is performed, an infinitely narrow monochromatic line takes on width and acquires positive and negative side lobes, known as ringing (Figure 9).Ā Mathematically this function is of the form sinx/x, which is known as sincx function.Ā The full width at half height (FWHH) of the obtained function is 0.605/∆.
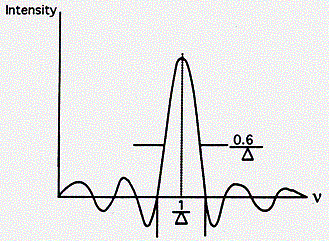
Figure 9. Effect of boxcar truncation on an infinitely narrow line.
The first minimum has a negative value, which is about 22% of the amplitude of the central positive frequency.Ā If a weak line were present at the frequency value of this minimum, it could be lost from the computed spectrum.Ā The elimination of the side lobes that result after truncating the interferogram with a boxcar function is known as apodization, and functions used for this purpose are called apodization functions.Ā Triangular apodization is one of the simplest functions used.Ā In Figure 10 boxcar truncation is contrasted to triangular apodization for the Fourier transformation of an infinitely narrow monochromatic line.
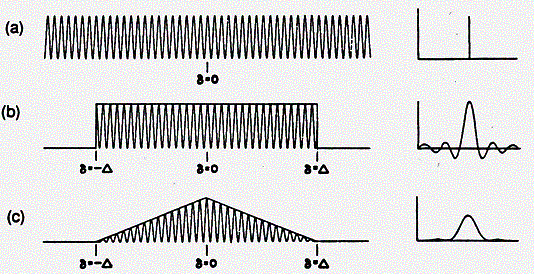
Figure 10.Ā Comparison of triangular apodization and boxcar truncation.
The source is an infinitely narrow line.Ā The interferogram (a) is an infinitely long cosine train, which transforms faithfully to return the infinitely narrow line.Ā When boxcar truncation is used (b) the transformed line takes on width and exhibits positive and negative lobes.Ā Triangular apodization (c) further increases line width but reduces the magnitude of the side lobes and makes them all positive.Ā Note that although the triangular function decreased the side lobes, the resultant line width is considerably increased, affecting the resolution.Ā There are several apodization functions, which employ a degree of non linearity or curvature in an effort to maintain resolution while reducing the ringing, these include Gaussian and Lorentzian functions, a raised cosine function (Hanning apodization), Happ-Genzel apodization and Norton-Beer functions.
ĀĀĀĀĀĀĀĀĀĀĀ When sampling liquids and solids in transmission mode, an apodization function of medium strength such as triangular that does not seriously affect resolution should be used.Ā For gas sampling when rotational fine structure is required, no apodization function should be used.Ā The boxcar truncation will maximize the resolution although the baseline will be affected.Ā In this case a greater number of scans will ultimately favor the SNR of the spectrum.
ASSESSMENT
I.Ā INTERFEROMETRY
1. Name and explain the functioning of the assembly shown and label the components.

2. In your own words, explain the following diagram. ĀUse equations to illustrate your point.
3. Explain how the following graph was obtained.Ā What does it represent?

II.Ā Spectrometer Components and Functioning
4. What is a DTGS and how it works?
5. Is it a good practice to turn off a mid IR spectrometer?Ā Explain.
6. Why is it necessary to collect a larger number of scans when using reflectance accessories than for transmission measurements?
7. Indicate the scanning conditions needed to resolve the fine rotational structure of the infrared spectrum of a sample of carbon monoxide with optimal SNR.Ā
8. What effect will have on the appearance of the spectrum if the conditions used in the previous question were applied to a sample of liquid acetone?Ā Explain answer using SNR, scanning time, and resolution?
[ Back to Top ]