
SEEING FIGURES:
Visualization in computer science
and mathematics
ACTIVITIES SUCH as financial, military, and corporate behavior depend on so many
interconnected dynamic variables that they can require complex mathematics to characterize.
Computer models that address these shifting relations can be difficult to design accurately and
almost impossible to access efficiently. Can visualization techniques be used to simplify such
models and improve their usefulness?

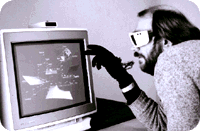
Steven Feiner and Clifford Beshers of Columbia's Department of Computer Science have tried to resolve this question with a new interactive system that picks up where older 3-D workstations leave off. Instead of invoking images on a flat screen through a mouse, Feiner and Beshers constructed a stereo world that incorporates user participation. Entryway to this world is via special stereoscopic eyewear.
Feiner and Beshers also enlisted the DataGlove, an
optical-fiber-lined glovelike mechanism
originally created in the 1980s for use in advanced aerospace research. When the wearer holds a
gloved hand straight out at the screen, it sends the computer signals about the position and
orientation of the hand and fingers.
The eyewear contains liquid crystal panels, one in front of each eye. By alternately displaying images for the left and right eyes on the screen, and alternately darkening either panel, the eyewear creates a stereo image that extends into and out of display, much like a modern stereo movie. Information appears in Cartesian coordinate frames, each of which may be encompassed by other frames like a nested set of boxes, showing different parameters that play an important part in the behavior of the model. To work with the model, a user "reaches" inside the virtual world with a gloved hand and manipulates the structure. He or she can change a variable and observe the effect on the other variables or wrap the gloved hand around the structure, lift it into another position in the frame, and see what happens to it. By manipulating the virtual objects, one in effect makes changes that can be transported to the real world. Feiner and Beshers call this method "worlds within worlds."
The Feiner-Beshers model has been applied to several banking and financial operations. In one application, the purchase of a house, Feiner and Beshers linked a large number of pertinent financial variables (such as interest rate, the price of the house, down payment, property tax, and insurance premium) into a structure that visually represents how these variables react with one another over time. From this visualization, users can move around in the financial environment and determine the best decisions under various conditions.
The same model was used to help explain the volume of foreign currency options, the change in the spot price, the volatility, and the underlying value of the currency. "Some traders tried the model and liked it a lot," Feiner recalls, "but unfortunately this occurred at the time when the bottom fell out of the market, and Citicorp withdrew its funding." Feiner is optimistic, however, that financial companies will eventually adopt the visualization technique as an in-house tool-possibly because many of the competitive methods don't seem to work too efficiently.
Feiner sees the next step in interactive visualization involving systems that design themselves through use of knowledge-based techniques. Just as an individual sets a camera, adjusts the lens, and shifts subjects around before taking a picture, Feiner's group employs a computer system that makes these decisions automatically. It selects the objects to visualize, where to position them, and how to treat them visually. Human decision-making in financial dealings, a feature of our civilization for several hundred years, is finally giving way to a self-propagating computer model.


