
SEEING LARGE:
Visualization in geology
and oceanography
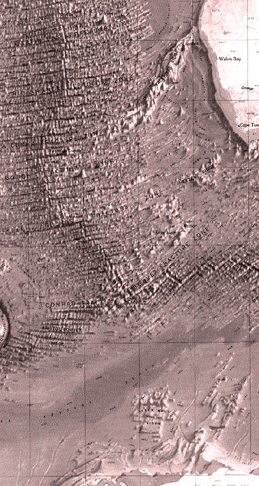
A CLASSIC PICTURE of the mid-Pacific ridge, a long underwater mountain chain that divides
the ocean floor, hangs on the wall of the geological sciences building at Lamont-Doherty. The panorama was created in
the 1950s by two discoverers of the ridge, Bruce Heezen and Marie Tharp, who traveled twice
around the globe, collecting masses of sonar data and fitting them into the contours of the ridge.
The art work (actually done by Tharp) was applauded by the public but ran into heavy
controversy among scientists; some suggested that the geologist/artist had taken liberties with the
representation by joining features where no data existed.
 Almost a half century later, with satellites and
advanced sonar methods, scientists revisited the mid-ocean ridge and fed the data, which took a
few months to collect, to a computer. The data-driven image visualized by the computer agreed
with 95 percent of Tharp's rendition.
Lamont-Doherty researchers have used both the art and science of visualization for years in delineating how geological phenomena, from ocean circulation shifts to volcanic eruptions, continually change the shape of our globe. One example is a computer- generated animation, showing how the giant tectonic plates under the Pacific Ocean have spread apart over the past 10 million years.
In an expedition closer to home, a geological/seismological team led by Art Lerner-Lam and John Mutter is examining the subtle splitting of the North American continent, which scientists believe is breaking apart at rates up to 1.5 cm per year, or 20 miles in 2 million years. The project, known as BARGE (Basin And Range Geological Experiment), is designed to observe and image the slow-motion split-up through a unique window into the Earth, Lake Mead. As chance would have it, this 600-foot-deep, man-made recreational lake behind Boulder (Hoover) Dam is the only large navigable body of water over the continent's so-called "breakaway zone," an area extending from Mexico to Canada along which the Earth's crust has been stretched thin and is on the verge of rifting.
Geologists envision that the process will separate the western United States from the rest of the continent, just as millennia ago the Arabian Peninsula separated from Africa to form the Red Sea. The Gulf of California would then broaden into a new body of water, with its coastline extending north from the Nevada-Arizona border through Utah and beyond Yellowstone National Park.
The scientists have borrowed technology from their oceanic experiments to carry out a geological scan of the bottom of the lake and the crust below. The scanning was done from barges, using an array of air guns to fire compressed air into the water. The pulses of sonic energy generated were powerful enough to penetrate almost 20 km down into the crust beneath the lake bottom. As in ultrasonography, the reflected sound waves bounce off their target and strike detectors. In the case of Project BARGE, the sonic energy reflected from the lake bottom is picked up by a mile-long string of hydrophones floating behind the barges.
So far the scientists have covered all of Lake Mead's major basins, along with those up the Colorado River toward the Grand Canyon. Data were collected by portable seismometers buried a foot into the ground at points around the lake. Converting the combined data from lake and land into high-resolution images, the scientists hope to visualize the forces that stretch and thin the continental crust.
 A project aimed at finding new sources of oil along
fault lines uses visualization to make oil drilling less invasive to the Earth. Roger N. Anderson,
who heads the Global Basins Research
Network (GBRN), a 6-year-old multidisciplinary Internet organization, has been collecting
data around an active fault zone in the Gulf of
Mexico, where the Pennzoil Company recently
drilled a development well. Anderson's objective is to locate natural underground hydrocarbon
"streams" that may be percolating upward to shallower reservoirs from deep source rocks. "If we
figure out how oil moves up faults, we can tap nature's way of getting it out, as opposed to
drilling deep and expensive wells," he says.
Anderson's method uses the computer to visualize the dynamic motion of the upward oil migration. The colorful computer images strip away the layers of sediment in the basin to reveal oil reservoirs and pathways, providing clues, the scientists hope, to potential strategies for delivering this untapped oil source to the wellhead. The test was performed on Eugene Island on a fairly recent field, geologically speaking, that has yielded more than 1 billion barrels of oil and gas equivalents since 1972. Researchers found proof of seepage along the fault line, thus verifying their migration theory and improving the industry's understanding of hydrocarbon movement. GBRN is working on developing a mechanism to extract the oil profitably.
Lamont-Doherty scientists also have enlisted their computer visualization models to explore a notorious climatic phenomenon: El Niño, the periodic shift of the tropical Pacific surface temperature, named after the child Jesus because it occurs around Christmas. It is linked to the Southern Oscillation, in which sea-level air pressure seesaws from high to low between the Australian-Indonesian region and the eastern subtropical Pacific. When high in the Pacific, it is low in the Indian Ocean from Africa to Australia.
As El Niño develops, certain global weather events occur, sometimes with devastating results. In 1982 an intense Niño affected areas ranging from Indonesia, Eastern Australia, and southern Africa to the western United States, causing forest fires, flooding, droughts, poor harvests, a collapse of fisheries, thousands of deaths, and more than $13 billion in damages worldwide.
Last year Columbia scientists Mark A. Cane and Gidon Eshel used the Lamont-Doherty model of El Niño to show the possibility of predicting the size of the southern African maize harvest a year in advance. The forecasting method is based on crop and weather data from a 23-year period showing that warmer-than-usual surface temperatures in El Niño often heralded a poor corn crop in Zimbabwe. The scientists suggest this long-range forecasting tool might help farmers throughout the world by predicting drought.


