 (1)General Overview of Mies van der Rohe's 1951
building
(1)General Overview of Mies van der Rohe's 1951
building
As published in Progressive Architecture, November 1995, pp 58, 59.
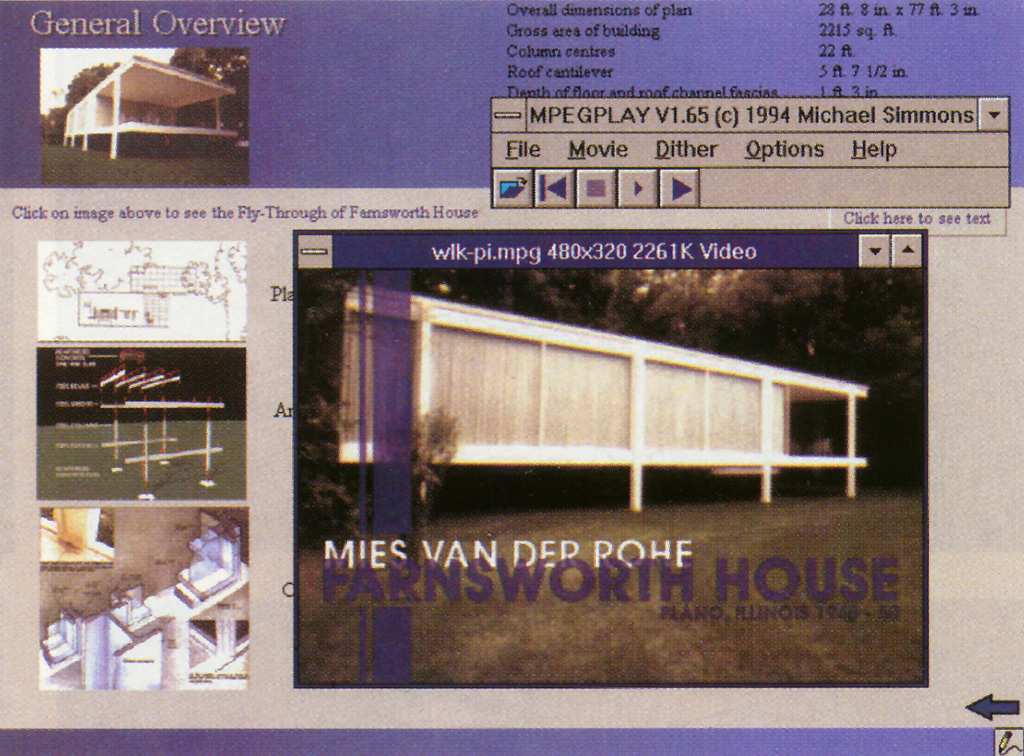
A new computer tool that documents and analyzes a modern landmark - the first in a series - is a boon to students, scholars, and architect's alike.
The Farnsworth House Volume, created by the Building Technologies Group at Columbia University, provides multimedia documentation and analysis of Mies van der Rohe's 1951 building in a computerized, networked environment. The Farnsworth House package combines primary source materials and a variety of interactive models presenting a broad spectrum of information previously unavailable in a single, unified format. The use of a simple graphic menu to access an array of data makes the package both an ideal tool for teaching architecture and engineering students, and a scholarly resource for practicing architects and historians. The package is availiable for direct use on work stations in university labs and classrooms, and for limited access via the World Wide Web.
(1)General Overview of Mies van der Rohe's 1951
building
Data and Analysis
The Farnsworth Volume includes a number of features. A general
overview of
the building (1) has an animated fly-through, presenting its spatial
organization, and a textual/audio summary of the building's key features
and technological importance. There are selected details (2) consisting
of three-dimensional computer models, photograhs, and drawings of
construction details. Emphasis is placed upon integration and overlap of
technical systems and their impact on the building's formal and spatial
expression. Three-dimensional computer models of the enclosure and
structural systems can be manipulated, allowing different views and the
selective removal of components to enhance one's understanding of the
house's material assembly.
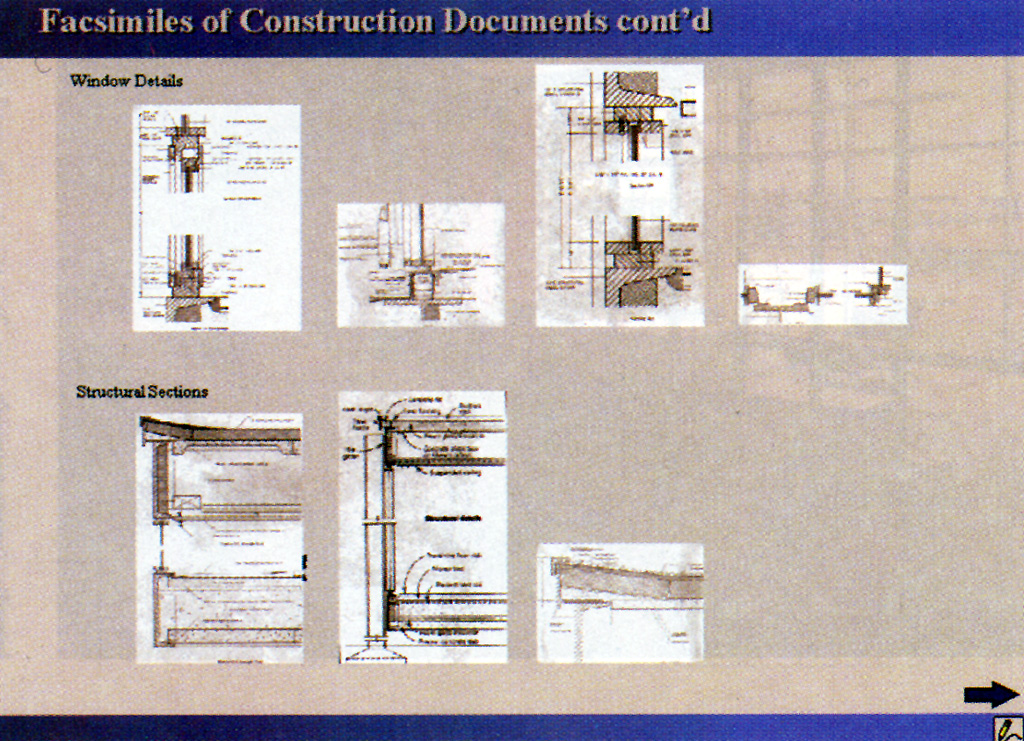 (2)Drawings and Photographic Details
There is a variety of technical analyses, including interactive studies of Farnsworth's structure, cladding, and atmospheric control systems. Structral analyses include a finite element analysis program and three-dimensional models and animations(3). Thermal performance of the building's envelope and radiant heating systems is shown through spreadsheets and plans. The interactive capabilities of these analyses allow users to explore how, for example, changing the relationships of its skeleton components might alter the Farnworth's stuctural behavior. Also included are original construction drawings scanned at high resolution and organized into point-and-click maps - allowing magnification around areas of a user's interest. Specifications and other text-based data exist as searchable documents. An animated construction sequence focuses on the building's unique details, while an image gallery of historical photographs traces its develpment from construction to its present-day condition. Searchable versions of published essays provide critical information on the architectural, technical, and social impact of Farnsworth, along with a selected bibliography.
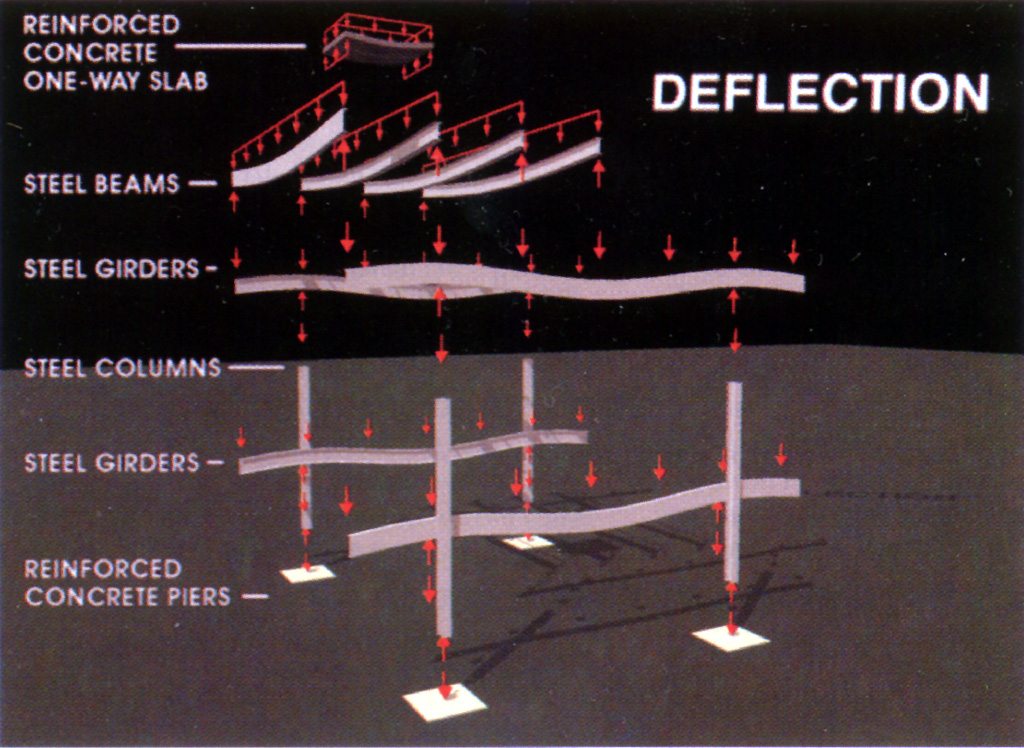 (3)Analysis of the Building's Structure
Significance of the Results
The synthesis of this wide range of data allows students, scholars,
and practitioners to achieve an understanding of the relationship of
technology to architecture that would be very hard to achieve through
conventional means. Construction documents, usually found only in
architectural or engineering firm archives, are difficult to access.
Actual constructed details, showing material connections, are rarely
available. Software packages might be employed individually by
consultants during the design process to study structural behavior,
thermal performance, and three-dimensional orgnaization, but rarely are
these programs used in an interdisciplinary way to show relationships
between technology and architecture's spatial and formal development.
The Farnsworth House prototype is being used as a teaching tool for both engineering and architectural students. It allows engineering students to conceptualize engineering as a design science rather than as a purely abstract discipline. It also increases the rate at which architecture students understand relationships between envelope, thermal transfer, spatial considerations, and history. For example, in senior level engineering and architectural building design courses, students are asked to use construction document data to perform detailed structural and thermal analyses of the building; to compare Farnsworth to related structures; and to work with three-dimensional models to update systematically the building's technical systems. Students are also asked to develop a plausible construction sequence of their modifications.
Computer Interfaces
Interfaces for the Farnsworth House package exist on Micorsoft Powerpoint
for the PC, Irix Showcase for Silicon Graphic computers, and Netscape for
PC, Mac, and Unix-based World Wide Web browsers. The Powerpoint,
Showcase, and Netscape interfaces are used as "meta front ends," serving
as primary navigation and display tools, and also for launching
stand-alone applications seemlessly. For example, when a user viewing a
technical report wants detailed informations on the thermal performance of
Farnsworth House's enclosure system, she can click on the appropriate
symbol to launch Excel's display of a heat-loss spreadsheet. At this
point, she can modify the spreadsheet to see the effect of changes to the
building envelope on thermal performance. This type of launching exists
for animations (using Mpegplay), structural analyses (using Staad, Ideas,
or Stardyne), thermal analyses (via Excel), and three-dimensional models
(using Autocad, Softimage, or Form-Z). The Showcase, Powerpoint, and
Netscape interfaces all have the same look and feel, allowing students to
work from a variety of computer systems without need to learn a variety of
interfaces.
The Farnsworth House Volume was created using Softimage, Eddie, Showcase, Form-Z, Premiere, Photomorph, Photoshop, Illustrator, Fusion Recorder, Powerpoint, and the application software mentioned above. Project hardware includes an SGI Indy, a Powermac 7100 AV, one Pentium and one 486/dx-4 PC, two scanners, and a VCR. Farnsworth is presented to students in electronic classrooms. Classwork is done in computer laboratories using PCs or Silicon Graphics computers. Out-of-class assignments are completed via the World Wide Web using Netscape on PCs, Macs, and Unix-based computers. The World Wide Web version of the Farnsworth Volume is available to a select group of outside schools of NSF's Gateway Coalition, which was a major sponsor of the work.
The Farnsworth Volume is the first in a series being developed as part of Columbia's ongoing Architectural Anatomy Research Project, directed by Anthony Webster. Additional volumes currently under development include the PATechnology Center, Richard Rogers Architects, Ove Arup and Partners and Robert Silman Associates, structural engineers; (P/A, Aug. 1985, pp. 67-74) and the U.S. Pavilion at the World Exposition 1970, Davis Brody Architects, David Geiger, engineer.
For more information contact: Anthony Webster, Director of Building Technologies, Graduate School of Architecture, Planning and Preservation, Columbia University, New York, NY, 10027; phone: (212)854-3596; fax (212) 864-0410; e-mail: [email protected]; World Wide Web: http://www.cc.columbia.edu/~archpub/BT/BT.html.
Credits
Project director: Anthony Webster; producer: Morton B. Friedman; design:
Peter Rosenbaum; animation: Chris Fox, Peter Oberdorfer; photographs:
Michelle Kriebel, Ted Arleo; 3-D modeling: Liane Hancock, Laura Reuwee;
heat-loss analysis: Quill Hyde, Anthony Webster; narration: John Matouk;
research: Elizabeth Leber.