
Report of the board of directors to the stockholders
(New York : [s.n.], 1913-)
|
||

 Click here and hold to drag menu around
|


|
|
|
|
| 1913: Page 46 |
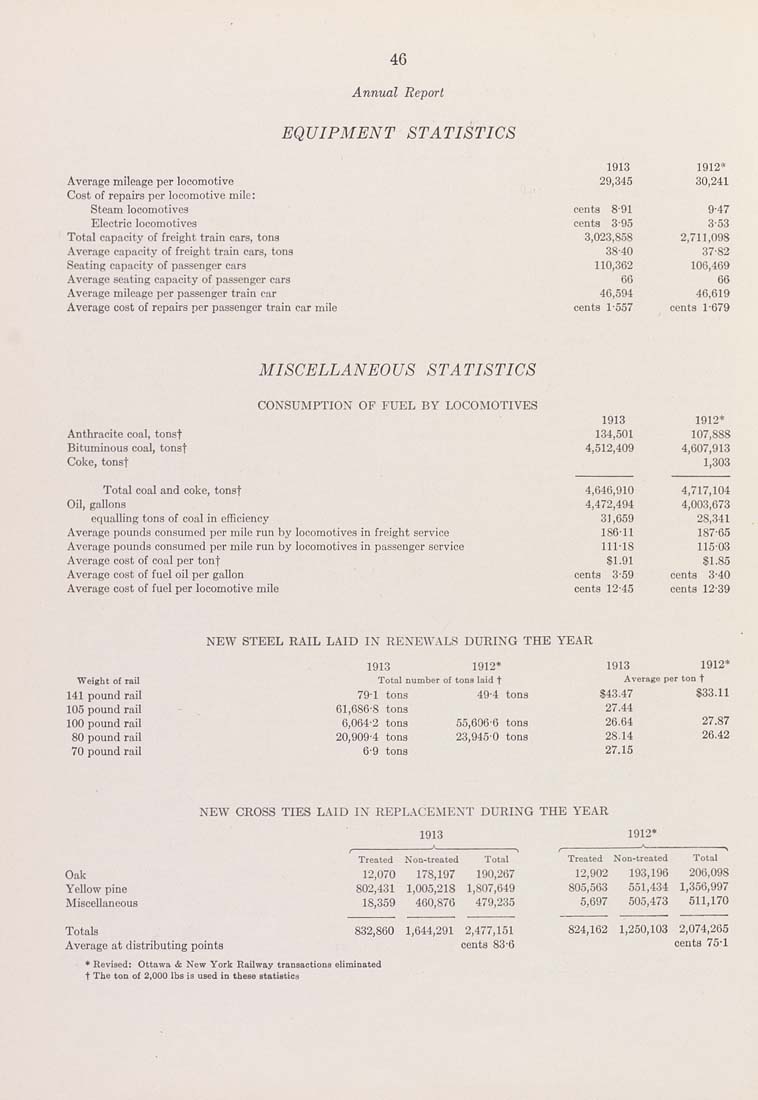
46 Annual Report EQUIPMENT STATISTICS Average mileage per locomotive Cost of repairs per locomotive mile: Steam locomotives Electric locomotives Total capacity of freight train cars, tons Average capacity of freight train cars, tons Seating capacity of passenger cars Average seating capacity of passenger cars Average mileage per passenger train car Average cost of rei)air3 per passenger train car r 1913 1912* 29,345 30,241 cents 8-91 9-47 cents 3-95 3-53 3,023,858 2,711,098 38-40 37-82 110,362 106,469 66 66 46,594 46,619 cents 1-557 cents 1-679 MISCELLANEOUS STATISTICS CONSUMPTION OF FUEL BY LOCOMOTIVES Anthracite coal, tonsf Bituminous coal, tonaf Coke, tonsf Total coal and coke, tonsf Oil, gallons equalling tons of coal in efficiency Average pounds consumed per mile run by locomotives in freight service Average pounds consumed per mile run by locomotives in passenger service Average cost of coal per tonf Average cost of fuel oil per gallon Average cost of fuel per locomotive mile 1913 1912* 134,501 107,888 4,512,409 4,607,913 1,303 4,646,910 4,717,104 4,472,494 4,003,673 31,659 28,341 186-11 187-65 111-18 115-03 tl.91 81.85 cents 3-59 cents 3-40 cents 12-45 cents 12-39 NEW STEEL RAIL LAID IN RENEWALS DURING THE YEAR Weight of rail 141 pound rail 105 pound rail 100 pound rail 80 pound rail 70 pound rail 1913 1912" 1913 1912* Total number of tons laid t Ave irago per t ont 79-1 tons 4i)-4 tons S43.47 S33.ll 61,686-8 tons 27.44 6,064-2 tons 55,606-6 tons 26,64 27.87 20,909-4 tons 23,945-0 tons 28.14 26.42 6-9 tons 27.15 NEW CROSS TIES LAID IX REPLACEMENT DURING THE YEAR 1913 Oak Yellow pine Miscellaneous Totals Average at distributing points Treated Non-treated Total 12,070 178,197 190,267 802,431 1,005,218 1,807,649 18,359 460,876 479,235 832,860 1,644,291 2,477,151 cents 83-6 1912* Treated Noo-treated Total 12,902 193,196 206,098 805,563 551,434 1,356,997 5,697 505,473 511,170 824,162 1,250,103 2,074,265 cents 75-1 |
| 1913: Page 46 |