
Annual report together with statistics and other data for the year ...
(New York, N.Y. : The Company, )
|
||

 Click here and hold to drag menu around
|


|
|
|
|
| 1943: Page 48 |
48
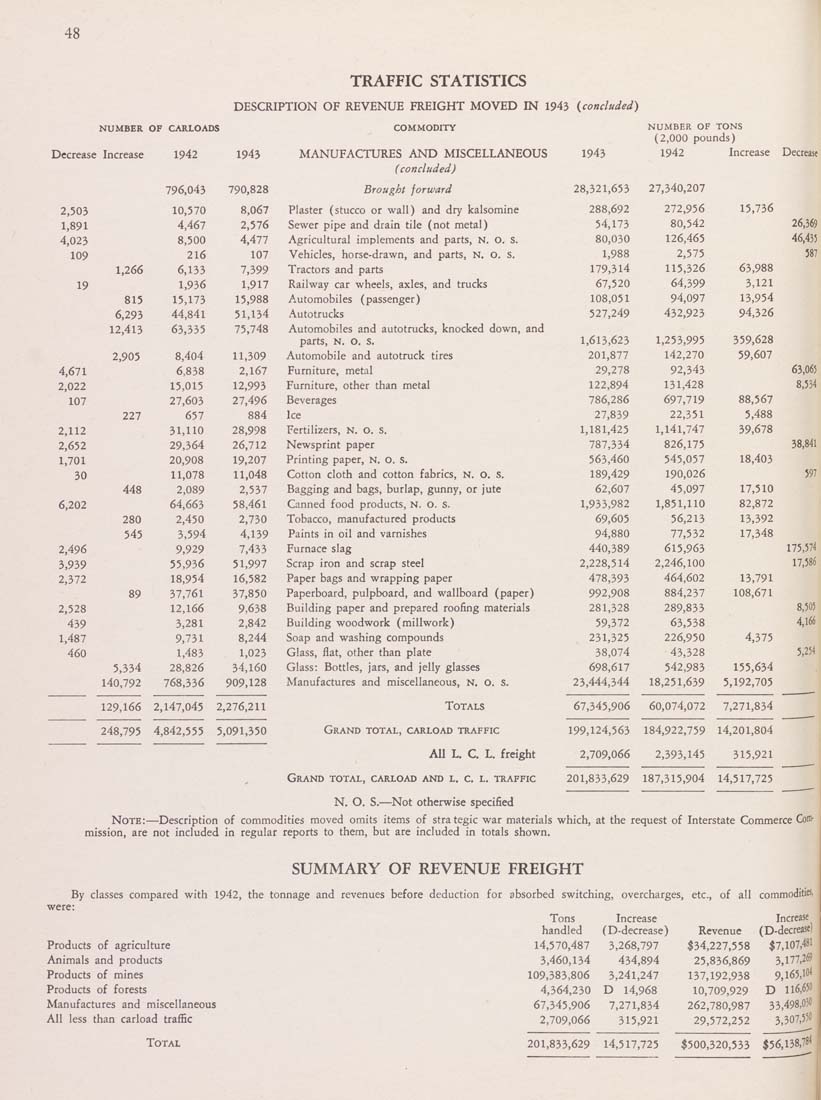
TRAFFIC STATISTICS
DESCRIPTION OF REVENUE FREIGHT MOVED IN 1943 {concluded)
NUMBER OF CARLOADS
Decrease Increase 1942 1943
796,043
790,828
2,503
10,570
8,067
1,891
4,467
2,576
4,023
8,500
4,477
109
216
107
1,266
6,133
7,399
19
1,936
1,917
815
15,173
15,988
6,293
44,841
51,134
12,413
63,335
75,748
2,905
8,404
11,309
4,671
6,838
2,167
2,022
15,015
12,993
107
27,603
27,496
227
657
884
2,112
31,110
28,998
2,652
29,364
26,712
1,701
20,908
19,207
30
11,078
11,048
448
2,089
2,537
6,202
64,66i
58,461
280
2,450
2,730
545
3,594
4,139
2,496
9,929
7,433
3,939
55,936
51,997
2,372
18,954
16,582
89
37,761
37,850
2,528
12,166
9,638
439
3,281
2,842
1,487
9,731
8,244
460
1,483
1,023
5,334
28,826
34,160
140,792
768,336
909,128
129,166
2,147,045
2,276,211
248,795
4,842,555
5,091,350
COMMODITY
MANUFACTURES AND MISCELLANEOUS
(concluded)
Brought forward
Plaster (stucco or wall) and dry kalsomine
Sewer pipe and drain tile (not metal)
Agricultural implements and parts, N. O. S.
Vehicles, horse-drawn, and parts, N, O. S.
Tractors and parts
Railway car wheels, axles, and trucks
Automobiles (passenger)
.Autotrucks
Automobiles and autotrucks, knocked down, and
parts, N. o. S.
Automobile and autotruck tires
Furniture, metal
Furniture, other than metal
Beverages
Ice
Fertilizers, N. o. S.
Newsprint paper
Printing paper, N. o. s.
Cotton cloth and cotton fabrics, N. o. s.
Bagging and bags, burlap, gunny, or jute
Canned food products, N. o. s.
Tobacco, manufactured products
Paints in oil and varnishes
Furnace slag
Scrap iron and scrap steel
Paper bags and wrapping paper
Paperboard, pulpboard, and wallboard (paper)
Building paper and prepared roofing materials
Building woodwork (millwork)
Soap and washing compounds
Glass, flat, other than plate
Glass: Bottles, jars, and jelly glasses
Manufactures and miscellaneous, N, o. s.
Totals
Grand total, carload traffic
All L. C. L. freight
Grand total, carload and l. c. l. traffic
NUMBER OF TONS
(2,000 pounds)
1943
1942
Increase
28,321,653
27,340,207
288,692
272,956
15,736
54,173
80,542
80,030
126,465
1,988
2,575
179,314
115,326
63,988
67,520
64,399
3,121
108,051
94,097
13,954
527,249
432,923
94,326
1,613,623
1,253,995
359,628
201,877
142,270
59,607
29,278
92,343
122,894
131,428
786,286
697,719
88,567
27,839
22,351
5,488
1,181,425
1,141,747
39,678
787,334
826,175
563,460
545,057
18,403
189,429
190,026
62,607
45,097
17,510
1,933,982
1,851,110
82,872
69,605
56,213
13,392
94,880
77,532
17,348
440,389
615,963
2,228,514
2,246,100
478,393
464,602
13,791
992,908
884,237
108,671
281,328
289,833
59,372
63,538
231,325
226,950
4,375
38,074
43,328
698,617
542,983
155,634
23,444,344
18,251,639
5,192,705
67,345,906
60,074,072
7,271,834
199,124,563 184,922,759 14,201,804
2,709,066 2,393,145 315,921
201,833,629 187,315,904 14,517,725
N. O. S.—Not otherwise specified
Note:—Description of commodities moved omits items of strategic war materials which, at the request of Interstate Commerce Com¬
mission, are not included in regular reports to them, but are included in totals shown.
SUMMARY OF REVENUE FREIGHT
By classes compared with 1942, the tonnage and revenues before deduction for absorbed switching, overcharges, etc., of all commodiW*'
Products of agriculture
Animals and products
Products of mines
Products of forests
Manufactures and miscellaneous
All less than carload traffic
Total
Tons
Increase
Increase
handled
(D-decrease)
Revenue
(D-decrease)
14,570,487
3,268,797
$34,227,558
$7,107,481
3,460,134
434,894
25,836,869
3,177,269
109,383,806
3,241,247
137,192,938
9,165,10^
4,364,230
D 14,968
10,709,929
D 116,65»
67,345,906
7,271,834
262,780,987
33,498,03"
2,709,066
315,921
29,572,252
3,307,550
201,833,629
14,517,725
$500,320,533
$56,138,78^
|
| 1943: Page 48 |