
Annual report together with statistics and other data for the year ...
(New York, N.Y. : The Company, )
|
||

 Click here and hold to drag menu around
|


|
|
|
|
| 1945: Page 54 |
54
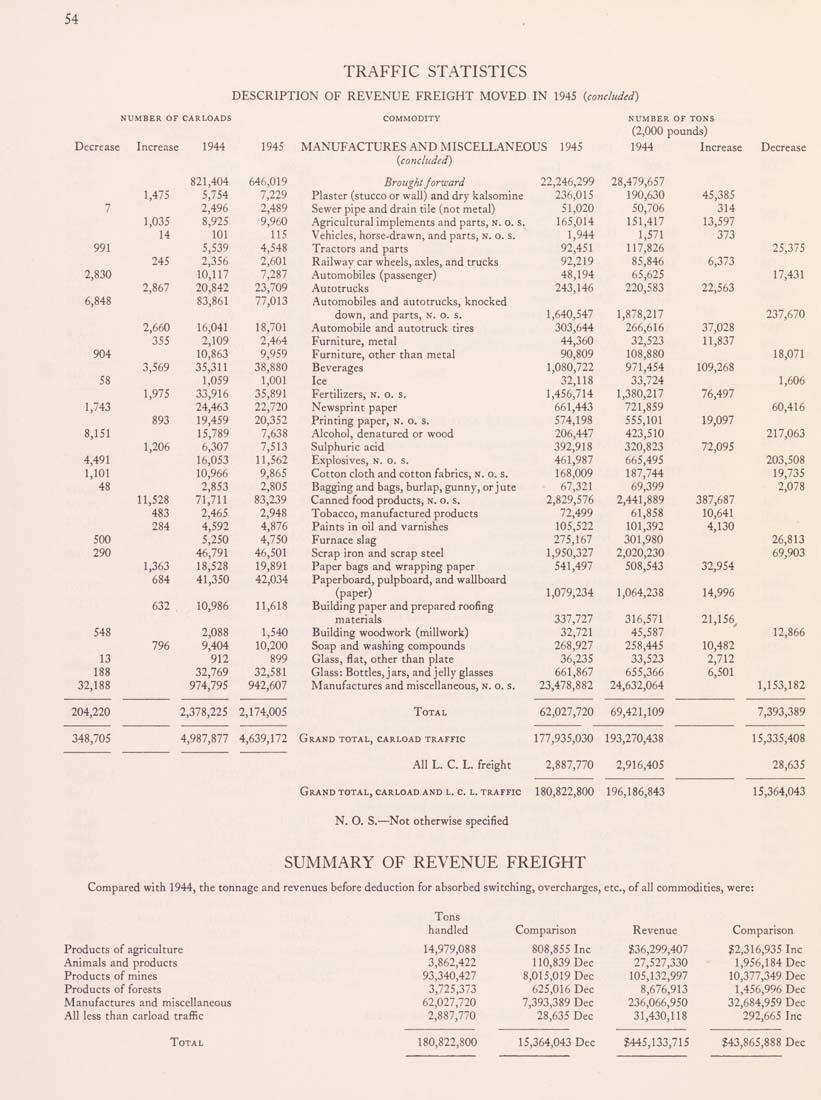
TRAFFIC STATISTICS
DESCRIPTION OF REVENUE FREIGHT MOVED IN 1945 {concluded)
NUMBER OF CARLOADS
Decrease Increase 1944
1945
821,404
646,019
1,475
5,754
7,229
7
2,496
2,489
1,035
8,925
9,960
14
101
115
991
5,539
4,548
245
2,356
2,601
2,830
10,117
7,287
2,867
20,842
23,709
6,848
83,861
77,013
2,660
16,041
18,701
355
2,109
2,464
904
10,863
9,959
3,569
35,311
38,880
58
1,059
1,001
1,975
33,916
35,891
1,743
24,463
22,720
893
19,459
20,352
8,151
15,789
7,638
1,206
6,307
7,513
4,491
16,053
11,562
1,101
10,966
9,865
48
2,853
2,805
11,528
71,711
83,239
483
2,465
2,948
284
4,592
4,876
500
5,250
4,750
290
46,791
46,501
1,363
18,528
19,891
684
41,350
42,034
632
10,986
11,618
548
2,088
1,540
796
9,404
10,200
13
912
899
188
32,769
32,581
32,188
974,795
942,607
204,220
348,705
2,378,225 2,174,005
COMMODITY
MANUFACTURES AND MISCELLANEOUS
{concluded)
Brought forward
Plaster (stucco or wall) and dry kalsomine
Sewer pipe and drain tile (not metal)
Agricultural implements and parts, n. o. s.
Vehicles, horse-drawn, and parts, n. o. s.
Tractors and parts
Railway car wheels, axles, and trucks
Automobiles (passenger)
Autotrucks
Automobiles and autotrucks, knocked
down, and parts, n. o. s.
Automobile and autotruck tires
Furniture, metal
Furniture, other than metal
Beverages
Ice
Fertilizers, n. o. s.
Newsprint paper
Printing paper, n. o. s.
Alcohol, denatured or wood
Sulphuric acid
Explosives, n. o. s.
Cotton cloth and cotton fabrics, n. o. s.
Bagging and bags, burlap, gunny, or jute
Canned food products, n. o. s.
Tobacco, manufactured products
Paints in oil and varnishes
Furnace slag
Scrap iron and scrap steel
Paper bags and wrapping paper
Paperboard, pulpboard, and wallboard
(paper)
Building paper and prepared roofing
materials
Building woodwork (millwork)
Soap and washing compounds
Glass, flat, other than plate
Glass: Bottles, jars, and jelly glasses
Manufactures and miscellaneous, n. o. s.
Total
4,987,877 4,639,172 Grand total, carload traffic
All L. C. L. freight
Grand total, carload and l. c. l. traffic
NUMBER OF TONS
(2,000 pounds)
US 1945
1944
Increase
Decrease
22,246,299
28,479,657
236,015
190,630
45,385
51,020
50,706
314
165,014
151,417
13,597
1,944
1,571
373
92,451
117,826
25,375
92,219
85,846
6,373
48,194
65,625
17,431
243,146
220,583
22,563
1,640,547
1,878,217
237,670
303,644
266,616
37,028
44,360
32,523
11,837
90,809
108,880
18,071
1,080,722
971,454
109,268
32,118
33,724
1,606
1,456,714
1,380,217
76,497
661,443
721,859
60,416
574,198
555,101
19,097
206,447
423,510
217,063
392,918
320,823
72,095
461,987
665,495
203,508
168,009
187,744
19,735
67,321
69,399
2,078
2,829,576
2,441,889
387,687
72,499
61,858
10,641
105,522
101,392
4,130
275,167
301,980
26,813
1,950,327
2,020,230
69,903
541,497
508,543
32,954
1,079,234
1,064,238
14,996
337,727
316,571
21,156
32,721
45,587
12,866
268,927
258,445
10,482
36,235
33,523
2,712
661,867
655,366
6,501
23,478,882
24,632,064
1,153,182
62,027,720
69,421,109
7,393,389
177,935,030
193,270,438
15,335,408
2,887,770
2,916,405
28,635
180,822,800
196,186,843
15,364,043
N. O. S.—Not otherwise specified
SUMMARY OF REVENUE FREIGHT
Compared with 1944, the tonnage and revenues before deduction for absorbed switching, overcharges, etc., of all commodities, were:
Products of agriculture
Animals and products
Products of mines
Products of forests
Manufactures and miscellaneous
All less than carload traffic
Total
Tons
handled
14,979,088
3,862,422
93,340,427
3,725,373
62,027,720
2,887,770
Comparison
808,855 Inc
110,839 Dec
8,015,019 Dec
625,016 Dec
7,393,389 Dec
28,635 Dec
Revenue
$36,299,407
27,527,330
105,132,997
8,676,913
236,066,950
31,430,118
Comparison
$2,316,935 Inc
1,956,184 Dec
10,377,349 Dec
1,456,996 Dec
32,684,959 Dec
292,665 Inc
180,822,800
15,364,043 Dec
$445,133,715
$43,865,888 Dec
|
| 1945: Page 54 |