
Annual statistical report
(New York, N.Y. : The Company, )
|
||

 Click here and hold to drag menu around
|


|
|
|
|
| Page [2] |
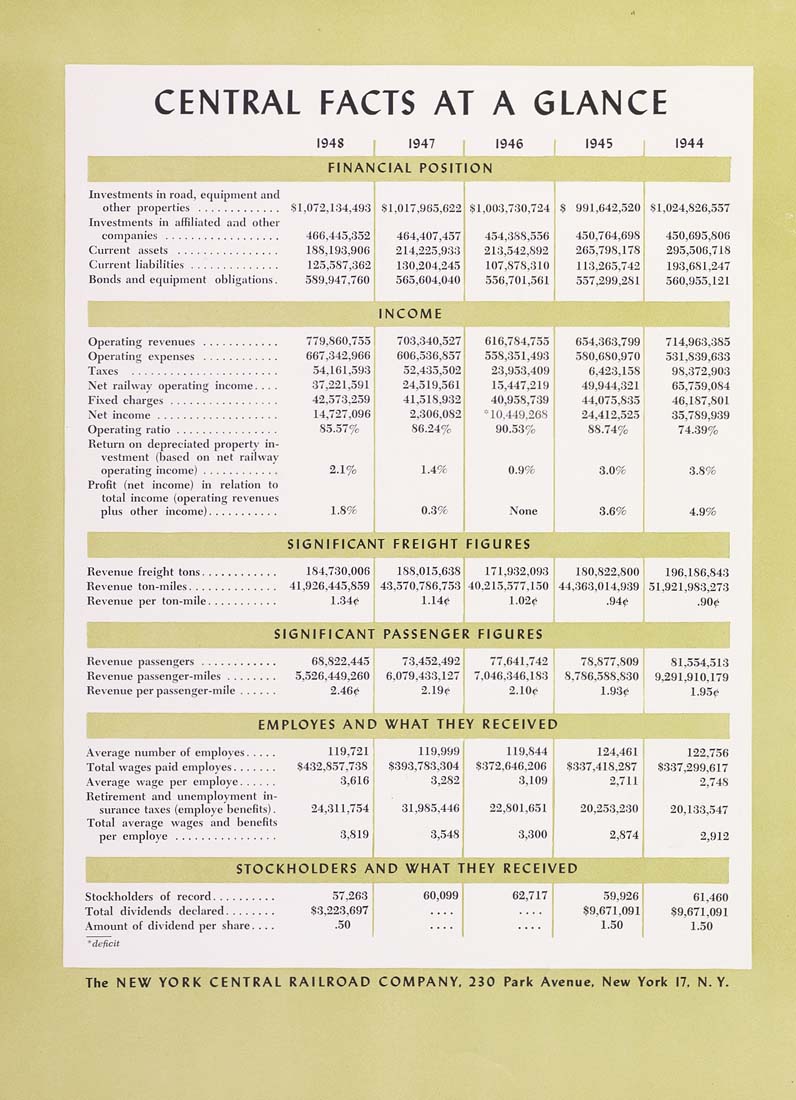
CENTRAL FACTS AT A GLANCE 1948 1947 1946 1945 1944 FINANCIAL POSITION Investments in road, e^nijimcnt and other properties ............. Si,072,134,493 Sl,01T,9fJ5,622, Sil,00:J,7:iO,724 , ^ 991,642,520 .S1,024,S26,557 Investments in affiliated and otiier j ...... 466,445,352 464,407,457 454,388,556 ...... 188,193,906 214,225,933 213,542,892 ...... 125,587,362 130,204,245 107,878,310 utions. 589,947,760 565,604,0401 556,701,561 companies ........... Cnrrent assets ......... Current liabilities....... Bonds and equipment obli: 450,764,698 450,695,806 265,798,178 j 295,506,718 113,265,742 [ 193,681,247 557,299,2811 560,955,121 779,860,755 667,342,966 54,161,593 37,221,591 42,573,259 14,727,096 85.577c 2.iy<, 1.8'X 703,340,527 606,536,857 52,435,502 24,519,561 41,318,932 2,306,082 86.24% 1.4% 0.39f 616,784,755 558,351,493 23,953,409 13,447,219 40,938,739 •10,449.268 90..5370 0.9% None 654,363,799 580,680,970 6,423,158 49,944,321 44,075,835 24,412,525 88.74% 3.0% 3.6% 714,963,385 531,839,633 98,372,903 65,759,084 46,187,801 33,789,9.39 74.39% Net railway operating income... . Net income ................... Operating ratio................ Return on depreciated property in¬ vestment (based on net railway Profit (net income) in relation to total income (operating revenues plus other income)........... 4.9% SIGNIFICANT FREIGHT FIGURES Revenue freight tons............ 184,730,006 188,015,638 171,932.0!)3 180.822.800 Revenue Ion-miles.............. 41,926,445,859 43,570,786,75:3 40.215,577.150 44.363,014,939 Revenue per ton-mile........... 1.34*^ 1.14f l.02(^ .94^ 196.186,843 i 1.921,983,273 .90^ SIGNIFICANT PASSENGER FIGURES Kevenue passeuf^ers....... Revenue passengcr-miles . . . Revenue per passenger-mile . 68,822,443 73.452.492 77,641.742 78.877.809 81,354,513 .326,449,260 6.079,433,127 ^ 7,046,346,183 8,786,588.830 9,291,910,179 2.46(» 2.19c 1 2.10c 1.93(! 1.95f EMPLOYES ANC WHAT THEY RECEIVED 119,721 119,999 119,844 124,461 122,756 $432,857,738 $393,783,304 5372,646,206 .»3.37,418,287 $337,299,617 Average wage per employe...... 3,616 3,282 3,109 2,711 2,748 Retirement and unemployment in¬ surance taxes (employe benefits). 24,311,754 31,985,446 22,801,631 20,253,230 20,133,547 Total average wages and benefits per employe ................ 3,819 3,,548 3,300 2,874 2,912 STOCKHOLDERS AND WHAT THEY RECEIVED 57,263 $3,223,697 .50 1 60,099 ::::, 02,717 •••• 1 39,926 $9,671,091 1.50 1 61,460 $9,671,091 1.50 Total dividends declared........ Amount of dividend per share. ... The NEW YORK CENTRAL RAILROAD COMPANY, 230 Park Avenue. New York 17, N. Y. |
| Page [2] |