
Pratt, Edward Ewing, Industrial causes of congestion of population in New York City
(New York : [s. n.] , 1911.)
|
||

 Click here and hold to drag menu around
|


|
|
|
|
| Page 242 |
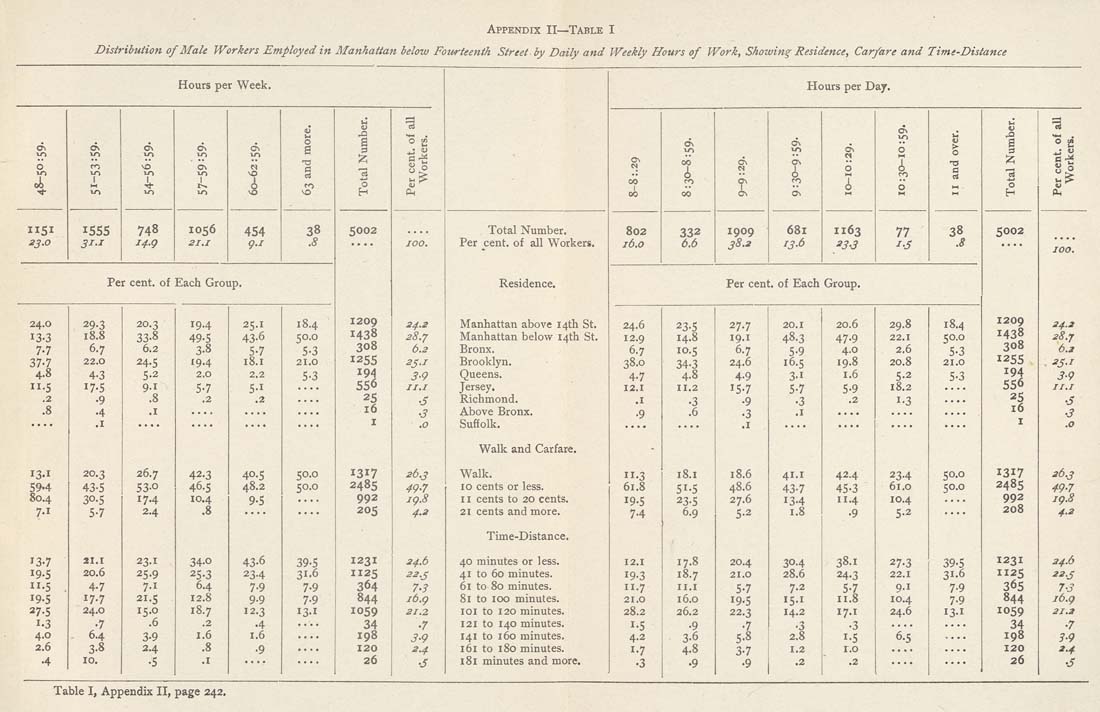
Appendix II—Table I Distribution of Male Workers Employedin Manhattan below Foitrieenth Street by Daily and Weekly Hours of Work, Showing Residence, Carfare and Time-Distance Hours per Week. 6s o\ Cv Os lo xn m m m vo o\ « in XJ-( m M 4 t^ li-1 W) 10 vo 1555 748 1056 454 31-^ i4..g 2I.I g.i Per cent, of Each Group. 38 . 29-3 20.3 19.4 25.1 18.8 33-8 49-5 43-6 6.7 6.2 3-8 5-7 22.0 24-5 [9.4 18.1 4-3 5-2 2.0 2.2 17-5 9.1 5-7 5-1 •9 .8 .2 .2 •4 .1 .1 .... .... 20.3 26.7 42-3 40.5 43-5 53-° 46.5 48.2 30-5 17.4 10.4 9-S 5-7 2.4 .8 31.1 23.1 34-0 43-6 20.6 25.9 25-3 234 4-7 7-1 6.4 7.9 17.7 21-5 12.8 9-9 24.0 15.0 18.7 12.3 •7 .6 .2 •4 6.4 3-9 1.6 1.6 3-8 2-4 .8 •9 10. •5 .1 .... 18.4 50.0 5.3 21.0 5.3 50.0 50.0 39-S 31.6 7-9 7-9 I3-I J2 s 5002 1209 1438 308 1255 194 556 25 16 1317 2485 992 205 1231 1125 364 844 I0S9 34 198 120 26 34.2 28.7 6.2 ^S-i 3-9 II.I ■S •3 .0 26.3 49-7 ig.8 4.2 24.6 22.J 7.3 ib.g 21.2 ■7 3-9 2.4 ■S Total Number. Per cent, of all Workers. Residence. Manhattan above 14th St. Manhattan below 14th St. Bronx. Brooklyn. Queens. Jersey. Richmond. Above Bronx. Suffolk. Walk and Carfare. Walk. 10 cents or less. 11 cents to 20 cents, 21 cents and more. Time-Distance. 40 minutes or less. 41 to 60 minutes. 61 to 80 minutes. 81 to 100 minutes. loi to 120 minutes. 121 to 140 minutes. 141 to 160 minutes. 161 to 180 minutes. 181 minutes and more. 802 16.0 24.6 12.9 6.7 38.0 4.7 12.1 ,1 •9 11-3 61.8 19-5 7-4 12.1 19-3 11.7 21.0 28.2 i-S 4,2 1-7 •3 Hours per Day. as »o a\ m in OS 0 00 i as 0 0 A CO 0\ 1 m i 0 00 a> 0\ M 332 1909 681 II63 77 6.6 3S.2 13.6 '3-3 '■S Per cent, of Each Group. 38 .B 23-5 27.7 20.1 20.6 29.8 14.8 19.1 48.3 47-9 22.1 10.5 6.7 5-9 4.0 2.6 34-3 24.6 16.5 19.8 20.8 4.8 4-9 3-1 1.6 5-2 II.2 iS-7 5-7 S-9 18.2 •3 ■9 •3 .2 1-3 .6 ■3 .1 .1 .... 18.1 18.6 41.1 42.4 23-4 51-5 48.6 437 45-3 61.0 23-5 27.6 13-4 11.4 10.4 6.9 5.2 1.8 •9 S-2 17.8 20.4 30.4 38.1 27-3 18.7 21.0 28.6 24-3 22.1 II.I 5-7 7.2 S-7 9.1 16.0 19,5 15.1 11.8 10.4 26.2 22.3 14.2 17.1 24.6 •9 •7 •3 -3 ---- 3.6 5-8 2.8 1-5 6.5 4.8 3-7 1.2 1.0 •9 .9 .2 .2 .... 18.4 50.0 5-3 21.0 5-3 50.0 50.0 39-S 31.6 7-9 7-9 I3-I I 5002 1209 1438 308 1255 194 556 25 16 1317 2485 992 208 1231 1125 365 844 I0S9 34 198 120 26 Table I, Appendix II, page 242. |
| Page 242 |