
Stecher, Lorle Ida, The effect of humidity on nervousness and on general efficiency
(New York : Science Press, [1916])
|
||

 Click here and hold to drag menu around
|


|
|
|
|
| Page 37 |
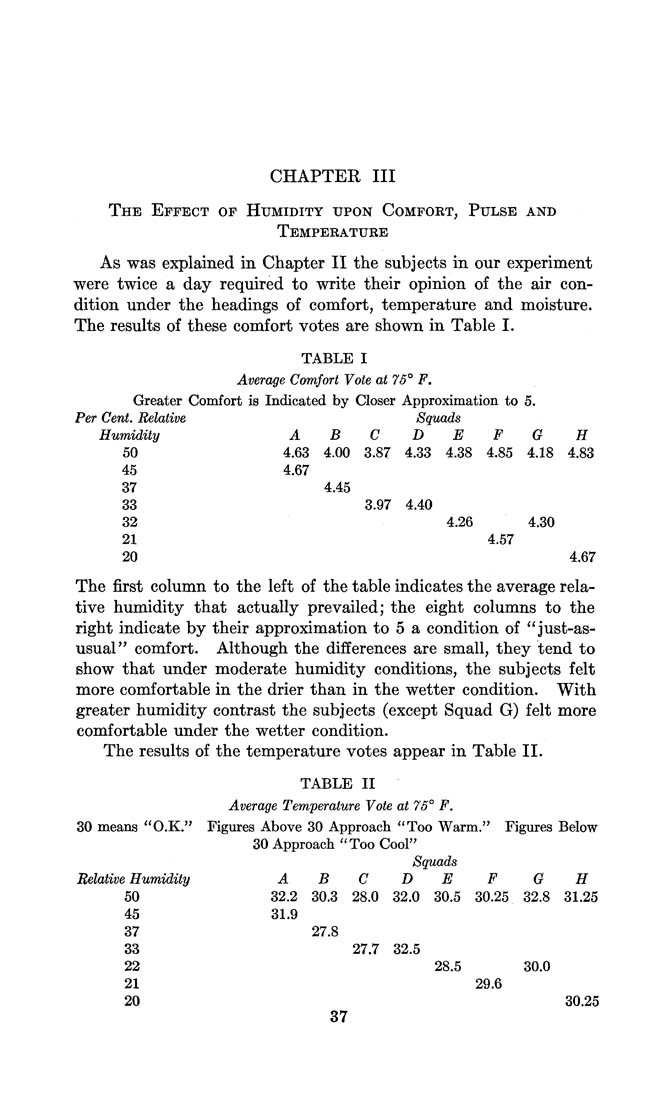
CHAPTER III The Effect of Humidity upon Comfort, Pulse and Temperature As was explained in Chapter II the subjects in our experiment were twice a day required to write their opinion of the air con¬ dition under the headings of comfort, temperature and moisture. The results of these comfort votes are shown in Table I. TABLE I Average Comfort Vote at 75° F. Greater Comfort is Indicated by Closer Approximation to 5. Per Cent. Relative Squads Humidity 50 45 37 4.45 33 3.97 4.40 32 4.26 4.30 21 4.57 20 4.67 The first column to the left of the table indicates the average rela¬ tive humidity that actually prevailed; the eight columns to the right indicate by their approximation to 5 a condition of "just-as- usual" comfort. Although the differences are small, they tend to show that under moderate humidity conditions, the subjects felt more comfortable in the drier than in the wetter condition. With greater humidity contrast the subjects (except Squad G) felt more comfortable under the wetter condition. The results of the temperature votes appear in Table II. A B C D E F G H 4.63 4.00 3.87 4.33 4.38 4.85 4.18 4.83 4.67 TABLE II Average Temperature Vote 1 at 75° F. 30 means ' 'O.K." Figures Above 30 Approach "Too Warm." Figures Below 30 Approach "Too Cool" Squads Relative Humidity ABC D E F G H 50 32.2 30.3 28.0 32.0 30.5 30.25 32.8 31.25 45 31.9 37 27.8 33 27.7 32.5 22 28.5 30.0 21 29.6 20 37 30.25 |
| Page 37 |