
Stecher, Lorle Ida, The effect of humidity on nervousness and on general efficiency
(New York : Science Press, [1916])
|
||

 Click here and hold to drag menu around
|


|
|
|
|
| Page 92 |
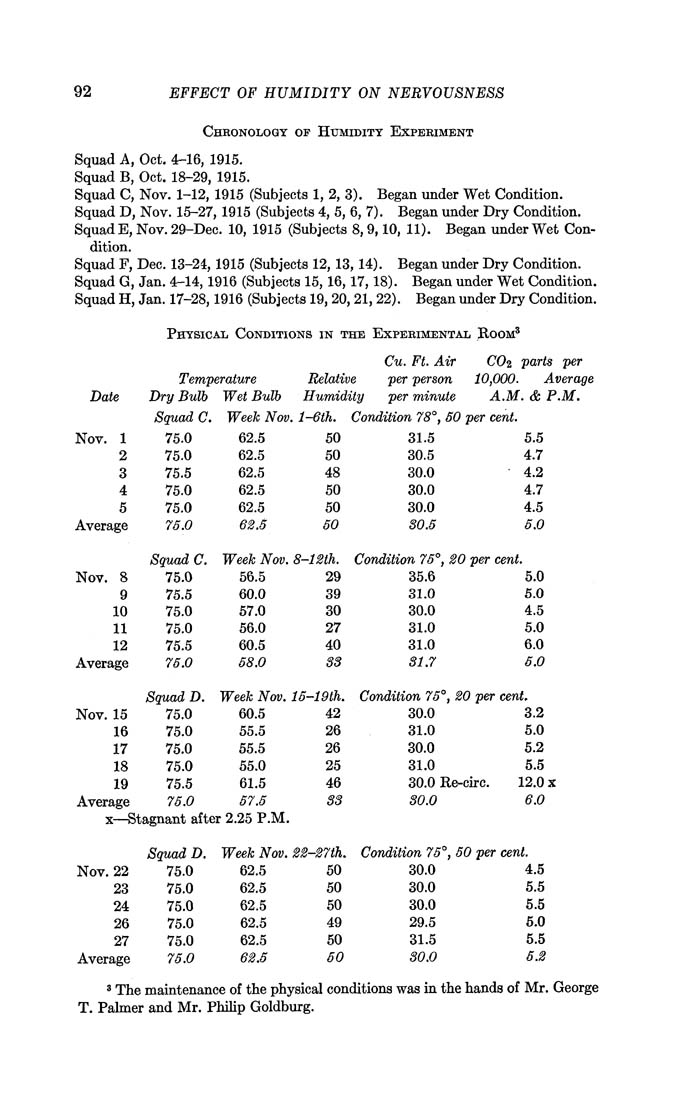
92 EFFECT OF HUMIDITY ON NERVOUSNESS Chronology of Htjmidity Experiment Squad A, Oct. 4-16, 1915. Squad B, Oct. 18-29, 1915. Squad C, Nov. 1-12, 1915 (Subjects 1, 2, 3). Began under Wet Condition. Squad D, Nov. 15-27, 1915 (Subjects 4, 5, 6, 7). Began under Dry Condition. Squad E, Nov. 29-Dec. 10, 1915 (Subjects 8,9,10, 11). Began under Wet Con¬ dition. Squad F, Dec. 13-24, 1915 (Subjects 12, 13,14). Began under Dry Condition. Squad G, Jan. 4-14,1916 (Subjects 15,16,17,18). Began under Wet Condition. Squad H, Jan. 17-28,1916 (Subjects 19,20,21,22). Began under Dry Condition. Physical Conditions in the Experimental Boom' Cu. Ft. Air CO2 parts per Average Temperature Relative per person 10,000. At Date Dry Bulb Wet Bulb Humidity per minute A.M. & P. Squad C. Week Nov, . l-6th. Condition 78°, 60 per i :ent. Nov. 1 75.0 62.5 50 31.5 5.5 2 75.0 62.5 50 30.5 4.7 3 75.5 62.5 48 30.0 • 4.2 4 75.0 62.5 50 30.0 4.7 5 75.0 62.5 50 30.0 4.5 Average 75.0 62.S 60 30.6 6.0 Squad C. Week Nov. 8-12th. Condition 76°, 20 per cent. Nov. 8 75.0 56.5 29 35.6 5.0 9 75.5 60.0 39 31.0 5.0 10 75.0 57.0 30 30.0 4.5 11 75.0 56.0 27 31.0 5.0 12 75.5 60.5 40 31.0 6.0 Average 7d.O 68.0 33 31.7 6.0 Squad D. Week Nov. 16-19th. Condition 76°, 20 per • cent. Nov. 15 75.0 60.5 42 30.0 3.2 16 75.0 55.5 26 31.0 5.0 17 75.0 55.5 26 30.0 5.2 18 75.0 55.0 25 31.0 5.5 19 75.5 61.5 46 30.0 Re-circ. 12.0 X Average 7S.0 67.6 33 30.0 6.0 X—Stagnant after 2.25 P.M. Squad D. Week Nov. 22-27th. Condition 76°, 60 per cent. Nov. 22 75.0 62.5 50 30.0 4.5 23 75.0 62.5 50 30.0 5.5 24 75.0 62.5 50 30.0 5.5 26 75.0 62.5 49 29.5 5.0 27 75.0 62.5 50 31.5 5.5 Average 76.0 62.6 60 30.0 6.2 3 The maintenance of the physical conditions was in the hands of Mr. George T. Palmer and Mr. Phihp Goldburg. |
| Page 92 |