
The Record and guide (v.39no.981(Jan. 1 1887)-no.1006(June 25 1887))
(New York, N.Y. : C.W. Sweet, -1887.)
|
||

 Click here and hold to drag menu around
|


|
|
|
|
| v. 39, no. 982: Page 28 |
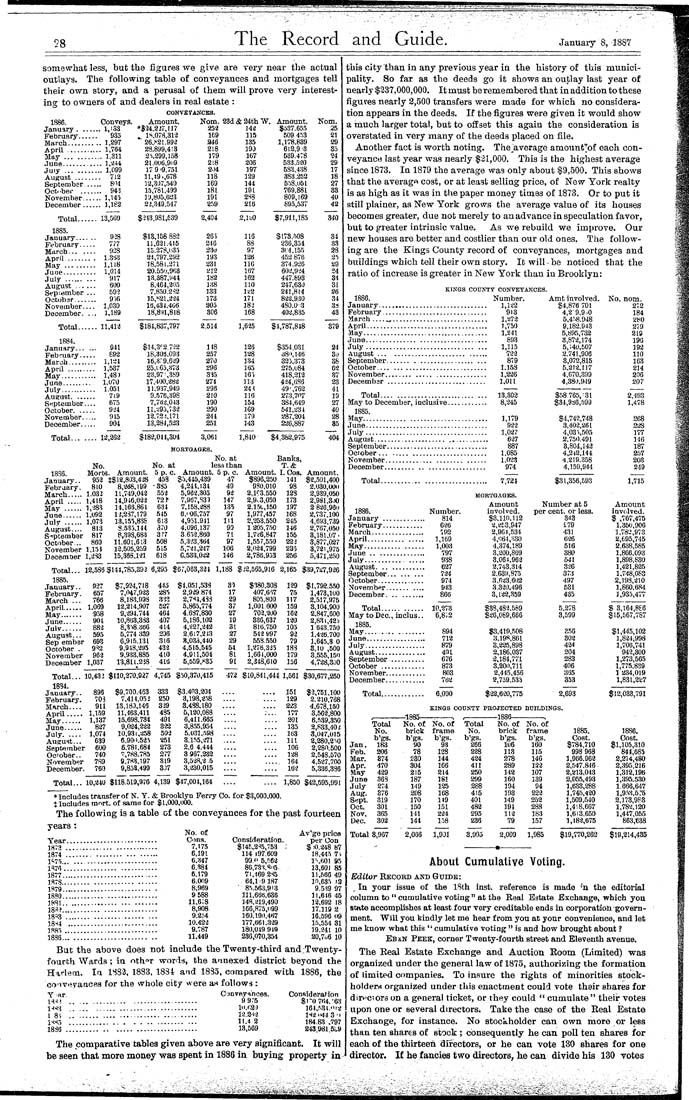
^8 The Record and Guide. January 8, 1887 somewhat less, but the figures we give are very near the actual outlays. The following table of conveyances and mortgages tell their own story, and a perusal of them will prove very interest¬ ing to owners of and dealers in real estate : 1386. Conveys. January.......I,i33 February...... 935 March.......... 1,297 April ........... 1,764 May...........1,311 .Tune............ 1,344 July ........... 1,099 August ........ 712 September ..... 8'H Get.-ber ....... 943. November...... 1,145 December...... 1,1S2 Total...... 13,509 COirVErANCES. Amount. Nom. 23d & 24th W. 1885. January. February March... April..... May 938 7?7 93S 1.3S3 1,U8 June.......... 1,014 July ....... August ... , September Octobsr___ November.. December. 917 600 593 956 1,030 1,189 Total......11,413 1884. January... February... March....... April ....... May......... Juae........ July......... August..... Suptember.. October. ... November.. December... Total... 18S6. January.. Febraary, March..... April ..... May ...... Juae...... July ...... August— S-iptembsr October... November Dscemoer 941 692 .. 1,134 . 1,537 .. 1,48) i.uro . 1.051 7i9 675 934 915 904 .. 12,263 *$34,23r,I17 ,^ 18.078,313 26,(^21.993 28.899,4! 3 21.299,158 21.006,9ii9 17 9 '9.751 11,49 .,678 12,3a7,.540 15,781.499 I'J,805,633 23,349,547 $213,981,539 $13,158 882 11,631.415 15.278,(.'3.T 24,797,293 18,581.271 20.55'.J,9^;3 13,387,M44 8,464,305 7,850,2'?2 15,«31,234 16,431.406 18,8'.n,8l8 $184,837,797 $14,3^2.7-^2 18,309.093 16,3.-9,639 25,1.65,373 23,97',389 17,400,383 11.937,949 0.576,398 7,783,043 11,395,733 13,72i,171 13,284,533 $182,041,304 253 169 346 218 179 218 2.)4 118 169 181 191 2,')9 2,404 26) 246 23a 193 231 212 182 138 133 173 205 2,514 148 257 270 296 3i5 274 296 210 190 290 241 251 3,061 143 115 135 190 167 206 197 129 144 191 2S3 218 Amount. $537,655 509 4n3 1,178,839 612,9^3 539.478 533,.530 583,438 383.352 558,051 769,881 809,169 895,537 2,1^0 $7,911,185 116 88 97 126 110 167 162 110 lz2 171 183 168 5178.508 236,354 3<.'4,155 452 876 374.926 603,934 447.893 247,63a 241,8(4 832,9.30 480.0 3 403,835 1,635 $4,787,818 126 128 134 165 165 113 24 ^ 116 154 169 179 143 $354,031 38'.M46 325,373 275,u84 418,213 434,686 49',762 273,707 384,649 541,331 287,204 226,887 1,840 $4,382,975 Nom. 25 21 29 35 24 29 17 18 27 33 40 42 340 34 33 28 25 20 24 34 31 26 34 3:i 43 379 24 3J 36 62 37 23 41 13 27 40 28 85 404 MORTGAGES. No. Morts. Amount. 953 i$ 18,803,438 810 8,3d8,l99 11,749,043 14,946,033 14.168.861 13,2S7,179 13,155,835 8.535,144 8,398,683 11.601,613 12,505,859 15,388,131 No. at No. at less than 5 p. c. Amount. 5 p. c. 1.03 J 1,418 1,383 1,092 1,073 813 817 1,151 1,333 453 •385 553 72 r 634 515 613 370 317 508 515 618 $5,445,439 4,244.134 5.963,305 7,967,831 7,158.388 6.(!06,757 4,9.51.911 4,096.137 3.653,860 5,333,364 5,731,247 C.533,032 47 49 93 147 135 97 111 90 71 97 106 146 Amount. $896,250 980,010 2,103.550 2,9.3,050 2.1-51,150 1,977,457 2,253,550 1205,7,50 l,7-<:6,847 1,557,5,50 2,024,799 2,786,933 Banks, T.& I. Cos, 141 98 123 173 197 168 245 146 155 223 235 256 Amount. $2,.501,400 3.030,0011 2,9.39,050 2,981,3j0 2 836,96u 2,737,100 4,693,7.39 2,767,050 3,181,07. 3,877,027 3,721,975 5,471,2.50 Total... 1885. ,Tauuary.. February. March ... April...... May....... June...... 904 Julr...... August... Sep ember October . November December 12,588 $144,785,393 6,295 $67,063,334 1,188 $i2,565,916 2,165 $39,737,036 927 657 1,069 958 595 693 963 1,037 $7,924,718 7,047,933 8,183,993 12,214,907 9,394,744 10,863,333 8,358.366 5,774 339 6,915.131 9,918,395 9,933.835 13,811.238 445 285 333 527 464 407 414 296 316 433 410 416 $4,051,538 2,939.874 2,7^4,433 5,865,774 4.637,830 5,186,102 4,327,342 2,617,243 8,03,i,440 4,515,545 4.911,504 5,559,H35 31 17 29 37 27 19 31 27 29 54 81 91 407,6i7 805,800 1,001.600 703,200 336,637 816.750 542 997 553.550 1,276,333 1,661,000 2,348,610 129 75 117 159 163 130 105 93 79 183 179 156 $1,792,550 1,473,100 2,517,975 3,104,900 2,847,600 2,83t,425 1 643.750 1,436.700 1,645,3 0 3,10 ,500 3,555,150 4,738,300 Total... 10,43J $110,270,937 4,745 $50,370,415 473 $10,841,444 1,561 $30,677,250 1834. January.. February. March----- April..... May...... June...... July..... August... September Oerober.. November December. 705 911 1,1.59 1,137 827 1,074 639 600 740 789 76Q $9,700,463 7,414,05 i 13,180,145 11,463,411 15,698,734 9,024,233 10,931,3.58 6,90'1.535 6.781,684 7,788.785 9,733,197 9,833,499 333 250 339 435 491 3-33 503 251 273 277 319 3J7 $3,403,204 3,198,3-58 3,488,180 5,130,088 6,411.685 3,8.55,954 5.031,.598 3.1-55,371 2,6 4,444 3967.233 3,538,3 5 3,330,015 151 129 233 177 201 135 1B3 111 106 128 164 163 $3,751,100 2.810,768 4,678,150 3,562,800 6,.5.39,350 2,833,40=! 3,047,015 2,280.2^0 2,28o:500 2,548,570 4,527,700 5,336,386 Total... 10,240 $118,519,976 4,139 $47,004,164 1,850 $42,595,991 ♦ Includes transfer of N. Y. & Brooklyn Ferry Co. for $3,000,000. $ Includes mort. of same for $l,000,o00. The following is a table of the conveyances for the past fourteen years : "" "' Av'ge price per Oon $ :0.348 87 18,445 7> 1^601 95 13,601 85 11,.566 49 10,6.35 12 9.5S9 97 11,646 45 12,692 18 17.119 2 16,596 09 15,554 31 19.341 10 20,7o6 10 But the above does not include the Twenty-third and:Twenty- fourth Wards; iu oth°r words, the amnexed district beyond the Harlem, Iu ISSJ, 1883, 183i and 1835, compared with 1886, the coiveyaaces for the whole city were as^ follows : Y ar. 13-!;.................................. l-f<3 .................-................. I 81.................................. l-«5 .............................. 1836................................... Year. 1873 . 1874 . 1376 .. 1877.. 1878... 1879... 18S0.. 18S1.. 18.^3.,, 18«3 . 18-I4 , 1885 .. 1886... No. of Cons. Consideration 7,175 $145,2^5,753 6,191 114 197.609 6,347 99." 5,-563 6.384 86,73i.3ii5. 6,179 71,469 2S5 6.009 64,1 9187 8,969 ■ 85.563,913 9 588 111,66B,638 11,6;3 148.319,490 8,908 166,875,(199 9.2,54 160.190.467 10.423 177,661.339 9,787 180,049 949 11,449 236,070,354 Cjnveyi'nces. Consideration 9 9r5 $r0 7fi4.'63 lii.»-,2) 164,r>34.'ii5j 13.2'i3 l>l3.i^4 3'' 11.4 3 184.83 ,797 13,569 243,981.5i9 this city than in any previous year in the history of this munici¬ pality. So far as the deeds go it shows an outlay last year of nearly $337,000,000. It must bsremembered that in addition to these figures nearly 2,500 transfers were made for which no considera¬ tion appears in the deeds. If the figures were given it would show a nauch larger total, but to offset this again the consideration is overstated in very many of the deeds placed on file. Another fact is worth noting. The Average amount'of each con¬ veyance last year was nearly |21,000. This is the highest average since 1873. In 1879 the average was only about $9,500. This shows that the averago cost, or at least selling price, of New York realty is as high as it was in the paper money times of 1873, Or to put it still plainer, as New York grows the average value of its houses becomes greater, due not merely to an advance in speculation favor, but to greater intrinsic value. As we rebuild we improve. Our new houses are better and costlier than our old ones. The follow¬ ing are the Kings County record of conveyances, mortgages and buildings which tell their own story. It will be noticed that the ratio of increase is greater in New York than in Brooklyn: KINGS COUNTY CONVEYANCES. 1886. Number, January................................ 1,132 Februai-y............................... 9i3 March.....,............................ 1,273 April.................................... 1,750 May..................................... 1,241 June................................... 893 July................................... 1,115 August.............................. 723 September........ ................... 879 October............................... 1.158 November___........................ 1,226 Decembar ............................. 1.011 Total.............................. l-3,.302 May to December, inclusive............ 8,345 1885. May.................................... 1,179 June.................................... 933 July.................................... 1,027 August................................. 637 September.............................. 887 October.............................. 1,085 November.......... ................. 1.033 December............................ 974 Total............................... 7,724 Amt involved. $4,876 701 4,2-9,9.0 5,4.58.948 9,182.943 5,895,732 3,873,174 5,-.40,507 2.741,906 3,072,815 5,213,117 4,670,-399 4,380,949 $.58 765,-31 $34,9^6,599 $4,742,748 3,403,261 4,035,505 2,7.50.491 3,804,143 4,242,144 4,219.358 4,159,944 $31,356,593 1886. Number. January ............. 814 February............ 636 March................ '192 April................ 1,169 May.................. 1,003 June ................ 797 July................. 938 August............. 627 September......... 734 October.............. 974 November........... 943 December.......... 866 Total............ 10,273 May to Dec, inclus.. 6,8;2 1885. May................. 894 June.................. 712 July.................. 879 August............... 491 September.......... 676 October ............. 873 November............ 803 December............ 763 Total............. 6,090 MORTGAGES. Amount involved. $3,110,112 3,353,947 2,964,534 4,064,3.80 4,374,189 3,200,809 3,064,963 2,743,314 2,63:),875 3,rr.i3.602 3.330,496 3,132,359 $38,483,589 $36,089,666 $3,419,508 3,193,861 3,225,898 2,186,037 2,184,771 3,200,711 2,445,456 2,759.533 $32,630,775 Number at 5 per cent, or less. 3^3 ^79 431 636 516 380 541 336 373 497 531 435 5,278 3,599 8.55 302 424 204 283 406 365 353 2,693 KINGS COUNTY PROJECTED BUILDINGS. The comparative tables given above are very significant. It will be seen that more money was spent in 1886 in buying property in Total No. h'gs. Jan. 183 Feb. 206 Mar. 874 Apr. 470 Way 429 June 36S July 274 Aug, 376 Sept. 319 Oct. 301 Nov. Dec. 365 302 -1865— No. of brick h'gs. 90 78 230 304 215 187 M9 208 170 . 150 141 144 No. of frame h'gs. 93 128 144 166 214 181 125 168 149 151 234 158 Total No. h'gs. 266 228 424 411 250 299 288 415 401 483 295 236 -1886--- No. of brick h'gs. 106 113 278 289 142 160 194 193 149 194 113 79 No. of frame h'gs. 160 115 146 123 107 139 94 223 252 288 183 157 1885. Cost. $784,710 998 968 1,966.962 2,547.846 2,213,043 2,055,493 1,633,288 1.745,430 i;509,.540 1,418.667 1,613,650 1,183,675 No. nom. 272 184 2ti0 279 219 196 192 110 163 214 206 207 2,493 1,478 268 228 177 146 187 257 203 249 1,715 Amount invc'lved. $ ,767,475 1.350,906 1,783,973 2,695,745 2,638,585 1,866.093 1,898,830 1,421,825 1,748,083 2,198,310 1,660,684 1,935,477 $ 3,164,8£6 $15,567,787 $1,445,102 1,834,998 1,706,741 943,300 1,273,565 1,775.839 1 234,019 1,831,2£7 $13,033,791 1886, Cost, $1,105,310 844,685 2,274,480 2,395,216 1,312,196 1,395.530 1.666,647 1,953.5^5 2,173,983 1,783,120 1,447,055 863,638 Total 3,957 2,066 1,931 3,995 8,000 1,985 $19,770,263 $19,814,435 About Cumulative Voting. Editor Record and Guide: . In your issue of the ISth inst. reference is made ""n the editorial column to " cumulative voting" at the Real Estate Exchaage, which you state accomplishes at least four very creditable ends in corporation; govern¬ ment. Will you kindly let me hear from you at your convenience, and let me know what this " cumulative voting " is and how brought about ? Ebkn Peek, corner Tvrenty-fourth street and Eleventh avenue. The Real Estate Exchange and Auction Room (Limited) was organized under the general law of 1875, authorizing the formation of limited companies. To insure the rights of minorities stock¬ holders organized under this enactment could vote their shares for dirtiesors on a general ticket, or they could " cumulate" their votes upon one or several directors. Take the case of the Real Estate Exchange, for instance. No stockholder can own more or less than ten shares of stock ; consequently he can poll ten shares for each of the thirteen difectors, or he can vote 130 shares for one director. If he fancies two directors, he can divide his 130 votes " "^^54?. '^^ ^-^-^ >^ -'^ |
| v. 39, no. 982: Page 28 |