|
According to a directive from the European Union,1 landfilling of combustible materials must be phased out within the decade. However, it is not clear that the capital investments required will be made by all of the member countries. Some of them have little WTE capacity and some - for example, Greece - none at all. The current EU installed capacity and per-capita use of WTE for the disposal of municipal solid waste is shown in Table 1.2 For comparison, the use of WTE amounts to 314 kg per capita in Japan, 252 kg in Singapore, and 105 kg in the US. One of the newcomers to WTE is China, with seven plants in operation and an estimated annual capacity of 1.6 million metric tonnes per year. Current state of the global WTE industryA 2002 review of the European WTE industry by the International Solid Waste Association showed that the total installed capacity was more than 40 million tonnes per year and the generation of electrical and thermal energy was 41 million GJ and 110 GJ, respectively (Table 1). It should be noted that, in contrast to Europe, the US makes very little use of the exhaust steam from the power-generating turbines for either district or industrial heating. A good example of cogeneration of thermal and electric energies is the Brescia WTE facility in Italy (see page 45) that provides an estimated 650 kWh of electricity per tonne of MSW combusted. In the cold season, it supplies at least as much energy as for district heating.3TABLE 1. Reported WTE capacity in Europe2
The US WTE industry represents about 23% of the global capacity; 66% of that is concentrated in seven states on the East Coast (Table 2). TABLE 2. Major users of WTE in the US4
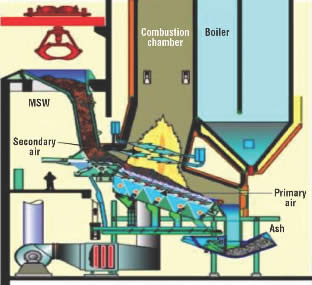
Current state of WTE technologyThe dominant WTE technology is mass burning, because of its simplicity and relatively low capital cost. The most common grate technology, developed by Martin GmbH (Munich, Germany), has an annual installed capacity of about 59 million metric tonnes. The Martin grate at the Brescia (Italy) plant is one of the newest WTE facilities in Europe. Figure 1 shows a schematic diagram of its mass-burn combustion chamber. The Von Roll (Zurich, Switzerland) mass-burning process follows with 32 million tonnes worldwide. All other mass-burning and refuse-derived- fuel (RDF) processes together have a total estimated capacity of more than 40 million tonnes.FIGURE 1. Schematic diagram of the Brescia mass-burn combustion chamber 3
|
||||||||||||||||||||||||||||||||||||||||||||||||||||||||||||||||||||||||||||||||||||||||||||||||||||||||||||||||||||||||||||||||||||||||||||||||||||||||||||||||||||||||||||||||||||||||||||||||||||||||||||||||||||||||||||||||||||||||||||
|
||||||||||||||||||||||||||||||||||||||||
WTE emissions
In the late 1980s, WTE plants were listed by the US Environmental Protection Agency (EPA) as major sources of mercury and dioxin/furan emissions. However, in response to the Maximum Available Technology (MACT) regulations promulgated in 1995 by the US EPA, the US WTE industry spent more than one billion dollars in retrofitting pollution control systems and becoming one of the lowest emitters of high temperature processes. The US EPA recently affirmed that WTE plants in the US 'produce 2800 MW of electricity with less environmental impact that almost any other source of electricity'.7Dioxins
A memorandum by Walt Stevenson of the US EPA summarizing EPA data8 showed that the emissions of the large US WTE plants (about 89% of total US capacity) decreased from 4260 grams TEQ (toxic equivalent) in 1990 to 12 grams TEQ in 2000. Figure 3 shows the post-MACT cumulative dioxin emissions of the US WTE facilities, plant by plant.8,9 The diagonal straight line shows the allowable limit of toxic dioxins (in grams TEQ) using the present EU limit of 0.1 ng/m3 and the cumulative processing rate of MSW (x-axis). It can be seen that the total emissions in the US are well below the EU limit. The fact that WTEs stopped being the major emitters of dioxins in the US is illustrated in Figure 4 that depicts the distribution of dioxin sources in recent years;8,9 it should be noted that in the same period, the total dioxin emissions in the US decreased tenfold, from 14,000 to 1100 grams TEQ.8FIGURE 3. Post-MACT cumulative dioxin emissions from US WTE plants in 2000; each point represents the emissions of a single plant, in grams TEQ 8,9
The current WTE industry in the US, and also those in other developed nations, are an insignificant source of dioxins. Modern WTE facilities in Europe have dioxin emissions that are much lower than the EU limit. For example, the level of dioxin emissions of the state-of-the-art Brescia (Italy) plant is only 0.01 ng TEQ/m3.3
FIGURE 4. The distribution of dioxin sources in the US in recent years, showing how waste-to-energy ceased to be a major contributor of dioxin emissions 8,9
Mercury
The use of mercury in the US decreased from 3000 tonnes per year in the 1970s to less than 400 tonnes by the end of the century.10 Due to the lower input and also the use of activated carbon injection and fabric bag filters, the US WTE emissions decreased by a factor of 60 between 1987 and 2000. Figure 5 shows that, by 2000, WTE mercury emissions were a small fraction of those from coal-fired power plants.FIGURE 5. Mercury emissions from WTE (1989-1999) and coal-fired
power plants 10
Environmental benefits of WTE
Despite the great reduction in emissions attained by WTE facilities in the last 15 years, some environmental groups in the US continue to oppose new WTE facilities on principle, unaware that the only alternative for MSW disposal - landfills - have much larger environmental impacts. For every tonne of waste landfilled, greenhouse gas emissions in the form of carbon dioxide increase by at least 1.3 tonnes. During the life of a modern landfill and for a mandated period after closure, aqueous effluents are collected and treated chemically; however, chemical reactions and volume decrease of the landfilled MSW can continue for decades and centuries. Thus, there is potential for future contamination of adjacent waters. It is for this reason that communities built on sandy soil, such as those in Long Island in New York State and the state of Florida have opted for WTE disposal of their MSW.Landfill gaseous emissions
Modern landfills try to collect the biogas produced by anaerobic digestion. However, the number of gas wells provided is limited (about one well per 4,000 m2 of landfill),11 so that only part of the biogas is actually collected. Landfill biogas generally contains about 54% methane and 46% carbon dioxide. On the assumption that 25% of the landfilled MSW is biodegradable (food, plant, wastes, paper, leather, wood), the maximum amount of natural gas generated by biodegradation has been estimated at 130 Nm3/metric tonne.12 The maximum capacity of landfilled MSW to produce methane is reported by Franklin13 to be 62 standard m3 of CH4 per tonne. Also, the compilation of US landfill gas data by Berenyi11 showed the annual capture of landfill gas to be 8 billion Nm3 (778 million scfd).Putting these numbers together and assuming that the landfill gas is generated only from the current deposition of MSW in US landfills (109 million tonnes in 1999) leads to the following calculation:
|
The carbon equivalent number was obtained by multiplying methane emissions by its global warming potential of 23 times that of carbon dioxide.14 This calculation for US methane emissions can be compared with the estimate of global carbon emissions from waste treatment of 60-100 million tonnes per year.15 Also, the above estimate of 1.32 tonnes of CO2 per tonne MSW is close to the estimate by Thorneloe et al.16 and lower than the estimates of about 1.5 tonnes of CO2, by Batchelor et al.,17 for Australia, and by Ayalon et al.18 for Israel.
Mercury emissions from landfills
Mercury concentration in US MSW has been estimated at about one part per million.10 On this basis, the amount of mercury disposed annually in US landfills is about 120 tonnes per year (i.e. about 25% of the present mercury consumption in the US). Most of the mercury in MSW is in metallic form (fluorescent lamps, thermometers, etc.), and the vapour pressure of mercury at landfill temperatures (40°C) is 0.007 mm Hg, as compared with the vapour pressure of water of 5.67 mm Hg at 40°C.Therefore, if an exposed water droplet evaporates in one hour, then a mercury droplet of the same size will evaporate in four weeks.10 Also, the conditions in an MSW landfill (such as temperature, moisture, and reducing capacity) are favourable for aqueous mobilization of mercury (e.g. in the form of methyl mercury). However, since both gaseous emissions and aqueous mobilization are dispersed sources, they are not easy to measure.TABLE 4. Gaseous emissions of US landfills
|
Volatile organic compounds
The annual gaseous emissions of landfills in the US can be estimated by multiplying the above estimate of non-captured landfill gas flow (about 46 Nm3 of methane plus CO2 escaping per tonne of MSW) by the reported concentrations of volatile organic compounds (VOC) in landfill gas.19 Table 4 shows the estimated emissions from US landfills, expressed on the basis of kilograms per million tonnes of MSW landfilled.The next generation of WTE processes
The existing WTE combustion chambers have been developed largely empirically. Their size, percentage of excess air used, and the volume of process gas are much larger than for coal-fired power plants of the same combustion capacity. Therefore, the capital and maintenance costs of a WTE facility are nearly three times as high as that for a coal-fired power plant generating the same amount of electricity. One of the objectives of the Waste-to-Energy Research and Technology Council is to apply engineering science in understanding the phenomena occurring in the best of the existing WTE processes and then to implement this knowledge during the design of the next generation of WTE facilities. Two obvious means for increasing the turbulence and transport rates in the WTE chamber are oxygen enrichment, as practised in the metallurgical industry, and flue gas recirculation. The latter has already been implemented very successfully in the Brescia WTE facility. Also, Martin GmbH has already piloted oxygen enrichment on a large scale and is in the process of building two 'next generation' plants, in Arnoldstein, Austria, and in Sendai, Japan, in collaboration with Mitsubishi Heavy Industries. Figure 6 is a schematic diagram of the Martin Syncom-Plus® process that will be used in these plants. In addition to oxygen enrichment of the air injected through the grate, Syncom-Plus makes use of an infrared camera for monitoring the temperature of the bed on the grate and a sophisticated control system to ensure complete combustion and produce a bottom ash that is nearly fused and ready to be used beneficially.FIGURE 6. The Syncom-Plus process of Martin GmbH 5
The WTE Research and Technology Council
During the course of several graduate studies of various facets of integrated waste management, the Earth Engineering Center (EEC) of Columbia University came to the realization that, despite the importance of WTE technology to the US, there were no industrial or government research centres dedicated to advancing the WTE technology. The only organization addressing the concerns of the US WTE facilities and of the major WTE companies (American Ref- Fuel, Covanta Energy, Montenay-Onyx, and Wheelabrator) is the Integrated Wastes Services Association (IWSA) formed in 1991. Its role does not include R&D, however.Therefore, in the spring of 2002, EEC and IWSA, with the help of Columbia's Earth Institute, founded the Waste-to- Energy Research and Technology Council (WTERT).One of the objectives is to link academic research groups working on various aspects of WTE technology, as well as engineers in the WTE industry and government agencies concerned with waste-to-energy and integrated waste management. The mission of the Council is to advance both the economic and environmental performance of waste-to-energy technologies, and this includes both conservation of resources and environmental quality.
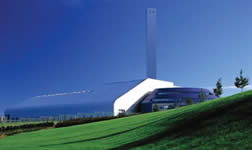
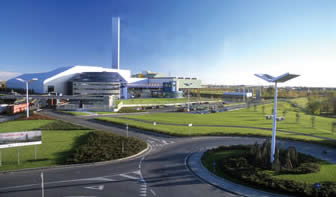
Two views of Brescia WTE facility in Italy. Photo: ASM Brescia
At the present time, WTERT is sponsored by its founders, the US EPA, the Solid Wastes Processing Division of ASME International, the Municipal Waste Management Association of the US Conference of Mayors, and other organizations. One of the services provided by WTERT is the interactive database 'SOFOS' that provides information on technical papers and reports related to the integrated management of solid wastes.
The following academic groups are currently participating in the WTERT University Consortium:
- Earth Engineering Center, Department of Earth and Environmental Engineering, and Department of Civil Engineering, Columbia University, USA
- Marine Sciences Research Center, State University of New York at Stony Brook, USA
- Department of Civil and Environmental Engineering, Temple University, USA
- Department of Applied Earth Sciences, Delft University of Technology, the Netherlands
- Sheffield University Waste Incineration Center (SUWIC), UK.
Conclusion
Worldwide, about 130 million tonnes of municipal solid wastes are combusted annually in WTE facilities that produce electricity and steam for district heating and also recover metals for recycling. Since 2001, there have been 47 new WTE facilities that either have started or are under construction, adding 6 million tonnes to the total capacity. WTE expansion in the US has been stymied by environmental opposition that does not consider the enormous reduction in gas emissions made by the US WTE industry following implementation of the US EPA regulations for Maximum Available Control Technology and by the fact that existing legislation does not recognize the significant environmental benefits of WTE, in terms of energy generation, environmental quality, and reduction of greenhouse gases.In the last few years, there have been significant advances in WTE technology that include the use of implementation of flue gas recirculation and the design of new plants that will use oxygen enrichment of the primary air. The importance of WTE in the universal effort for sustainable development and its need for R&D resources has led to the formation of the Waste-to-Energy Research and Technology Council. This organization brings together several universities concerned with waste management. The Council started operations by making an inventory of the global WTE industry and the research resources available. The overall goal of the Council is to improve the economic and environmental performance of technologies that can be used to recover materials and energy from solid wastes.
References
- European Union, Council Directive 1999/31/EC of 26 April 1999 on the landfill of waste, Official Journal of the European Communities, pp. L182/1-19 (July 1999).
- International Solid Wastes Association, Energy from Waste, State-of-the Art Report, www.wte.org.
- Bonomo, A., WTE Advances: The Experience of Brescia, Keynotepresentation at the 11th North American Waste-to-Energy Conference, Tampa FL (April 2003).
- Kiser, Jonathan V.L. and Maria Zannes, The 2002 IWSA Directory of Waste-to-Energy Plants, Integrated Waste Service Association, Washington DC (2002).
- Martin GmbH, www.martingmbh.de.
- Von Roll Inova Corp., www.vonrollinova.ch/english/index.html.
- Letter to M. Zannes of IWSA from EPA Assistant Administrators Marianne Horinko and Jeffrey Holmstead (14 February 2003).
- US EPA., Docket A-90-45,VIII. B.11 (Office of Air Quality Planning and Standards, 2002).
- Deriziotis, P., M. S. Thesis, Columbia University and N. J. Themelis, Substance and perceptions of environmental impacts of dioxin emissions, Proceedings of the 11th North American Waste-to-Energy Conference, ASME International, Tampa FL (April 2003).
- Themelis,N.J. and Gregory, A., Mercury Emissions from High Temperature Sources in Hudson Basin, Proceedings NAWTEC 10, Solid Wastes Processing Division, ASME International, pp. 205-215 (May 2002).
- Berenyi, E., Methane Recovery from Landfill Yearbook, 5th Edition, Governmental Advisory Associates, Westport, CT (1999).
- Themelis,N.J. and H.Y. Kim, Material and Energy Valances in a Large-scale Aerobic Bioconversion Cell, Waste Management and Research, 20:234-242 (2002).
- Franklin Associates, The role of recycling in integrated waste management in the US, Rep. EPA/530-R-96-001, USEPA, Munic. Industrial Waste Division, Washington, DC. 1995.
- Intergovernmental Panel on Climate Change, Climate Change 2001: The Scientific Basis p.244, Cambridge Press (2001).
- Graedel,T.E. and P.J. Crutzen, Atmospheric Change: An Earth System Perspective, W.H. Freeman Press New York (1993).
- S.A.Thorneloe, S. A., Weitz, K.A., Mishtala, S. R., Yarkosky, S., and Zannes, M., The Impact of Municipal Solid Waste Management on Greenhouse Gas Emissions in the United States, Vol. 52, pp. 1000-1011 (September 2002).
- Batchelor,D., Eeraerts, D., and Smits, P., Greenhouse gas abatement - assessing WTE and landfill disposal, Waste Management World, pp.43-47, September-October 2002.
- Ayalon,O.,Avnimelech,Y. and Shechtner, M., Alternative solid waste treatment options to reduce global greenhouse gases emissions - the Israeli example, Waste Management & Research, Vol. 18, no. 6, pp. 538-544 (2000).
- Tchobanoglous,G.,Theisen, H., and Vigil, S., Integrated Solid Waste Management, Chapter 4, McGraw-Hill, New York (1993).
| NICKOLAS
J. THEMELIS is Director of Earth Engineering Center, Columbia
University, New York City, New York, USA. Fax: +1 212 854 5213 e-mail: [email protected] web: www.columbia.edu/cu/earth webpage of the WTERT Council: www.columbia.edu/cu/wtert |