Private Networks in Japan and the Need to Secure Global Interconnectivity
By Koichiro Hayashi & Richard Nohe
Introduction
Private Networks in Japan have not been deployed to the extent that they have in the US. This is due to the dramatic difference between the two markets and business systems. Because information is not available regarding the number of Private Networks (PNs) in Japan, it is necessary to derive the PN market size by looking at two sources: 1) the ownership structure of the New Common Carriers (NCCs); and 2) the growth in the number of circuits leased from NTT.
Looking at such factors does not answer a fundamental question: Why has PN development in Japan lagged that of the US? Therefore, it is beneficial to examine the role played by the Japanese telecommunications infrastructure in the overall business envi ronment. Even though this role is similar to the role played by the telecommunications infrastructure in the US, the marketplace in Japan has more strict boundaries for industry segmentation.
NCCs' Role in Private Networking
To begin, large companies in Japan have not followed the lead of their counterparts in the US and gone out to build their own networks. Instead, they have remained "faithful" to the public infrastructure, which was built and operated by the government, until privatized in 1985. Because of this, the Japanese market did not experience the entrepreneurial spirit of NCCs until the mid-1980s. It was with the market entry of the NCCs that companies first started to move from NTT's network to others. Given th e ownership structure of the NCCs, it can be argued that they are, in some ways, large private networks. As these networks were built, NTT customers shifted their traffic from what had historically been the only game in town.
There are three kinds of carriers in Japan: Type 1 are licensed facilities-based carriers and operate under the most severe restrictions imposed by the MPT; Type 2 are non-facilities-based carriers and operate without a license. Type 2 carriers are sub categorized into Special Type 2 which lease facilities from Type 1 carriers and must obtain authorization from the MPT, 1 and General Type 2 which are only required to register with the MPT. Figure 1 show s how the market in Japan has developed around the Type 1 and Type 2 segments. 2
| Figure 1 | ||||||||
| 1985 | 1986 | 1987 | 1988 | 1989 | 1990 | 1991 | 1992 | |
| Type 1 | 2 | 7 | 13 | 37 | 45 | 62 | 68 | 68 |
| Type 2 (total) | 85 | 209 | 356 | 530 | 693 | 841 | 943 | 1036 |
| General | 85 | 200 | 346 | 512 | 668 | 813 | 912 | 1000 |
| Special | 0 | 9 | 10 | 18 | 25 | 28 | 31 | 36 |
| Total | 87 | 216 | 369 | 567 | 738 | 903 | 1011 | 1036 |
One of the clearest distinctions between the US and Japan has to do with the ownership structure of the telecommunications service providers. As mentioned above, the ownership structure of the NCC market lends credibility to the assertion that NCCs can be categorized as PNs. Indeed, US companies that made huge capital investments in their own telecommunications networks are now moving away from such practices and back to the public carriers' networks. This phenomenon can be partly explained by two deve lopments in technology fiber optics and intelligent networks. Fiber created excess capacity in the long distance market and intelligent networks 3 allowed the interexchange carriers to provide private ne twork functionality over their public network.
Figure 2 shows, among other things, that the ten main domestic Type 1 carriers are owned by over 800 companies. Of course these companies put at least some of their traffic onto these networks. It is more often the case that a company will participate in ventures such as this rather than build a PN strictly for their own use. Similarly, the international NCCs are primarily owned by sogo-shosha (trading companies). 4 On the other side of the Pacific, ow nership of US-based telecommunications service providers is widespread, but companies do not typically support a new carrier through making a capital investment and then putting traffic onto the network. While there are exceptions to this in the US, it is not the rule as it is in Japan.
| Figure 2 | ||||
| Company | Capital ¥100 mil. | Major Investors | ||
| Inter-city Carriers | ||||
| DDI Corp. | 108 | Kyocera: 25.1%; Sony: 5.0%; Ushio Inc.: 2.5%; SECOM: 2.5%; Mitsubishi Corp.: 2.5%; etc. Total: 225 companies |
||
| Japan Telecom Co., Ltd. | 243.79 | JR Eastern Japan: 19.6%; JR Western Japan: 15.1%; JR Tokai.: 11.2%; etc. Total: 302 |
||
| Teleway Japan Corp. | 249.0 | Toyota Motor Corp: 6.9%; Road Facility Assoc.: 6.9%; Mitsubishi Corp.: 3.1%; etc. Total: 289 |
||
| Regional Carriers | ||||
| Tokyo Telecommunications Network Co., Inc. | 300 | Tokyo Electric Power Co., Inc. Mitsui & Co., Ltd., Mitsubishi Corp. | ||
| Lakecity Cablevision Corp. | 3.535 | Gyosei, MIkkan Shashin Tsushin, Sankyo Seiki, Chonon Int'l | Osaka MediaPort Corp. | 120 | Osaka-shi, Kansai Electric Power Co., Inc. |
| Chubu Telecommunications Network Co., Inc. | 120 | Chubu Electric Power Co., Ltd. Mitsui & Co., Ltd., Mitsubishi Corp. | Shikoku Telecommunications Network Co., Inc. | 20 | Shikoku Electric Power Co., Inc. Mitsui & Co., Ltd., Mitsubishi Corp. |
| Kyushu Telecommunications Network Co., Inc. | 72 | Kyushu Electric Power Co., Inc. Mitsui & Co., Ltd., Mitsubishi Corp. | ||
| Hokkaido Telecommunications Network Co., Inc. | 300 | Hokkaido Electric Power Co., Inc. Mitsui & Co., Ltd., Mitsubishi Corp. | ||
| International Carriers | ||||
| International Telecom Japan | 200 | Mitsubishi Corp., Mitsui & Co., Ltd., Sumitomo Corp. | ||
| International Digital Communications, Inc. | 240 | C. Itoh & Co. Ltd., Cable & Wireless, Toyota Motor Corp. | ||
It has been suggested that major investors to NCCs are equipment suppliers, and it is the equipment suppliers that benefit most from the liberalization of the Japanese telecommunications market. 5 However, this is not necessarily true because it assumes that operating costs in the US and Japan are the same, or least more similar than they may actually be. If the costs were the same, then someone would benefit from the higher prices in Japan. But the co sts and cost structures are not the same. This cost differential is a basic issue that should be considered when making economic-based comparisons between the US and Japan.
NTT Leased Circuit Growth
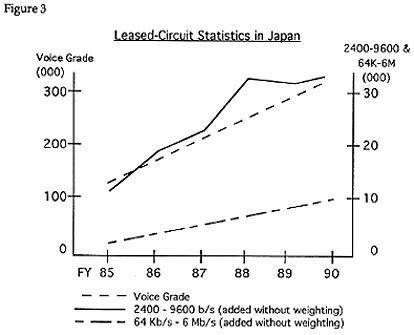
The second way to look at the size of the PN market in Japan is by focusing on the growth of leased circuits. Figure 3 shows that leased circuit usage is growing. 6
The reasons why this trend is taking place in Japan are not similar to the growth seen in leased circuits in the US in the 1980s.
This type of analysis gets to a fundamental question: What is a private network? If the PN can consist of leased circuits from the "public" carrier, then the impact of PNs on the public infrastructure will be less than a definition whereby PNs only inc lude separate physical networks. The response by the "public" carrier will be different in each of these situations. Historical background is necessary, in order to understand NTT's reaction to the growth of physically different PN (NCCs) and to leased-ci rcuit PNs.
Historical Perspective
Japan's telephone service began in 1890 with 237 subscribers in Tokyo and 48 in Yokohama. Since then, as the benefits of the telephone system were gradually recognized, the number of subscribers increased each year, reaching 1.5 telephones per 100 pers ons just before the second world war. However, the system was almost completely destroyed during the war, and postwar operations began with the reconstruction of the network. This discontinuity of telephone-density growth can be easily seen in Figure 4.
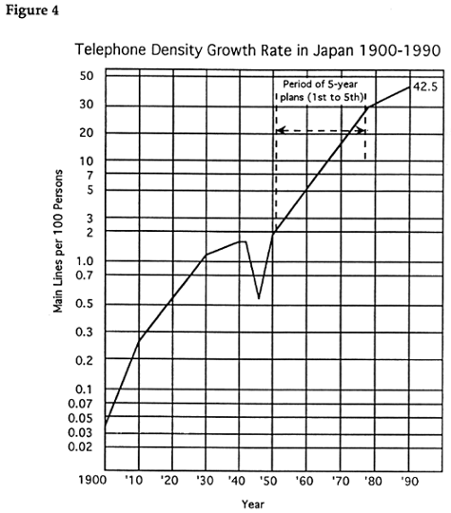
Since 1952, when telephone density had recovered to its pre-war level and when Nippon Telegraph and Telephone Public Corporation (NTT-PC ) 7 was established, five-year construction plans have been introduced and accomplished. This planning system rapidly incre ased telephone penetration, to about forty-four access lines per 100 population in 1991 a level similar to that in the world's other most advanced countries.
The organization responsible for providing telephone services was initially a government body, and its budget was part of the general account of the national budget. In 1950, only five years after the end of the World War II, the budget for telephone s ervices was transferred to a special account making it somewhat independent of the general account.
In 1952, as mentioned above, the operating body for telephone services was converted to a public corporation called NTT-PC, in order to achieve more flexibility of operations. At the same time, Kokusai Denshin Denwa 8 (KDD) was established to be t he sole provider of international services. NTT-PC contributed to the improvement of telephone services in Japan.
The 100 years of telephone evolution in Japan has been characterized by the unique phenomenon of "sekitai" (backlog) and the associated "subscriber's bond system." Because the telephone business was profitable from the start, as in Europe, the Japanese telephone profits were used to subsidize the general account of the government budget, including the postal service deficit. The telephone operating body thus suffered both from shortage of construction money and from excess demand (sekitai).
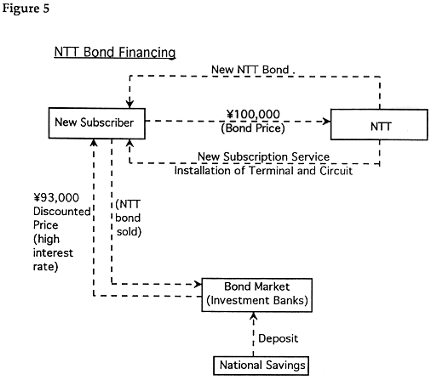
Therefore, it was natural that a kind of beneficiary-pay-system was invented as soon as the telephone system began. This system played an important role in financing construction. Even before World War II, the beneficiary payment was as much as 67% of the total construction budget. 9 By 1953, self-financing by the beneficiary-pay-system became more common with the introduction of the subscriber's bond system. This system contributed to NTT-PC's success in raising enough money to make substantial investments in the telecommunications infrastructure.
Each new subscriber was asked to purchase a subscriber bond that would be repaid after 10 years. The bond price was equal to roughly half the cost of installing a new subscriber line and telephone set, 10 and in this way NTT-PC was able to finance the cost of accepting the new subscription.
The subscriber had two alternatives keep the bond and wait for its repayment, or sell it on the bond market to investment banks. At that time, only a small portion of new subscribers kept the bond, despite the attractive repayment rate promised. Most bonds were instead sold to the market at a discounted price. This meant that a very attractive investment, subscriber's bonds, were offered at a low price, allowing for a high rate of return to the investment banks. Consequently, private savings and other domestic and foreign funds were mobilized to invest in telecommunications. The point is that, by selling the NTT bonds, a new subscriber could in effect obtain a new line at a low fee. This can be seen in Figure 5.
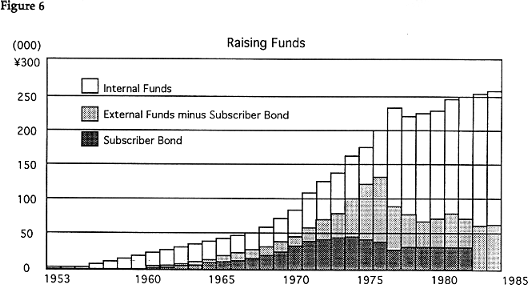
The role of subscriber's bonds becomes more clear in Figure 6, which shows the source of funds used for construction of the telephone network. It is remarkable that nearly half of the total funds come from internal sources, which consist mainly of depr eciation and profit. It is also apparent that subscriber bonds contributed very much to raising money until they were abandoned in 1983. Around 1965 subscriber bonds made up about a third of all construction funds.
Of course such financing plans were not available to anyone. In fact, only NTT-PC had access to such devices. While companies were permitted to build their own telecommunications networks and bypass the government-sponsored monopoly, they were not allo wed to interconnect until the liberalization of the market in 1985. Therefore, PNs were not an attractive option except to operations such as the government-owned railway system, or electric power companies, which did build its own network. This is simila r to the situation in countries which operated PTTs as government-owned monopolies, but it is in stark contrast to the development in the US.
Infrastructure Comparisons
Of the many infrastructures supporting advanced economies, telecommunications has emerged as the most important. Despite this, very little concrete research has been done to evaluate the impact of telecommunications on economies and societies, in a qua ntitative way. However, a study 11 has been done concerning the impact of telecommunications. It was headed by Professor Hajime Oniki of Osaka University who did research to prove the following hypothes is: 1) the capacities of various infrastructures can be calculated and compared on a common basis; and 2) if we are really heading towards the information society, the telecommunications infrastructure should have developed faster than others.
| Figure 7 | |||
| Growth Rates of Japanese Infrastructres (1965-1985) | |||
| Infrastructure | Total Capacity (annual growth rate) | Breakdown | |
| Telecom | 13.2 times (15.2%) | Subscriber lines Trunk lines | 7.3 41.6 |
| Airways | 9.1 times (11.7%) | ||
| Railways | 4.5 times (7.8%) | New bullet trains Traditional trains | 9.5 0.7 |
| Roads | 3.2 times (6.3%) | Expressways Other highways & roads | 5.8 4.1 |
| Electricity | 4.0 times (7.5%) | ||
| GNP | 3.3 times (6.5%) | ||
Capacity was calculated in the same basic way for all infrastructures over the 20 years between 1965 and 1985. For example, in the case of railways, the maximum possible number of passengers in one car was multiplied by the total number of cars availab le. This number, n, was multiplied by the number of kilometers covered by all trains in a day. The result was around 6 billion people km2/h in 1965 and around 27 billion people km2/h in 1985 respectively. Therefore, the growth rate during these 20 years was 4.5 times or 7.8% per annum on average.
Applying this formula to telecommunications, it was found that the capacity of Japan's telephone network increased by a factor of 13.2 in the same 20-year period. This is an average annual growth rate of 15.2%, the highest among the five measured infra structures.
NTT's performance in telecommunications infrastructure construction has surpassed that of any other infrastructures in Japan. Figure 7 shows the evidence in support of such an hypothesis. This implicitly indicates why private networking demand in Japan has been so weak.
It is also to be noted that all infrastructures studied in the Japanese market have exceeded or at least have kept pace with the GNP growth rate. Without this, the Japanese economy might not have achieved its astonishingly high growth after its recovery from the Second World War.
One more factor in the growth of an infrastructure is that capacity tends to increase when a significant new technology is introduced. The most visible case is that of the railways. The capacity of the Shinkansen bullet train increased 9.5 times betwee n 1965 and 1985, while that of conventional train lines decreased by 30%. Total railway capacity therefore grew about 4.5 times.
The effect of new technology is also clear in telecommunications. The 13.2-fold increase in capacity is mainly due to the impressive 41.6 times growth in trunk lines over the 20 year period.
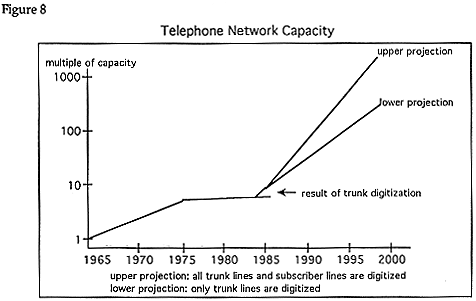
Time-serial development is shown in Figure 8. The vertical axis shows capacity on an exponential measure. It can be seen that capacity extended rapidly between 1965 and 1975. Just as capacity was maturing in the late '70s and '80s, the introduction of digital technology gave capacity another boost.
Professor Oniki's research team made a projection of trends to the year 2000, taking two scenarios. If both trunk lines and subscriber lines were digitized, total capacity would increase 140 times over the 1985 level. This is shown as the upper project ion. However, if only trunk lines were digitized, capacity would increase 40-fold, lower projection. These projections were made in 1986 - 87, when 1985 date was the latest available. By 1990, actual capacity already exceeded the upper projection on Figur e 8. Digitization in the late 1980s was faster and stronger than anyone expected.
The New Environment
Liberalization and privatization have already become world-wide trends. Especially in the developed countries, it may damage the whole national economy if this trend is not followed. This is because information technology has become the core of competi tiveness and the telecommunications infrastructure is the essential platform for using this technology.
It is sometimes overlooked, however, that the potential power of leading-edge companies underlines this tendency. The leading-edge large corporations are the ones most affected by the tariff structure of the telephone industry. In other words, they hav e the most advanced technologies and return the benefits of these technologies to their customers.
Because the telephone business in every country has long had a monopolistic nature, it is almost impossible to get public data for analyzing cost structures or customer distributions according to the usage of telephone calls. One exception to this is f ound in The Economics of Telecommunications by Dr. John T. Wenders. 12 It was found that only 10% of the high-usage customers contribute to 72% of total revenues from business customers in the St ate of Texas.
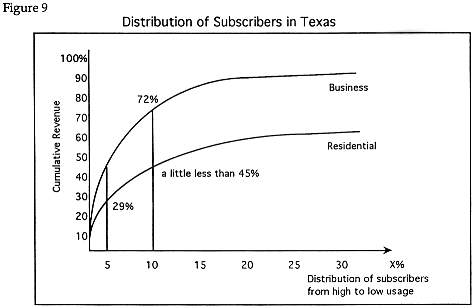
This implies that the high-usage customers are asked to pay more than the real cost under the universal tariff principle, where only one tariff is applied to every customer regardless of their level of usage. This situation is shown by Figure 10. 13 The telephone company earns much money from high-usage customers or routes and is able to compensate deficits due to low usage customers or routes. This is the essence of "universal services," and this ki nd of "cross-subsidization" has been traditional in the telephone industry. But it is now becoming a strong incentive for large customers to exit from the public telephone network. 14
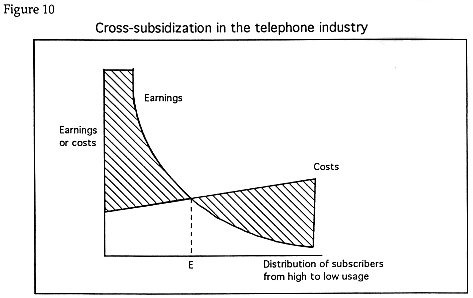
And from the standpoint of the common carriers, these larger corporations are their best customers because they pay more than the real costs. This enables the carrier to subsidize low-traffic customers and routes. The loss of these large customers is c atastrophic for the public network.
As was seen by Figure 2, above, many of NTT's largest customers have invested in and become customers of the NCCs. This has caused a revenue loss for NTT, especially in the most profitable long distance corridor. This is perhaps the most dramatic impac t on the modern NTT.
The possibility that large corporations will leave is undoubtedly a threat to the public network and is the real driving force toward liberalization and privatization of telecommunications. Negotiations regarding trade in services are one of the most h eated issues in the Uruguay Round of GATT. American Express is the most earnest promoter for trade in services, because of the great potential benefits it sees once the free flow of information is internationally secured.
Expansion of Common Carriers Activities
Globalization means that countries cannot afford to be isolated, and needs will grow to force a standardization of service menus and quality. The real driving force for such changes comes from Fortune 500 companies and other large users. They now prefe r to outsource the telecommunications network. 15 These users are seeking One Stop Shopping (OSS) because they don't want to have to be concerned with receiving bills in eighteen different languages and currencies.
OSS is one way in which common carriers can effectively serve their customers, by providing them with the convenience of a single contact point. The common carrier makes all necessary arrangements through cooperative agreements with friendly partners a round the world. Another service of proven convenience is Joint Account Management (JAM), an advanced structure to support global customers, in which common carriers play the role of network system integrators (NSI).
Despite the moves to a multi-carrier environment, the need will continue for alliances to establish, operate and maintain networks. Syncordia, 16 originally proposed by BT, is an example of how an al liance proposal can become much more. Originally conceived as a cooperative agreement between BT, NTT and DBT, Syncordia, after failing at that goal has become part of the BT/MCI venture.
But Syncordia differs from the OSS or JAM type of collaboration in three ways. Firstly, it leases private lines from common carriers at its own risk in order to anticipate the actual needs of specific customers. Secondly, its private lines are not simp ly raw cable, but a network management system (NMS). This may enable customers in the future to control their networks personally. Thirdly, even before the BT/MCI alliance, Syncordia had passed beyond the memorandum of understanding stage to become a phys ical entity, a joint venture which asks shareholders to take a certain amount of risk.
With the activities of large telecommunications customers becoming globalized, in due course, multinational common carriers will begin to appear. As this occurs, we will see more mergers and acquisitions similar to the BT/MCI deal. 17 Carriers are no w eager to look for beneficial alliances, regardless of the partner's nationality. Common carriers can move in one of two directions either extend basic services or enhance their range.
Scenario for Standardization
It may seem odd that common carriers are also seeking alliances regarding ISDN, because ISDN is fundamentally the most "basic" function of the network and interconnectivity is to be secured by global standardization. But in reality, standardization inc ludes certain amount of national options, and there are subtle differences of protocols between country A and B. Differences also occur in timing of implementation of specific terminals country by country. Thus, there will be alliances in relation to ISDN implementation. One unique fact to be noted here is that the US is fairly handicapped in this regard, probably because of the fragmentary nature of the network after the break-up of AT&T.
The choice for customers is expanding quickly, especially for high-volume users. This presents problems as well as opportunities, since network configuration inevitably becomes complicated in a multi-carrier environment. 18 It is beneficial to look at the players from the viewpoint of standardization. In the old regime, common carriers were solely responsible for end-to-end interconnection at any time and at any place. However, today they have alread
y lost their sovereignty.
Equipment vendors and service providers are now also responsible for the end-to-end connection, because info-communication networks are a mixture of telecommunications networks, terminal equipment and values added to this configuration. Without friendl
y cooperation and coordination among these three players, network connectivity could not be well maintained.
These are of course the main players on the stage. But there are other important players, who do not appear on the stage but prefer to stay behind-the-scenes. One of them is the users. Users have long been accustomed to taking it for granted that there
is no choice for terminals, for new services other than traditional voice telephony, or for carriers.
But as just mentioned, the situation has changed. Now users can enjoy freedom to choose equipment, service providers, and common carriers. They have acquired enough knowledge about network elements and the network itself. Their voices should not be neg
lected, but they are not yet formally involved in the process of discussing network-related issues. The United States runs a little bit ahead of other countries in terms of establishing users' organizations, and other countries have yet to succeed in this
area. However, this does not necessarily mean that user's requirements are well fulfilled in the US either. The cynical point of view sees that the more frustrated customers are, the stronger their voice becomes. Therefore, it is modest to say that it is
fairly difficult to represent users' voices without users' organizations.
Another player, also behind-the-scenes, is the government or regulators. Since the liberalization or privatization of telecommunications, regulatory functions and operational functions have been separated. In the old system, where common carriers used
to have two different faces, everything had been decided by cooperative works among them. Now as these coalitions have been broken down, regulators are expected to play a certain role in this arena. But the regulators' role should be limited to specific i
tems, since network issues should be decided mainly by market mechanisms. National security is one of the candidate items reserved for governmental intervention, and there are others.
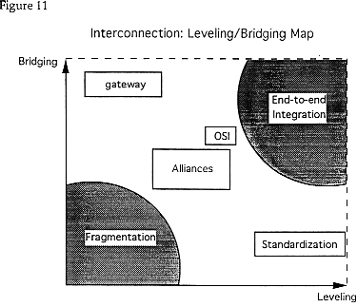
Four Means to Secure Interconnection
Figure 11 is the invention of
Dr. Bressand of Promethee, a Paris-based think-tank. Dr. Bressand introduced and used this matrix in order to analyze and show where various strategies or means are located from a political point of view. For example, he tried to show where EC signal mark
et or "mutual recognition" theory is located. But the methodology is also applicable here.
The horizontal axis of this chart indicates the degree of leveling. "Leveling" means how flat and fair, or non-discriminatory, the platform or the fundamental condition is. On the other axis, there is shown the degree of "bridging." "Bridging" takes th
e opposite method or direction of leveling, because it takes for granted that "leveling" is difficult or unnecessary. Instead, "bridging" makes an effort to set-up interconnection among many different systems as widely and deeply as possible.
Thus, various means for interconnection, including the way to insure network interconnection, are allocated in a proper position in this map. First of all, the most extreme cases: If the network concerned consists of several sub-networks, and they are
lacking the interconnection function, these networks are completely fragmented. Therefore, "fragmentation" is put on the bottom left. On the contrary, if the networks consist of a single carrier, and that carrier can ensure end-to-end connectivity, both "
leveling" and "bridging" functions are guaranteed. Therefore, "end-to-end" integration is put on the top right.
In today's interconnected society, any means will be put somewhere in-between these two extreme cases. Here, four examples can be seen standardization, gateway technologies, Open Systems Interconnection (OSI) and alliances.
Standardization is the traditional, popular method to ensure interconnectivity, and is very useful for insuring network security. This is a typical method focusing on "leveling." But judging from an economic point of view, standardization suffers from
several trade-offs: between prompt utilization of high technologies and economies of standards which require some time frame; between de facto standards and steady but complete standardization; between global standards and regional institution; between au
thorized, formal procedure and voluntary cooperation; between optional and strict standards, and so on.
A second solution is software conversion as one of the applications of gateway technologies. This is not necessarily standardization. Rather, it takes advantage of fragmented networks and finds business opportunities in setting up interconnection among
them. As the down-sizing in computers progresses, it becomes both technically easy and economically feasible to introduce gateways at certain points in networks. That is the main reason why VAS attracts so much attention, not only in the telecom business
but in every economic sector. But, regardless how easy it becomes, the introduction of gateways inevitably requires certain amounts of investment. Gateways are rationalized only when the investment costs are less than those of standardization or of any o
ther means.
The third way of securing interconnectivity is to set-up a framework in advance for making software compatible. This is a kind of mixture of software conversion, as a gateway technology, and standardization focusing on software. The most famous and suc
cessful effort in this direction is OSI. Many software products are now being made under the scheme of the seven-layer OSI reference model. In this context, OSI is coming very close to the ideal of securing interconnectivity. In theory, it is closely loca
ted to the old regime of end-to-end integrity. But there are also problems.
If OSI has such strength, it must be a very complicated and "heavy" software, not user-friendly and not easy to handle. On the contrary if OSI is only a basic concept and not so "heavy," it cannot contribute to implementing real software products compa
tible with each other. At any rate, OSI is not an absolute solution to secure interconnectivity.
Alliances among different methods go in the center of Figure 11. This is the forth way for interconnection. As the activities of large customers have been globalized, various kinds of alliances have been introduced. OSS (One Stop Shopping) provision un
der the collaborative agreements between the leading common carriers was the first step. It has now been enhanced to GAM or JAM agreements and even more formal equity investments.
However, alliances may have two completely different faces. If a certain alliance is open to other members and flexible to invite them to join, it may become a public good and succeed in establishing universality, which may function just like standardi
zation. But on the contrary, if a certain alliance is closed and reluctant to accept other members, it may remain a sub-network failing to set-up interconnectivity in a broader context.
Judging from the principles of corporate behavior, the latter case is more likely to happen. Alliances tend to be a method for differentiation rather than universality. Therefore, alliances alone cannot solve the interconnectivity problems.
Conclusion
With privatization taking place globally, all networks are actually PNs. Computer technology is allowing carriers to make more efficient use of their networks by keeping their customers away from leased-circuit solutions. But this is taking place mainl
y in the US right now. There are still dramatic differences even between the US and Japan two of
the most developed countries in terms of infrastructure.
The impact of PNs on the public infrastructure in Japan, and other countries, depends on what a PN is considered to be. Such a definition is very difficult to develop and will vary from country to country. An example of this is seen in the US/Japan com
parisons made above. These two countries are similar in many ways, but political, economic, and financial differences are magnified when examined through the scope of the telecommunications infrastructures.
In the future, no single carrier will dominate the converging field of telecommunications and computing. And no single measure can assure world-wide interconnectivity between the variety of public and private networks. The sovereignty of the common car
rier, which has lasted about 100 years, is now approaching the end. In its place is a new regime made up of subtle mixture of common carriage and contract carriage which may be the best solution for large customers. However, it is to be noted that simply
combining multiple private networks does not necessarily assure interoperability or interconnectivity among private networks. The public network will always have its own advantages and features.
Note 1: Large-scale and international Value Added Networks fall into this category. Back.
Note 2: Information & Communications in Japan 1992, InfoCom Research, May 1993. Back.
Note 3: Intelligent networks were first deployed on a large scale by Sprint with its Virtual Private Network (VPN) service offering; MCI and AT&T followed with Vnet and Software Defined Network (SDN) respectively. SDN bec
ame the platform for AT&T's Tariff 12 discount plan. Back.
Note 4: It can be argued that ITJ was established as a private network for the trading companies that own it. Mitsubishi, Mitsui, Sumitomo, and Matsushita each has a 9% ownership stake in ITJ. However, the same argument is mo
re difficult to make about IDC. In March of 1984, Great Britain called upon Japan to allow foreign investment in competitors to KDD and threatened to impose sanctions if Japan refused. Ultimately, C&W was allowed to invest in IDC, but what lead to thi
s had more to do with politics than business. Back.
Note 5: Noll, Roger G. and Frances M. Rosenbluth, "Telecommunications Policy in Japan and the U.S.: Structure, Process, Outcomes" Center for Economic Policy Research Publ. No. 349, Stanford University, May 1993. Back.
Note 6: NTT statistical data. Back.
Note 7: This is not to be confused either with the current NTT Corp. or with a subsidiary, NTT PC Communications. Back.
Note 8: Kokusai Denshin Denwa literally means international telegraph and telephone. Back.
Note 9: see footnote 10 below for a fuller explanation. Back.
Note 10: At the time, the central office-to-end cost for installing telephones was 350,000. However, 50,000 was charged directly to each subscriber as an installation cost, leaving 300,000 to be financed. This amount was
divided by 2 so that each bond was valued at 150,000, and NTT would pay the other 150,000. Depending on the interest rate fluctuation and depreciation schedule, the bond system covered up to 67% of the total construction budget, as mentioned above. Back.
Note 11: Koichiro Hayashi participated in this study. Back.
Note 12: Wenders, John T. and Bruce L. Egan "The Implications of Economic Efficiency for U.S. Telecommunications Policy" Telecommunications Policy, March 1986. Back.
Note 13: Hayashi, Koichiro The Economics of Networking, NTT Publishing, 1989 (in Japanese). Back.
Note 14: Noam, Eli "A Theory for the Instability of Public Telecommunications Systems," in Cristiano Antonelli, ed. The Economics of Information Networks, Noth Holland Press 1992. Back.
Note 15: This trend can be compared to the market segmentation structure in Japan, where companies prefer to stay in their own segment, see above. Back.
Note 16: Syncordia is apparently now to become part of the BT/MCI alliance and be managed by MCI out of Atlanta. Back.
Note 17: AT&T's WorldSource partnership alliance is an example of this trend. So far, AT&T, KDD and Singapore Telecom have announced a venture to provide customers with OSS. There have also been talks of expanding th
e Franco-German Eunetcom alliance or even making part of WorldSource. Back.
Note 18: This is even more of an issue when there are multiple PNs instead of multiple PTT-type configurations. Back.