The User-Driven Network:
The present extent of private networking in the United States
by Milton Mueller
One of the most far-reaching consequences of deregulating telecommunications equipment and services is that businesses can build and operate their own communication systems. Private networking can be viewed as both a cause and a consequence of telecomm unications liberalization. The existence of large users with their own distinct communications needs and information equipment put pressure on regulators to open up the telecommunications marketplace. The subsequent liberalization of ownership and interco nnection arrangements in turn made it easier for companies to develop their own networks. This has resulted in a tremendous shift in the network's center of gravity, from the center to the periphery. Initiative and innovation now are more likely to come f rom the end user, and more specifically from the capabilities of privately-owned customer premises equipment, than from the operators of public networks.
How far has private networking gone in the United States? There is little quantitative information about this, because private networks by definition are created by unregulated entities exempt from the reporting requirements which allow us to track the investment and usage of common carrier networks. Worse yet, the categories used to count investment reflect a separation between the worlds of telecommunications and computers that may have existed decades ago, but it no longer valid. This paper draws on a variety of data sources to provide some rough proportional estimates of the present extent of private networking in the United States.
Macroeconomic data suggest that something important is happening, although it is unable to define just what it is. Robert Crandall (1991) discovered a divergence between the total consumption of telecommunications equipment in the U.S. and the investme nt of the common carriers. Using aggregate statistics from the Commerce Department, the Census Bureau, the FCC, and the United States Telephone Association, he found a 162% increase in overall consumption of telecommunications equipment SIC 3661, 36631, b ut only a 64% increase in the common carriers' capital expenditures. Crandall locates a large part of the growth in equipment in the specific category "Nonbroadcast Communication Equipment" (SIC 36631), which includes fiber optic equipment, satellite equi pment, and point-to-point radio. He also discovered a large surge in central office switching equipment and carrier line equipment. He concludes that "rapid growth in the sale of this equipment indicates a growing importance of newer technologies in build ing private and common carriage systems."
This conclusion, while suggestive, does not move us any closer to a quantification of private networking's impact, because the data do not distinguish between new networks which are carriers of other people's traffic and truly private networks. Some of the growth is accounted for by new interexchange carriers, information service providers, and other entities that represent new service providers rather than user-driven privatization. Crandall's data could simply be a measure of the growth in supply cre ated by a more diverse and competitive environment. A deeper problem is that "telecommunications equipment" is probably the wrong place to look for the growth of private networking. As we shall see, the area in which private users are taking the greatest initiative is in new applications of computer and information processing technologies to the management of their organizational communications. Such investments probably show up in entirely different categories.
1.0 Some Definitions and Distinctions.
The phenomenon of private networking must be understood within the framework of the theory of the firm. This theory posits two distinct methods for a company to acquire what it needs for its operations. One is to purchase it from an outside producer, v ia a market transaction. The other is to produce it itself. The structure of the firm and of the industry is determined by the extent to which "markets" or "hierarchies" turn out to be the most efficient choice. The relevance to our topic should be obviou s. When we ask why firms engage in private networking as opposed to relying on common carriers, we are asking why they choose to rely on internal hierarchies rather than market transactions with outside suppliers to supply their communication needs. The c rux of the public/private distinction is that in private networks, a firm produces its own network services by combining intermediate inputs into a final product (a telecommunications network service). Although it may order facilities, services, and equip ment from outside suppliers, the real responsibility for assembling and operating the network is internalized.
The theory of the firm outlines several reasons why firms might rely on themselves instead of a market transaction to supply a needed service. None of them appear to fit the case of networks very well, however. The aspect of the theory that comes close st to our needs is that of asset-specificity, wherein the network can be viewed as a highly specialized product customized to the needs of a specific user. The theory's explanation of why firms exert direct control over custom-made inputs focuses on verti cal integration as a way of avoiding opportunistic behavior on the part of a supplier. In the case of telecommunications networks, however, protection against opportunism does not appear to be the main consideration; rather, it is a combination of cost sa vings and the telephone company's inability to offer sufficiently customized or advanced products. Most telephone companies have proven to be unwilling or unable to create optimal combinations of intermediate inputs suited to the specific needs of firms; or if they do, they costs are higher than if the firm does it for itself. Many firms have discovered that they can reap substantial economic and strategic benefits by taking over network ownership or management, or both.
Stigler's (1951) and Williamson's (1975) theory of the life cycle of the firm posits a general trend toward vertical disintegration as an industry grows. Does internalization of network management represent more integration or more disintegration? Ther e is an apparent paradox here. The vertical disintegration of the end-to-end service of the traditional public network is accompanied by a growing number of firms integrating forward into the assembly and management of networks. Management-internalization thus could be seen as a reversion to a less specialized market structure, because functions that once were hired out are now being supplied internally. At the same time, privatization goes hand-in hand with the disintegration of the telecommunications sy stem into its piece-parts, and the growth of pluralism and specialization in the component markets. If multiple firms can make decisions regarding intermediate network inputs independently, then multiple suppliers, competition, technological variation, an d specialization in the intermediate market will be supported. The privatization of management feeds upon and reinforces the breakup of the end-to-end network into its component parts, and encourages proliferation of the suppliers of those component parts . Hence, in the long run use-privatization leads to much greater specialization in telecommunications services and facilities even though it internalizes or integrates the network management function.
Once "internalization of network management" is accepted as the distinction between public and private networks there is no reason to assume a priori that the network "private sector" will continue to grow at the expense of the "public sector" indefini tely. Internalization may be simply a temporary response to the uncertainties of deploying new technology, or to the inadequacies of the POTS-based telephone companies and the pricing distortions of regulated monopoly. Network management functions that ar e now internalized may migrate back to third-party providers as the telecommunications industry becomes more competitive, flexible, integrated, and experienced in the ways of telematics. CitiBank doesn't want to be one of the world's biggest telecommunica tions companies; it has to be because no existing third-party firm has the geographic scope or expertise needed to handle its special communications needs any better than it handles them itself. Most private networks have emerged to meet new or extremely specialized communications needs. On the other hand, it is also possible that fundamental changes in technology and economics will result in the permanent privatization of many network capabilities. Hence the issue of quantification becomes important. How often does private networking occur, and in which direction is the trend?
2.0 Two Types of Private Networking.
In the course of attempting to quantify private networking I found it necessary to introduce a distinction between two very different kinds of private networks. Let us call them "Type A" private networks and "Type B" private networks. The distinction t urns on whether the network is confined to the user's own premises (Type A), or is distributed across multiple sites (Type B). With Type A private networks, the user organization takes control of network management and equipment selection on its own premises, but relies primarily on the public system for communication links to outside points (including remote office sites of the same organization). With a Type B private network, the privatization of network management is extended to multiple sites via privately owned or dedicated transmission facilities.
Type A private networks are user-driven facilities for intrapremises telecommunication. They are owned, managed and maintained by the user or leased from a third party contractor, but not from the telephone company. LANs and PBXs are the fundamental ex amples of Type A private networks, but the category also can include larger networks formed by fiber, copper, or radio linkages connecting buildings on a corporate or university campus. The transmission facilities of Type A networks, however, do not cross public rights of way; they are limited in scope to the user's contiguous territory. They may either be closed, stand-alone networks (like a typical LAN), or have an outlet to the public switched network (like a typical PBX). If they are interconnected, h owever, traffic to other sites must be delivered over the public network for it to qualify as a Type A private network.
Type B private networks use either owned or dedicated transmission facilities to connect customer-owned telecommunication or information processing facilities on more than one office site. In a Type B private network, the transmission facilities need not be owned by the user, but the end-to-end communications paths must be dedicated exclusively to the user. An example is a closed, intracorporate voice network that uses IXC leased lines to connect privately owned PBXs in geographically dispersed office sites. Another example would be a data network using VSAT technology to connect data terminals owned by a company in multiple office sites. The primary difference between Type B and Type A private networks is that the Type B user's networking respo nsibilities extend beyond its own building or office complex. Generally speaking (and recognizing that the boundaries can be porous) Type B networks are not accessible via the public network. Of course, it is possible for a single organization to have bot h Type A and Type B private networks. For example, a company with a nationwide Type B data network might also own separate LANs and PBXs.
Software Defined Networks do not count as Type B private networks, or as private networks at all, for two reasons: first, they involve shared use of a public carrier's switched transmission facilities; second, the management of the traffic flow is hand led primarily by the carrier, not the user.
One can nit-pick at this distinction, particularly when large users employ complex mixtures of public, Type A, and Type B facilities. But the distinction is real and important nevertheless. As we shall see, it corresponds to two distinct categories of network privatization, categories with quantifiably distinct characteristics and trends. Type A and Type B private networks are appropriate for very different classes of users, have different effects upon the public network, and reveal different trends. O n the whole, the picture of network privatization that we get from making the distinction is far clearer than the one we get when we ignore it.
With this framework in mind, I set out to quantify the extent of private networking in the United States. This was done with no funding support, so the methods are crude and the estimates are very rough. Nevertheless, the results are clear enough to en able some basic conclusions to be drawn.
3.0 Quantifying Type B private networking.
When "private networks" are discussed in the course of CITI conferences, most people appear to have Type B private networks in mind. They are thinking of large, geographically distributed, closed user networks, exemplified by SITA or the FTS 2000 netwo rk. Sometimes we are left with the implication that these large private networks threaten to outstrip the public system in size, resources, or technological leverage. But there is surprisingly little quantitative information about such private networks. H ow many are there? How do they compare in size to the common carrier networks? Are they growing or shrinking in number?
Consulting organizations and industry associations have conducted surveys of large corporate telecommunications users, but they are not very useful from this standpoint. ICA 1990 Survey Generally, these surveys are not constructed to facilitate a compa rison between the size of the private networks vis a vis the public network. They simply monitor the behavior and attitudes of corporate networkers. They rarely introduce a distinction between public and private facilities, so that the information they derive applies as much to large corporate users' consumption of public network service as it does to their management of private networks.
The paper's approach to quantification is based on the study of a microcosm. Because counting and measuring the number of Type B private networks in the U.S. was simply impossible given the time and resources available to the author, we limited our stu dy to the state of Nebraska. Nebraska is a small state, but it has a sophisticated telecommunications sector and a closely-knit community of telecommunications managers. This made it possible for us to identify all of the actual or potential Type B privat e networks in the state, and to directly administer a survey to them. The rationale behind this approach is simple. Through reports to the public utility commission we know the size of the public switched network in the state along various dimensions: pla nt, route miles, stations, etc. If we can identify most or all of the Type B networks in the state and acquire comparable information about them, we can derive an empirical estimate of the proportions of public and private networking that is valid in at l east one geographic area. One can have any opinion one likes about the generalizability of this evidence, but this much is certain: one case is one more than we have now.
Even in this limited context there are still significant gaps in the data. Our survey required busy telecommunication managers to give us a raft of details about their capital expenditures, operating budgets, future plans, number of terminals and sites , etc. Many were cooperative, but some simply refused. Some of those who cooperated were unable to answer some of our questions.
There were 232 establishments in Nebraska with 250 or more employees in 1989 US BOC--County Business Patterns, p. 3. Of that number, we estimate that approximately 25, or eleven percent, managed Type B private telecommunication networks.

We were able to obtain survey information from 16 of them.
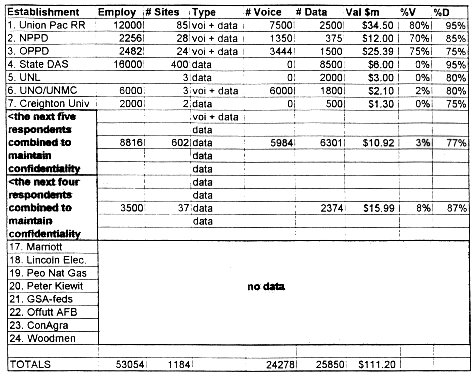
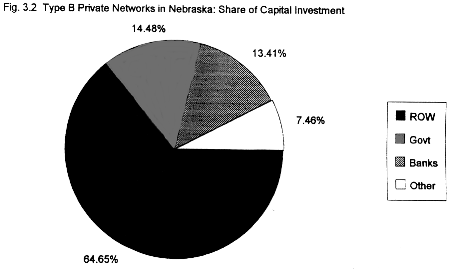
The largest of these networks, in terms of the value of the capital equipment they owned, were associated with a class of business known as "right of way" companies: railroads, power utilities, and pipelines. These companies were much more likely to ow n rather than lease transmission capacity. They accounted for 65% of the book value of equipment, and 88% of the fiber and microwave route miles.
The second largest category was government. This included the state department of communication, a branch of the Division of Administrative Services (DAS), and the University of Nebraska system, which includes two campuses in Lincoln, the University of Nebraska Omaha, the University of Nebraska Medical Center, and the Peter Kiewit Conference Center. We did not attempt to count the state Educational Television Network (ETV) because of its status as a broadcast network. Unfortunately, we were unable to o btain information about the federal government network or the network at the Offutt Air Force Base. Federal government offices in the state utilize the FTS 2000 private network, but the GSA was unable to give us any useful information about its size in Ne braska. Each federal agency orders capacity from it independently, making information gathering most difficult. The military of course was concerned with the security implications.
Financial service companies and banks were the third category. Many had private data networks, but they were smaller and more dependent on leased facilities from public carriers. One bank, however, had just installed a private radio system to replace l eased lines as the basis of its ATM network. See Figure 3-2 for a chart of the relative proportions of each sector.
The Type B networks which answered our survey linked 24,278 voice terminals and 25,850 data terminals in the state. By way of comparison, the state's local exchange carriers serve a total of 887,988 access lines, 215,966 of which were business access l ines, in 1991. The 24,278 voice terminals served by Type B nets represents 2.73% of all access lines and 11.24% of all business access lines in the state. Of course, there is no way to know exactly how many data terminals are linked via the public network , so a comparison on that dimension cannot be made.
Five of the 16 responding Type B networks had voice capabilities, while the remainder were primarily data networks. The last two columns in Table 3-1 represents the network manager's estimate of how much of the organization's voice (%V) and data (%D) t raffic is carried by the private network. Private voice networks typically serve intraorganizational voice communication only and thus carry a lower percentage of the traffic generated by the organization than data networks. For example, the University of Nebraska Omaha's Type B network consists of a privately owned fiber cable linking the UNO campus with the Medical Center and a downtown conference center. While the network carries an estimated 80% of the data generated by the organization, only 2% of it s voice traffic is confined to that network.
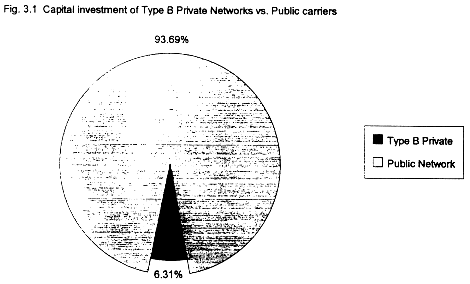
The combined book value of the surveyed Type B networks was equal to approximately $111.2 million. This is 6.31% of the Total Plant in Service of the state's local exchange and interexchange carriers (Figure 1). This number might go up to all of 8% if the missing networks were included. Although of course there is no way to be sure of the size of the missing data points, we are sure that we do have information for the largest networks. Type B networks which rely on leased lines for transmission simply are not very capital-intensive relative to the public network, even if, as is the case with the state government, a large number of terminals are served.
We asked the network managers a series of questions about private vs. public networking.
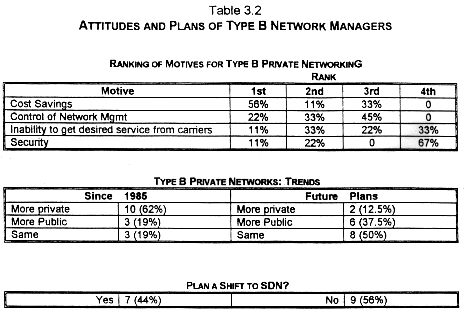
Four motives for private networking were presented to the respondents and they were asked to rank order them. Cost savings was ranked first most frequently; "Security" was ranked last the most often (by two-thirds of the respondents). Control of networ k management was important, but not overwhelmingly so; two respondents ranked it first and three ranked it second in importance. The aggregation of the responses conceals very different attitudes among managers, however.
When asked to indicate "how [their] company's reliance on its Type B private network has changed since 1985," almost two thirds answered that they thought they had moved toward "more reliance on [their] private network." When asked about future trends, however, half (50%) said they expected things to remain at the same level. Of the remainder, 37.5% thought they would rely more on public networks and 12.5% thought they would rely more on private networks. Those who expected to rely more on private net works were also those with the largest investments in privately owned transmission facilities.
We also asked respondents whether they planned to shift some of their voice or data traffic which is now on a Type B private network to a Software Defined Network in the future. A significant number planned to do so: 44% said "Yes" and 56% answered "No ." The Yes's tended to be the Type B networkers who relied more on leased rather than owned facilities. Our Nebraska survey discovered that 7 of 40 businesses (17.5%) with 100 or more employees were using SDN for voice and/or data communication. Many of t hese companies were large users who otherwise would have been prime candidates for Type B private networks: United Parcel, Vickers (a large manufacturing firm), ConAgra, as well as the state government. Coincidentally, perhaps, information derived from th e AT&T Network Operations Center in Bedminster, New Jersey indicates that SDN traffic accounts for 17% of the calls on AT&T's switched interexchange network.
The story of the state government's network strategy is a good illustration of the motives underlying the trend towards SDN. In 1985-86, the state used its own network constructed of FX and WATS lines for voice and data communication. This saved money but created heavy managerial burdens. According to state communications director Bill Miller, the staff was responsible for tracking down service outages, and spent one and a half weeks each month running algorithms to optimize the cost efficiency of its facilities. An impetus for change was created when AT&T announced that it was withdrawing its Telpak tariff in 1986. The withdrawal of Telpak would have raised the state's costs by 100%. In 1987 the state temporarily outsourced its voice services to L intel Long Distance. Then in 1989 it signed a five year contract with AT&T for a software defined network. The SDN gives them dedicated links to seven locations in the state, and uses shared facilities to all other points. Under the SDN contract, the state Communications Division re-markets long distance service to city governments, high schools, and other state agencies. (The withdrawal of the Telpak tariff also prompted the state's Educational Television network to shift from microwave to satellite facilities.)
How representative is this experience? In this case there is some national data to draw upon: The National Association of State Telecommunications Directors' 1991 Membership Survey. The survey contains some information about private networking by state s, although unfortunately its definitions and data categories are not compatible with the framework of this study.
According to the NASTD survey, many state telecommunication directors are facing budget restrictions and heavy pressures to cut costs. Twenty-six (26) of thirty-five (35) responding states reported using "private networks under bulk tariffs" as a "step their organization has taken to control expenditures in the last two years." This was second only to "increased cost monitoring" as the most frequently cited cost-controlling measure. Unfortunately, "private networks under bulk tariffs" was not defined b y the survey, and it is clear that the term was interpreted by many states in a way which includes software defined networks. Nebraska, for example, is listed as one of the states which has shifted toward "private" networking when in fact it has mo ved in the opposite direction. An establishment which is migrating to SDN from a privately managed network based on leased lines, is moving away from user-driven privatization toward greater facilities sharing and fewer management responsibilities.
The NASTD survey contains some interesting information about ownership patterns.
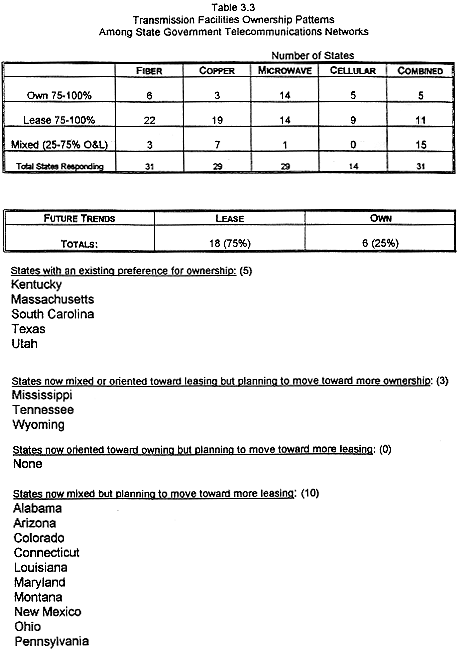
It is clear that states are using a complex mixture of owned and leased facilities, but some patterns emerge. Copper and fiber facilities are more likely to be leased than owned. (22 states lease 75-100% of their fiber capacity, and only six states own 100% of their fiber networks.) The pattern for microwave networks, on the other hand, is more balanced. Fourteen states own 75% or more of their microwave facilities, while 14 states lease 75-100% of them. Copper facilities are also more often leased tha n owned; 19 states lease 90% or more of their facilities, three states own 75% or more, and seven states mix owned and leased facilities near a 50-50 balance. If the ownership-leasing patterns for each of the four media are combined, we find only five sta tes with an across-the board preference for ownership, less than half of the number of states (11) which consistently lease. 15 states maintain a mixture.
The predominant future direction seems to be toward leasing rather than ownership. However, as was the case with the Nebraska Type B networks, systems which have already made a commitment to ownership are more likely to continue that trend. Eighteen of thirty responding states said that they would move toward leasing rather than owning in the future. Six said they would move toward ownership. Six said they would maintain a mix of owned and leased facilities. Many states cited the budget constraints of the past few years as the reasons for favoring leasing over ownership.
In conclusion, an analysis of Type B private networking reveals the following measurements and trends. Large, distributed private networks are rare; only 11% of the larger businesses and only 1.4% of all establishments with fifty or more employees have them. Within the category of Type B networks, there are two distinct types: those based on owned transmission facilities and those based on leased transmission facilities. Type B networks based on leasing are not totally disappearing, but in the voice wo rld there is a distinct trend toward outsourcing management responsibilities and achieving sharing economies via SDNs. In the past, cost savings available via leased lines prompted large users to assume network management responsibilities; today, cost con siderations are driving them away from Type B private networks. Most ownership-based private networks, on the other hand, plan to intensify their usage of their private facilities and continue down the path of ownership. The primary economic impediment to ownership-based Type B networks is not just the investment in communications equipment itself, but access to rights of way. That is why right of way companies have the most extensive private networks and also why most growth in such private networks is l ikely to occur via applications of radio, or applications of fiber with minimal right of way issues, such as intra-campus or point-to-point links between two office sites.
Type B private networking began primarily as a response to the pricing distortions of regulation, particularly the underpricing of dedicated lines that occurred with AT&T's first predatory responses to competition in that market in the 1970s. Altho ugh there are other, less directly cost-related reasons for Type B private networking, those motivations affect a relatively small and specialized portion of the business world.
4.0 Type A Private Networks.
The real growth in private networking is occurring on a much smaller scale. The growth of workplace PCs, distributed computing, and voice processing technology is increasingly turning the office into the site of an internal private network. In order to avail themselves of the full range of computer products and services, business managers are constructing intraorganizational networks and assuming responsibility for network management functions. By the same token, the product and software markets are ev olving in ways that make it progressively easier and less costly for businesses to assume this function.
Type A private networking is a product of the deregulation and detariffing of customer premises equipment in the 1970s. It represents a permanent and cumulative revolution in the relationship between users and the public network. For decades, the telep hone companies' control of access and transport gave them leverage over the type of terminal equipment that could be used in the home and the office. Now the tables are turned; CPE deregulation and privatization lead to enormous diversity and specializati on in equipment and processes at the customer end. Consequently, end user equipment increasingly drives the kind of access and transport services offered by the public network.
In order to quantify Type A private networking, we drew on nationwide data regarding LAN and PBX markets and on our own survey of 40 Nebraska businesses.
4.1 LANS
Local Area Networks are proliferating at an extraordinary pace. In Nebraska in 1991, 78% of all establishments with more than 100 employees had installed one or more LANs. Since 1986, the number of installations has grown by 800%, and the number more t han doubled in the last two years alone.
The growth of LANs is propelled by the increasingly universal adoption of personal computers as an essential facility for many desk jobs.
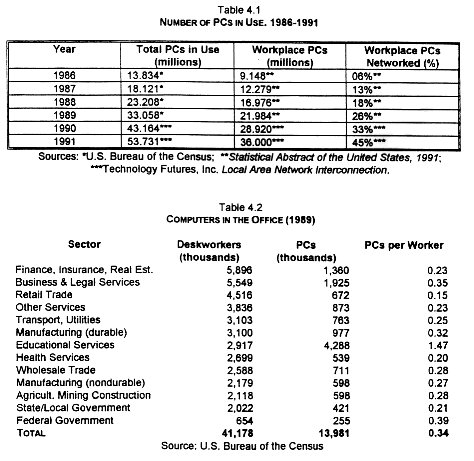
Table 4.1 shows the steady growth in the number of PCs in use.
Table 4.2 lists the number of desk jobs in various sectors and the degree of PC penetration. Whereas in 1984 there was one PC in the office for every 18 desk workers, in 1989 there was one for every three workers. By 1996, one estimate says there will be 9 computers in the office for every 10 deskworkers. TF, Inc., p. 41
Following closely behind the spread of PCs has been a growth in networked or distributed computing. Bellcore estimated that the number of LANs grew from 20,000 in 1983 to 800,000 in 1988. Dataquest estimates show that from 1989 to 1993 there will be a 24% CAGR in unit sales and a 39.5% CAGR in installed base. A conservative estimate of the number of LANs in 1991 would be 2.5 million. cite TF Inc., p. 23-24 In Nebraska, however, we found a growth rate for LANs that greatly exceeded the national estimate s.
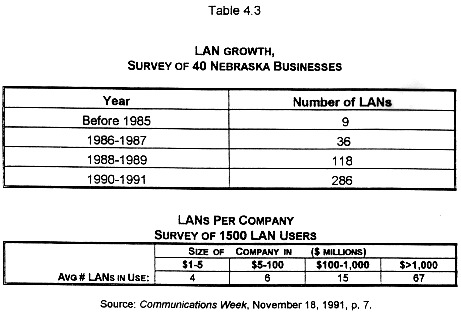
The significance of this growth goes well beyond the diffusion of specific technologies. It is part of a profound change in the balance of public and private networking. A LAN is unambiguously a private network. The user owns the server and wiring, mai ntains the network, and makes all the choices about software, features, topology, media, and access. The technology and software associated with PCs and LANS has put private networking within the reach of all but the smallest businesses. The increasingly universal adoption of PCs and LANs indicates the complete privatization of intrapremise data networking.
Telecommunication common carriers are responding to the growth of LANs by targeting the LAN interconnect market. High speed data communication standards such as frame relay, MDS, FDDI, and ATM are working their way to the market. A new offering by Tele port known as LANLINK is a particularly telling example of a public carrier's response to the growth of Type A private networking in data communication. LANLINK improves the speed and efficiency of LAN-LAN connections over the customary leased DS1 service s, and also provides bridging functionality, sparing LAN users the need to invest in equipment. (Bridges typically represent an investment of $4,000 - $20,000.) If LANLINK can be taken as typical of how public carriers will respond to LANs, it supports th e thesis of this paper in two ways. First, the common carriers are conceding the intrapremise LAN market to private users; the carriers are only going after the interconnect market, which is currently served by leased lines; i.e., by Type B arrangements. Second, the telephone companies--even innovative ones like Teleport--are behind the curve. They are trying to catch up to a market which was created by Type A private networking, rather than creating a new market themselves. Teleport's natio nwide deployment of a LAN interconnect service will not be available until the first quarter of 1993, at the earliest. Developments in the public network are thus lagging behind developments in Type A private networking by four or five years. This gives u sers enough time to establish a substantial installed base.
4.2 PBXs
A PBX is a Type A private network for voice rather than data services. Voice networking went through the cycle of privatization and response by public carriers a decade earlier than the data communications market, so the results may be a harbinger of w hat is to come in the LAN market. In the early and mid-1980s, the features available via PBXs generally exceeded what was available from the telephone companies. PBX manufacturers beat the public carriers in bringing digital capabilities to the market, an d often offered cost savings as well. PBXs thus grew rapidly during the latter half of the 1970s. Growth has since leveled off as the telephone companies have developed a competitive response in Centrex and the market has been saturated.
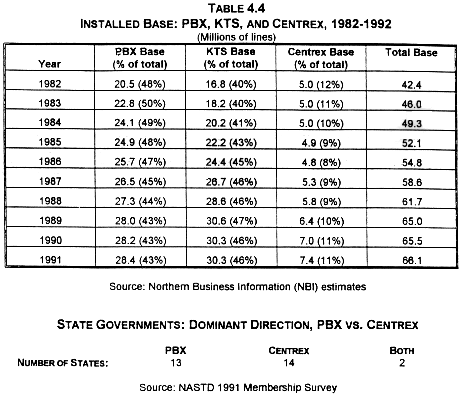
Table 4.4 shows the number of lines served by PBX, Key systems (KTS) and Centrex from 1982 to 1991. While the private share of voice business lines is no longer growing, there is no substantial reversal of the privatization of voice networking, either. Rather, the market has stabilized at a level in which PBXs and Key systems have captured a substantial share (43-45%) of multiline business telecommunications. Since 1985, Centrex's share of business lines relative to PBXs and KTS has grown by only 1.7%. If the comparison is extended to 1982, Centrex's share has barely changed. The biggest increase in relative share of business lines has been in Key systems (KTS), which grew from 40% in 1982 to 46% in 1991. As a piece of telephone equipment which is usua lly purchased by the user, Key systems represent small Type A facilities.
The thesis that private CPE is holding on to a stable share of business lines was supported by both the Nebraska survey and the NASTD survey of state governments.
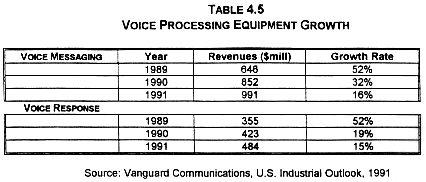
Table 4.5 shows that of 29 states responding, 13 said that PBX would be the dominant direction in the future, 14 said that Centrex would be the dominant direction, and two states said that they would be expected to play an equal role.
4.3 Voice Processing and Computer-Telephone Integration.
While growth rates for PBXs and Key systems are flat, other developments indicate that Type A private networking will continue to play a major role in the voice arena, and may even expand dramatically. Features such as voice messaging, call accounting systems, and automatic call distribution systems (ACD) further blur the line between voice and data, and give managers important new functions which are critical to the way office communications take place. Voice messaging and Voice Response sales grew by 15 and 16% in 1991, respectively, despite a recession which slowed the growth in PBX, KTS and Centrex lines to less than 1 percent. (See Table 4.5) The introduction of wireless data communications and wireless PBXs should stimulate a new round of private ly-developed CPE purchases as managers search for new on-premise networking solutions. Here again, advanced wireless features will be available to users via CPE purchases using unlicensed frequencies long before public carriers bring PCS or similar servic es to the market.
Computer-Telephone Integration (CTI) has been defined as the functional integration of human agents and telephone network capabilities, voice and data switching, office computing, and voice processing. The long term future of Type A private networking will be determined by who takes the initiative in implementing the integration of office voice and data capabilities. If it is the telephone companies, then Type A private networking will decline. If, as seems much more likely, this transition will take p lace via the mediation of equipment vendors (both switch manufacturers and computer manufacturers), software providers, and system integrators, then Type A private networking will take over voice and data functions as quickly as LANs are currently taking over intrapremise computer networking.
Type A networking will probably always remain privatized for the following reasons. Studies of information distribution within organizations consistently show that about 90% of the non-voice information generated by an organization stays within the con fines of a single building or cluster of buildings. Half of the information generated by a work unit stays within that unit; another 25% is shared with peer departments; e.g., in a division. Another 15% goes to higher levels of management within the build ing or complex. Altogether, only 10% goes outside, to remote corporate headquarters, customers, suppliers, or government agencies. Source: Business Guide to Local Area Networks, 1991, p.15
The concentration of information flow within the premises of the organization makes it more likely that the managers of the organization will exert direct control over the configuration and technology of intrapremise networks. They will view internal c ommunications not as a homogeneous service like voice telephony to be consumed from an outside supplier, but as a heterogeneous set of functions which they must specify and configure to suit the specific purposes of the organization. Configuring internal information flows is as much a part of the management task as establishing the physical layout of an assembly line or the arrangement of offices in the building.
5. "Highways" or "Plumbing:" Some Concluding Comments.
My object has been to define the phenomenon of network privatization more precisely by assembling quantitative information about two distinct types of private networking. As we have seen, the large scale, distributed private network is a significant ph enomenon, but is confined to about ten percent of the largest businesses. All indications are that the proportion of businesses which develop Type B private networks will remain stable or decline. There are many defections owing to the growth of SDNs, but also some additions due to applications of radio technology.
If our concept of private networking is focused more narrowly on what businesses are doing within their own premises, however, we find that the country's data communications are in the process of being taken over completely by users for themselv es. In voice communication, the business line market appears to have stabilized at a level of about one third privatized. The analysis above suggested that intrapremise or Type A private networking will continue to ratchet upwards, as managers exert direc t control over the configuration of their office communications systems. A lot depends on how far the integration of voice and data goes and how it is handled by equipment manufacturers. Public carriers are responding to these markets, but their service o fferings tend to lag behind by several years and to stop at the building door. They are positioned to connect different Type A facilities, but not to reverse the privatization of intraoffice systems.
We need a metaphor or model for this new relationship between public and private networks. Many speak in grand terms of network "confederations" and "electronic highways." I propose a humbler but more accurate analogy. The appropriate model is not high ways but plumbing. In plumbing systems there is a large-scale public infrastructure for general distribution, but the domain of these public utilities basically stops at the building premises. Once inside the building, the owner controls the equipm ent choices and configuration. It's up to the user how many showers, toilets and sinks there will be, whether the pipes will be PVC, copper, or galvanized, how well they are insulated. If the pipe leaks, the owner has to contract for the repairs. So it wi ll be with the network of the future. I see users taking almost complete control of the character of the network within buildings and office complexes, with public carriers being forced to provide an increasingly heterogeneous set of services in order to be capable of linking up these diversely equipped sites. Public networks retain powerful--indeed, insurmountable--advantages outside the premises due to the high transactions costs and other entry barriers associated with the use of public rights of way, and because of the significant economies of scale in shared transmission.
I like the plumbing metaphor because it is less pretentious than the highway metaphor and a lot more realistic. Anyone who has struggled with a printer that can't be accessed because of protocol conflicts or wiring problems between devices on a LAN kno ws that the process has a lot more in common with a clogged toilet than the Tennessee Valley Authority. The common mistake is to view the process of transformation from the perspective of the telephone companies and their competitors. In reality, the end users, and particularly their ability to purchase telecommunications equipment uniquely configured to suit their needs, are the real drivers of change.