|
|
|
|
|
|
|
|
|
|
|
|
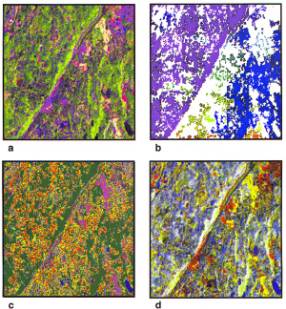
Figure 1. Landsat
Thematic Mapper (TM) satellite data for a
|
|
6x6-km
area in Westchester County, New York. Shown are
|
|
the
raw data (a), as well as products (e.g., maps) derived from
|
|
the
data (b-d) that might be used for modeling Lyme disease
|
|
transmission
risk. a) Raw Landsat TM image composed of
|
|
bands
5, 4, and 3 (mid-infrared, near-infrared, and red bands).
|
|
Vegetation
is shown in shades of green, with bare soil and
|
|
urban
areas shown in shades of pink and purple. The spatial
|
|
resolution
of these data is 30x30 m. b) Map showing
|
|
contiguous
forest patches, derived from a Landsat TM
|
|
classification.
Colors represent discrete patches, with white
|
|
indicating
the absence of contiguous forest. c) A 12-class land
|
cover
map derived from the Landsat TM data. d) Composite
|
|
image
of three spectral indices derived from the Landsat TM
|
|
data,
showing the contributions of scene brightness in red,
|
|
greenness in
green, and wetness in blue.
|
|