Figure 2.2.1
Introduction to Earth Sciences I
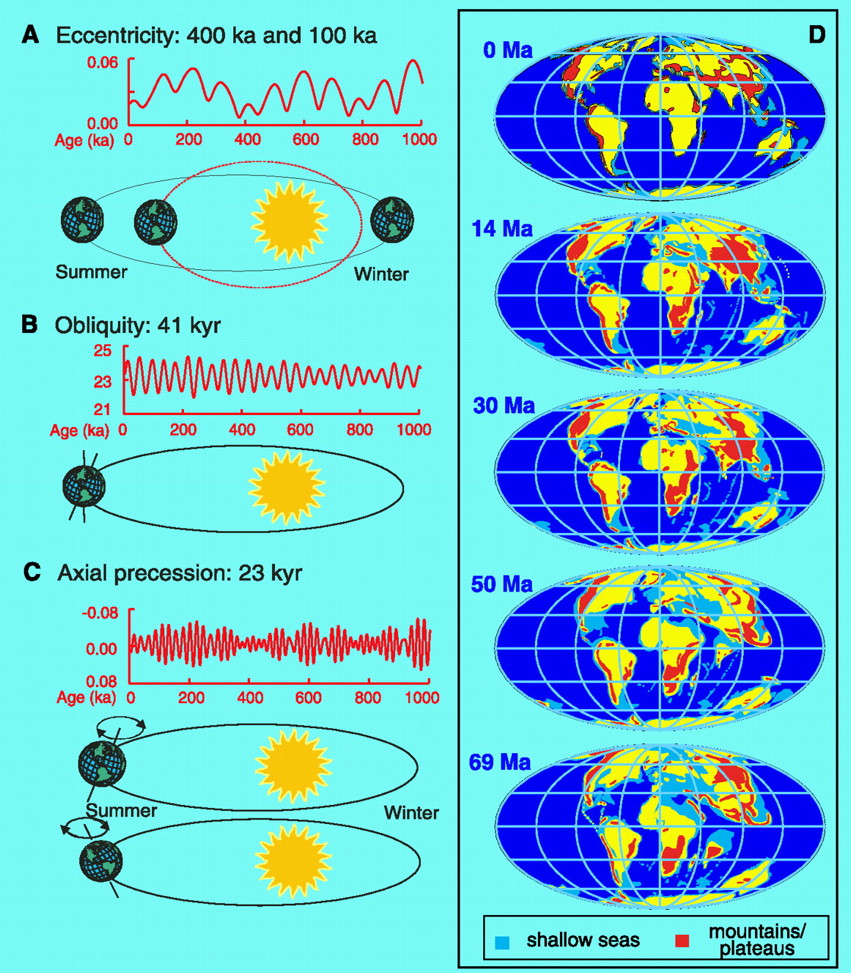
2.2 Climate changes and the Earth's motion in space
These periodic changes give a significant component to the fluctuations of the Earth's long-term climate. The change from glacial to interglacial climates in the Earth's past largely follow these cycles. The figure below shows the amount of change expected (these can be calculated) based on each of the three motions. How do we know these changes actually took place?
Figure 2.2.1
Temperature in the past can be deduced from the fossil record, tree rings, growth rings in corals and the chemistry of sediments deposited in the deep oceans among other "proxies".
An excellent summary of the many proxies that can be used to estimates past temperatures of the Earth can be found atIn the figure below, the vertical graph below shows changes in past
relative temperature inferred from the abundances of microfossils found in the sediments
of cores taken from the deep oceans. Modern counterparts of these organisms (tiny
animals called foraminifera and dinoflagelates) that float near the ocean surface
during their lives are known to change their form depending on water temperature.
The graph shows the relative abundance of cool and warm water favoring assemblages.
This is not a direct measure of temperature
but gives an idea of how water temperature has changed in the past, at least at the
location of the core sample. The horizontal graph is temperature derived from the much
more accurate method of oxygen isotopes in deep sea sediments. We know with quite a
bit of accuracy that the ratio of oxygen isotopes is sensitive to temperature and hence
if we can measure this ratio in sediments from the seafloor and beneath (the older layers
being deeper beneath the seafloor) we can establish a measure of past temperature. This
is one of the best and most commonly used means of deriving past temperatures. Remember
what is being derived is the temperature of the seawater in the microorganisms lived
thousands of years ago, so it is closely related to the Earths climate.
Particularly in the record derived from oxygen isotopes, the eye can pick out
variations on 100, 40, and 20 thousand year periods. The 100,000 year "signal" appears
to be the strongest. You can think of it like the Earth having three channels and the
100,000 channel is coming in the strongest.
Figure 2.2.2
The horizontally oriented chart in particular shows the dominance of the 100 thousand year changes. By this we mean that the amplitude of the inferred temperature swings are greater at 100 thousand year periods than at other periods, You can see that the 20 thousand year variations seem to ride on the 100 thousand year variations at and have only about 1/3 the amplitude at most. We say that there is more power in the 100 thousand year periods. An analysis of proxy temperature records from further back in the past shows that the dominance of the 100 thousand year period has only been with us for the last million years. From 3 to 1 million years ago the 40 thousand year period was dominant and prior to that the 20 thousand year period dominated. What's more the change from one dominant period to the other was very abrupt. The changes from one dominant period to another is one of the great mysteries of climate science today, especially the fact that these changes happen so rapidly.
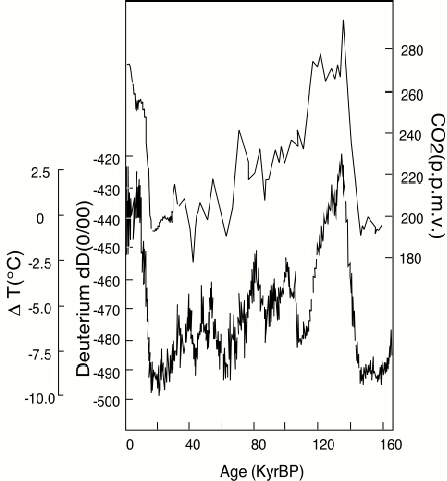
Figure 2.2.3
One of the most accurate proxies are the layers seen in ice
caps in Greenland and Antarctica. This technique is like the way in which
sediments are recovered from the seafloor but instead we drill into the ice
sheet with a hollow drill. What comes up the center of the drill is a log
cylinder of compacted snow. Snow falls in annual patterns so there is an annual
layering that can be seen in the cores. The figure below shows a person in an
ice cave with a wall of ice behind. See how the wall is patterned with light
and dark horizontal layers. The light and dark alternations represent the
annual bands of snow accumulation. But see how they are not regular - sometimes
there is a dominance of dark banding and sometimes light bands dominate. In one
instance the climate has been more winter like, and the other more summer like.
The great asset ice cores have is that these annual bands can be recovered in ice
cores going back to 400,000 years ago - the longest record with annual resolution
possible.
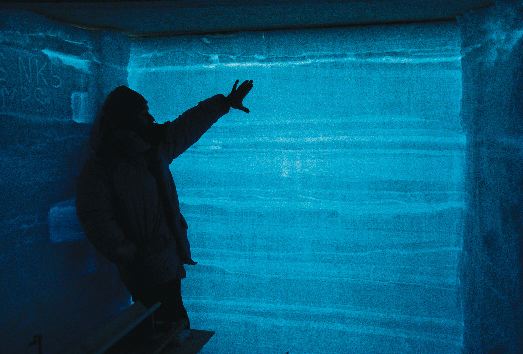
Figure 2.2.4
What's more the ice crystals trap tiny bubbles of the air through
which the ancient snow fell. The air can be analyzed for its chemical composition,
in particular the concentration of carbon dioxide, along with the temperature
from oxygen isotopes and a 400,000 year record of the relationship between these
two and their variations emerges.
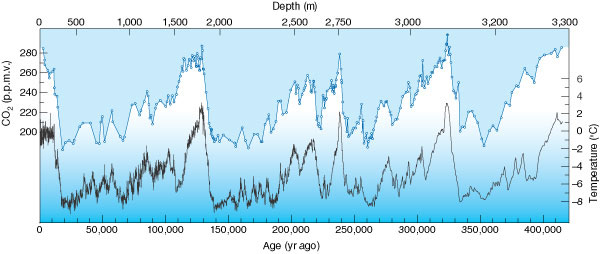
Figure 2.2.5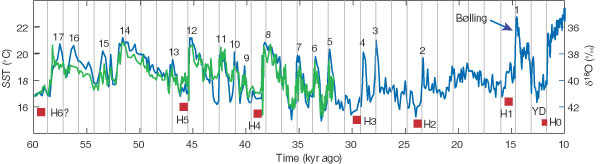
Figure 2.2.6
Another aspect of these records is that there are very abrupt transitions
to very different climate states. At around 130,000 years and again at around
20,000 years the temperatures rocket up from cold to warm conditions. These
changes, again looked at in great detail, are actually found to take place
over a time period of less than a hundred years. In other words, the Earth's
climate appears to be capable of switching from cold to warm state in a
period comparable to that of a human life span. This is a startling and
unexpected new discovery. Such rapid changes cannot be caused by orbital
motion changes in any simple way that we know right now.
The other feature one sees on these curves is a high degree of correlation between top curve showing carbon dioxide content and the lower one showing temperature. Both are taken from the same ice core data and show that through natural variation (not human induced) temperature and carbon dioxide levels go hand in hand. The correlation alone does not imply causality - we cannot say from this that carbon dioxide changes cause temperature changes, but it is clear that the two are closely and naturally related. This is one of the key pieces of evidence used to suggest that if human activity were to increase carbon dioxide levels (as it has in post-industrial times) then global temperatures are likely to increase also.