Introduction to Earth Sciences I
Topic 2
Motion of the Earth in Space
What we have learnt about in the first Topic are large-scale (macro) properties of the Earth. They are also mostly "static" properties - that is, properties that pertain to descriptions of the Earth, even if it were not moving in space, and even if it were internally dead. In fact, the Earth experiences a variety of complex motions in space and is internally very much alive. These are the subjects of our next Topics.
Two aspects of the Earth's motion in space are well known. First, the Earth rotates on its axis once every 24 hours. In fact, the rotation rate is not exactly 24 hours, and varies by a small amount on a daily basis; a matter of a few milliseconds. Additionally, it is slowing down due to tidal friction (see Tides later) so that the length of a day has actually increased over the history of the Earth. Second, the Earth rotates around the Sun once a year. In fact, that is what is meant by a year.
Video resource: seasons video (QuickTime Video ~10MB) | seasons video (Streamed Real Media)
2.1 Tilt, Wobble & Stretch
The Earth experiences three dominant periodic motions of much longer periods that are not readily perceptible. Each of these give insight into the interior structure of the Earth or has a direct effect on the Earth's climate.
2.1.1. Axial Precession
The rotational axis of the Earth is tilted with respect to the normal to the plane of the ecliptic, presently at an angle of about 23.5°. That is, it doesn't stand up straight but leans over a bit. Because of the oblate shape of the Earth and the tilt, the Sun exerts a gravitational pull that differs in force at the two poles. The effect is to attempt to set the Earth up straight - i.e., to try to right the axis to be normal to the ecliptic. This would be a least energy configuration. In fact, the "righting force" has the effect of causing the rotational axis to execute a circular, wobbling motion, like a spinning top.
 |
Video resource: Axial
precession video 1 (QuickTime 3MB) | Axial precession
video 1 (Streamed Real Media)
Video resource: Axial
precession video 2 (QuickTime ~9MB) | Axial precession
video 2 (Streamed Real Media)
To understand the motion imagine a rod through the Earth's axis of rotation. Hold the rod at its middle point (the center of the Earth) and make one end move around in a circle. That's what the precession describes. The motion goes through a complete circle in a period of about 26,000 years. Why 26,000 years? This period is governed by the magnitude of the gravitational field and the tilt angle (23.5°), but also the "dynamic elipticity", H.
The dynamic elipticity is the ratio of the Earth's "moments of inertia". The concept of moment of inertia is related to the more familiar concept of inertia.
Inertia - tendency of a body to stay at rest, or retain its current motion.
Moment of Inertia - tendency of a force to cause a body to rotate, or the tendency of a body to remain rotating once rotating.
Moment of Inertia must always be defined about an axis.
The Earth can be considered to have two moments of inertia - one defined about the polar axis (C); the other about an axis drawn through the equatorial plane (A).
The ratio ![]() is called the
dynamic elipticity, and controls the rate of motion of the rotational axis
in space. Remember that the ratio of axial lengths describing the Earth's
shape is its elipticity and could be thought of as its static elipticity.
is called the
dynamic elipticity, and controls the rate of motion of the rotational axis
in space. Remember that the ratio of axial lengths describing the Earth's
shape is its elipticity and could be thought of as its static elipticity.
Considering the problem in an inverse way, if we knew the rate of motion we should be able to calculate the dynamic elipticity, H. The rate of motion is known from the "precession of the equinoxes" - the fact that over history different constellations have been visible overhead at different times in the past. At the Spring Equinox, Pices is directly overhead at the equator, while it has been recorded that in 120 B.C. Aires was overhead at the Spring Equinox. The 26,000 year period can be estimated that way although more accurate present day calculations give a better figure.
Using 26,000 years we can deduce that
![]()
and that
![]()
where M is the mass of the Earth, and a is the equatorial
radius. What does this tell us? We can also calculate moments of inertia
for various bodies.
![]()
Because![]() for the Earth, it is somewhere between a point and a
solid. Hence it is likely that its density increases toward the center.
for the Earth, it is somewhere between a point and a
solid. Hence it is likely that its density increases toward the center.
If we suppose that the Earth has two basic components - half being a dense core and the other half a less dense outer shell - we can also calculate moments for these bodies.
|
Moment of Inertia | |
2 |
0.367 |
|
3 |
0.339 |
<------- Closer to observed |
4 |
0.338 |
|
If ![]() , a figure appropriate for the outer shell, then
, a figure appropriate for the outer shell, then ![]() -
a fairly good estimate of average density of the Earth's core.
-
a fairly good estimate of average density of the Earth's core.
So, as in the topics we dealt with learning about the Earth's macroscopic (but static) properties we have
Observation |
Theory |
Deduced Property |
26,000 year precession |
Rotational dynamics |
Internal density distribution |
2.1.2 Changes in Tilt
While the inclination of the Earth's rotational axis is presently 23.5° it has moved a little in the past. Like the precession of the equinoxes that reflects the circular motion of the rotational axis, the tilt changes periodically also - from about 24.5° to 21.5° over a period of about 40,000 years. So as the rotational axis wobbles, it also tilts back and forth. This motion provides no insight into the Earth's internal properties but it turns out to be very important as an influence on the Earth's climatic changes.
2.1.3 Changes in the Earth's Orbit
The Earth revolves around the Sun at a full revolution rate of 365 days. The shape of the orbit is eliptical with the Sun at one focus. This orbital state too is not static. The elipticity of the orbit changes, also in a periodic way, with this period being the longest - at around 100,000 years. The elipticity changes from 0.01 to 0.007; i.e., by 6%, quite a large amount.
In summary, these three motions can be thought of as a 100,000 year stretch of the orbital elipse, a 40,000 year tilt of the rotational axis, together with a 26,000 year wobble of the rotational axis. Wobble and stretch are actually coupled - if one changes the other is also forced to change along with it.
2.2 Climate changes and the earth's motion in space
These periodic changes give a significant component to the fluctuations of the Earth's long-term climate. The change from glacial to interglacial climates in the Earth's past largely follow these cycles. Temperature in the past can be deduced from the fossil record, tree rings, growth rings in corals and the chemistry of sediments deposited in the deep oceans among other proxies.
An excellent summary of the many "proxies" that can be used to estimates past tempertures of the Earth can be found atThe vertical graph below shows changes in past temperature inferred from the abundances of fossils that represent cool water and warm water favoring assemblages. The horizontal graph is temperature derived from oxygen isotopes in sediments. Particularly in this one, the eye can pick out variations on 100, 40, and 20 thousand year periods.
The horizontally oriented chart in particular shows the dominance of the 100 thousand year changes. By this we mean that the amplitude of the inferred temperature swings are greater at 100 thousand year periods than at other periods, You can see that the 20 thousand year variations seem to ride on the 100 thousand year variations at and have only about 1/3 the amplitude at most. We say that there is more power in the 100 thousand year periods. An analysis of proxy temperature records from further back in the past shows that the dominace of the 100 thousand year period has only been with us for that last million years. From 3 to 1 million years ago the 40 thousand year period was dominant and prior to that the 20 thousad year period dominated. What's more the change from one dominant period to the other was very abrupt. The changes from one dominant period to another is one of the great misteries of climate science today, especially the fact that these changes happen so rapidly.
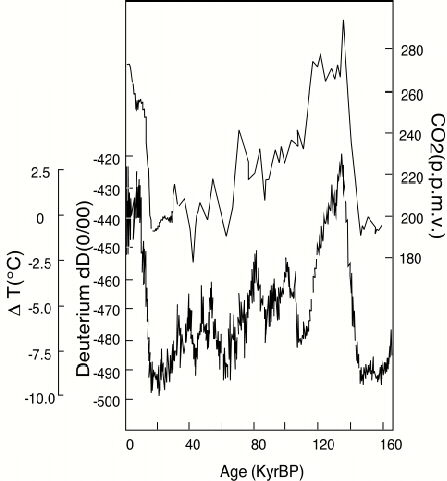
The last chart shown above is one of the most revealing record of past climate that has come available in the last decade. It shows the history of temperatare variations and carbon dioxide variations for the past 160,000 years as recorded in an ice core taken from the summit of the Greenland ice dome. The record is very high resolution because the ise records annual bands associated with changing precipitation during the year much as trees have annual growth rings. Several things can be quickly seen. One is that, for most of the last 160,000 years the temperature has been quite a bit colder than it is today - the zero on the temperature scale is today's temperature, the readiings show differences from today's temperature. The last time the Earth's temperature was similar to today's is more than 100,000 years ago. Our society seems to have come about in a fairly unusual cliamtic setting. A second thing is that there is a very large amoint of temperature fluctuation at high frequency during the cold periods. These fluctuations if viewed in detail have periods of a couple of thousand years. Clearly they are well short of the periods assocaited with the tilt, wobble and stretch of planetary. Their origin is unknown. A third aspect of this record is that there are very abrupt transitions to very different climate states. At around 130,000 years and again at around 20,000 years the temperatures rocket up from cold to warm conditions. These changes, again looked at in great detail, are actually found to take place over a time period of less than a hundred years. In other words, the Earth's climate appears to be capable of switching from cold to warm state in a period comparable to that of a human life span. This is a startling and unexpected new discovery. Such rapid changes cannot be caused by orbital motion changes in any simple way that we know right now.
The other feature one sees on these curves is a high degree of correlation between top curve showing carbon dioxide content and the lower one showing temperature. Both are taken from the ice core data and show that through natural variation (not human induced) temperature and carbon dioxide levels go hand in hand. This is one of the key pieces of evidence used to suggest that if hunam activity were to increase carbon dioxide levels (as it has in post-industrial times) then global temperatures are likely to increase also.
2.3 Another regular motion - Chandler Wobble
In addition to the three large scale motions we have discussed, the Earth experiences a nodding (or nutation) called Chandler Wobble. This results because the Earth is not rotating about its axis of figure, or axis of maximum moment of inertia. The point on the Earth's surface where the rotational axis intersects, revolves around the axis of figure in yet another periodic motion, although, as can be seen from the attached map, it has a random component overprinting a regular rotation.

The period of the nodding can be deduced and it should be no surprise that it too is related to differences in the Earth's moments of inertia C-A. If the Earth were a purely rigid solid the Chandler period would be 305 days, but the observed period is over 400 (430).
The slower period is due to the fact that the Earth actually yields a little to gravitational torques because it is not a purely rigid solid.
Causes of the exciting and damping of Chandler wobble have been debated for many yields. Damping may be due to motion in the fluid core, but the reason the motion does not eventually evolve toward a rotational axis coinciding with the axis of figure is not known. Something always excites the motion by kicking the rotational axis away from the axis of symmetry.

A more detailed description of the Chandler Wobble and its history
can be found at
http://www.michaelmandeville.com/earthmonitor/polarmotion/plots/chandler_wobble_plots.htm.
2.4 Are the motions regular or chaotic?
Part of the answer to this question is that they are very regular. When we say that the tilt, wobble and stretch of the orbital motions have periods of 20, 40 and 100 thousand years that is usually taken to mean that these are regular periods. And in fact that are regular, but only approximately. There is a spread in period around 20 thousand (say) and it is not possible to predict exactly what the period will be. The variation is quite small so for most purposes in analyzing the past record the periods can be taken to be very nearly regular.
This is not the case for the tilt variations of Mars, however. Mars has a much greater range of tilt variations from around 11 degrees to 38 degrees. And there is no well defined period. the motion of Mars' tilt axis is an unpredictable wobbling around. It always lies between 11 degrees and 38 degrees but within that range it is very difficult to predict what the titlt will be at any time. Most ofthe planets have somewhat chaotic tilt variations. It is believed that the Earth may also have had a chaotic tilt variability in the past but that the presence of the Moon has acted to gravitationally stabilize the tilt by "holding it steady".
A quick look at the Chandler Wobble path leads to the conclusion suggests a somewhat unpredictable behavior. Again, like most such systems the variation has bounds -- the rotation pole and the axis of figure never get beyond a certain distance apart and the period at which one circles the other is always about 430 days, but never exactly predictable.
All of the motions then have some degree of unpredictability associated with them. Mars' tilt is highly unpredicitable, Earth's precession for instance is really quite predictable. In asking the question -- are the motions chaotic -- the answer varies with the planet and the particular motion involved.
2.5 Length of Day Variations.
While it might seem fairly incredible the length of the day is changing all the time -- not by an amount that anyone would notice, but by amoints that are easy to detect instrumentally. The changes are only a few milliseconds (a millisecond is one thousandth of a second) but they are very easy to measure. The record below shows that there are very regular variations and also very irregular variations. All of the changes must in some way be caused by the re-distribution of mass over the surface and with in the Earth. Seasonal changes (curve d) are caused by the change in ice volume and relative amounts of water in the atmosphere from summer to winter. Longer period changes and shorter period changes (curves c and e respectively) are more difficult to explain. Some are caused by the phase of the El Nino -- the Earth rotates differently in an El Nino year than in a La Nina year because these phenomena change the distribution of wet and dry parts of the world. Even longer period changes must be caused by processes in the deep Earth that move masses around such as subduction of large slabs of lithosphere. The cause of many of the longer period signals is not well understood.
2.6 Marine Tides
Every one who has been to the beach or spent any time near a shore line knows something about the behavior of tides. They appear to the beachgoer as the advance and retreat of the high water line. In fact, we all know that what is happening is that the water level is rising and falling throughout the day. Tides are a very predictable feature of the Earth and result from the interactions of the Earth, Moon and Sun, together with the rotation of the Earth and Moon.
The basic features of tides are well known:
These basic features can be explained by the "equilibrium" theory of tides.
Tides are caused by the gravitational attraction of the Moon and Sun. The Moon's effect is about 54% of the total - gravitational force is proportional to the masses of the interacting bodies, but inversely proportional to the square of the distance separating the bodies so, although the Sun outweighs the Moon by a factor of 10 million the fact that it is almost 400 times further away than the Moon gives the Moon the gravitational edge.
Water is very weak and will respond to gravitational attraction or "pull" by trying to move in the direction of the force. So the water covering the Earth distorts by making a bulge toward the Moon.
As the Earth rotates, points on the surface move in and out, under the bulge, and hence experience high and low tides. But there's a problem with this model of tides; it can't account for there being two high and two low tides each day. It can only explain one high and one low as the Earth rotates beneath the one bulge. Our simple model is incomplete because it doesn't take account of the rotation of the Earth/Moon system. We generally think of the Moon rotating around the Earth on a monthly basis while, in fact, the Earth and Moon rotate around each other. The gravitational attraction acts to "connect" the two bodies and they rotate in unison. If they were of equal mass they would rotate about their mid-point like a baton thrown in the air by a majorette. Because the Earth's mass is much greater than the Moon's the point about which Earth and Moon rotate together (CM) is near the Earth's surface.
The animation that is available at
http://plabpc.csustan.edu/general/tutorials/PlanetaryMotion/PlanetaryMotion.htm
shows you how the motion of two bodies rotating around each other is affected
by the relative sizes of the masses. You can use the sliders to change the masses.
You will see how making the masses more nearly equal causes the center of rotation
to be somewhere about half-way between the bodies, while if one mass is much
greater than the other the center of mass, and hence the rotation point is actually
within the more massive body. That's the way it is with the Earth/Moon system.
The critical effect this has is that it gives rise to a second force - the centrifugal force - that acts in the opposite direction and wants to create a water bulge on the opposite side of the Earth, away from the Moon.
These two forces, in combination, give rise to equal size bulges on both sides of the Earth, and explain why there are usually two high and two low tides a day. This explains one of the most basic observations about tides.
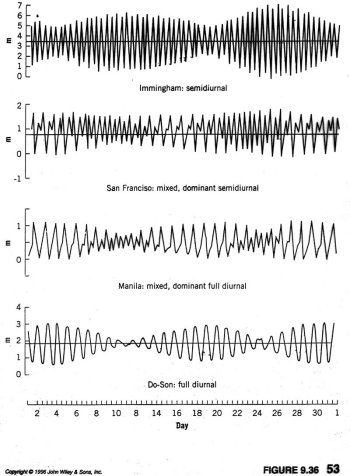
We also know that the basic pattern of daily tidal variations changes from place to place. Usually there are two high and two low tides but the height of the two "highs" is usually not the same. In some places there is only one high tide in a day and in others the signal appears mixed between the two. The gross features of this variable behavior are explained by remembering that the Earth's rotational axis is tilted with respect to the plane of the ecliptic by 23.5° as we know from our previous studies, and the Moon is inclined at about 5°. The net effect is that the tidal bulge is 28.5° off the equator.
That's almost everything. All that's left is to explain why the height of the tides change during a month.
Another way of looking at it:
 |
 |
Video resource: World Tides Video (QuickTime ~7MB) | World Tides Video (Streamed Real Media)
This is due to the combined effect of Moon and Sun. When the two are aligned the gravitational attractions of the two reinforce and create very high tides. This occurs when the Moon is "full" and "new". When the Moon and Sun are maximally out of line, at the Moon's "quarter" positions, the tides are lowest. The high tides are called Spring tides and the lowest are rip tides. We often hear news reports that describe the destructive effects of storms that surge at the same time as a Spring tide - just about the worst combination.
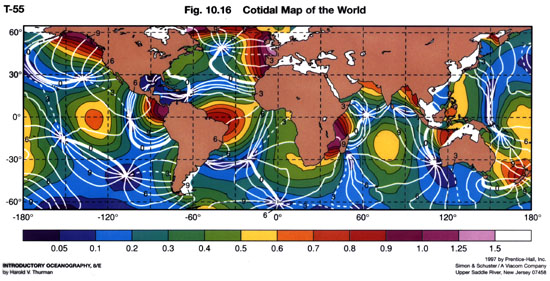
In reality, tides are even more complex than have been described above and we need a more complete theory (or model) to explain their exact behavior. Missing from our simple model are the continents (our equilibrium model has a fully water enshrouded Earth) and the topographic effects of the seafloor including bays and inlets. Even the friction between the seafloor and the water layers must be factored in. These effects are very complex and no fully complete model of tides actually exists. All are approximations.
To Topic 1 / To Topic 3 / To Topic 4 / To Topic 5