A digression into
quirky statistics
Excerpt from
the "Phantom Tollbooth"
from Norton Juster (with illustration from Jules Feiffer)
Up he went -
very quickly at first-then more slowly - then in a little while even more
slowly than that - and finally, after many minutes of climbing up the endless
stairway, one weary foot was barely able to follow the other. Milo suddenly
realized that with all his effort he was no closer to the top than when he
began, and not a great deal further from the bottom. But he struggled on for a
while longer, until at last, completely exhausted, he collapsed onto one of the
steps.

"I
should have known it," he mumbled, resting his tired legs and filling his
lungs with air. "This is just like the line that goes on forever, and I'll
never get there."
"You
wouldn't like it much anyway," someone replied gently. "Infinity is a
dreadfully poor place. They can never manage to make ends meet."
Milo looked
up, with his head still resting heavily in his hand; he was becoming quite
accustomed to being addressed at the oddest times, in the oddest places, by the
oddest people-and this time he was not at all disappointed. Standing next to
him on the step was exactly one half of a small child who had been divided neatly
from top to bottom.

"Pardon
me for staring," said Milo, after he had been staring for some time,
"but I've never seen half a child before."
"It's
.58 to be precise," replied the child from the left side of his mouth
(which happened to be the only side of his mouth).
"I beg
your pardon?" said Milo.
"It's
.58," he repeated; "it's a little bit more than a half."
"Have
you always been that way?" asked Milo impatiently, for he felt that that
was a needlessly fine distinction.
"My
goodness, no," the child assured him. 'A few years ago I was just .42 and,
believe me, that was terribly inconvenient."
"What is
the rest of your family like?" said Milo, this time a bit more
sympathetically.
"Oh,
we're just the average family," he said thoughtfully; "mother,
father, and 2.58 children and, as I explained, I'm the .58"
"It must
be rather odd being only part of a person," Milo remarked.
"Not at
all," said the child. "Every average family has 2.58 children, so I
always have someone to play with.
Besides, each
family also has an average of 1.3 automobiles, and since I'm the only one who
can drive three tenths of a car, I get to use it all the time."
"But
averages aren't real," objected Milo; "they're just imaginary."
"That
may be so," he agreed, "but they're also very useful at times. For
instance, if you didn't have any money at all, but you happened to be with four
other people who had ten dollars apiece, then you'd each have an average of
eight dollars. Isn't that right?"
"I guess
so," said Milo weakly.
"Well,
think how much better off you'd be, just because of averages," he
explained convincingly. "And think of the poor farmer when it doesn't rain
all year: if there wasn't an average yearly rainfall of 37 inches in this part
of the country, all his crops would wither and die".
It all
sounded terribly confusing to Milo, for he had always had trouble in school
with just this subject.
"There
are still other advantages," continued the child. "For instance, if
one rat were cornered by nine cats, then, on the average, each cat would be 10
per cent rat and the rat would be 90 per cent cat. If you happened to be a rat,
you can see how much nicer it would make things."
"But
that can never be," said Milo, jumping to his feet.
"Don't
be too sure," said the child patiently, "for one of the nicest things
about mathematics, or anything else you might care to learn, is that many of
the things which can never be, often are. You see," he went on, "it's
very much like your trying to reach Infinity. You know that it's there, but you
just don't know where but just because you can never reach it doesn't mean that
it's not worth looking for."
"I
hadn't thought of it that way," said Milo, starting down the stairs.
"I think I'll go back now."
"A wise
decision," the child agreed; "but try again someday perhaps you'll
get much closer." And, as Milo waved good-by, he smiled warmly, which he
usually did on the average of 47 times a day.
"Everyone
here knows so much more than I do," thought Milo as he leaped from step to
step.
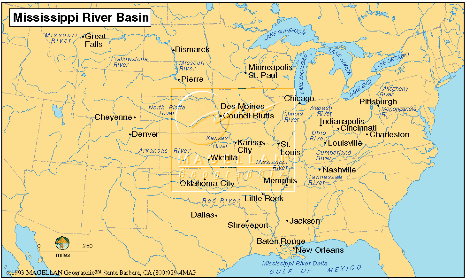
The Mississippi flood of 1993
- The Mississippi River is the sixth
largest river in the world in terms of discharge, with a freshwater
discharge onto the continental shelf of 580 cubic km/yr.
- It is 2,320 miles long and drains 41
of the land area of the continental United States
History
|
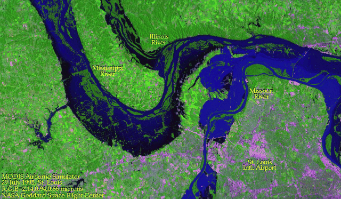
This Landsat image is centered on the
Missouri River at Glasgow, near the St.
Louis airport. At this location the Missouri River is flooding, due to the
high level of the Mississippi. |
|

- The flood of 1993 in the upper
Mississippi River Basin was an unprecedented hydrometeorological event. In
June and July (and somewhat into the fall) of that year, the Mississippi River
basin in the midwestern United States experienced anomalously high
rainfall which produced record flooding. The cause of the high
precipitation was a persistent atmospheric weather pattern consisting of a
quasi-stationary jet stream positioned over the central part of the
nation. As a result, moist air flowing north from the Gulf of Mexico
converged with unseasonably cool, dry air moving south from Canada.
- In June and July, close to 14 inches
of precipitation (averaged over the upper Mississippi River Basin) was
observed, significantly higher than average (approximately 8 inches).
- The fall of 1992 and spring of 1993
were already quite wet and the subsurface was saturated.
- At 45 USGS stations, the discharge
rate exceeded the 100 years flood value (USGS
streamflow gauges).
- The flood lasted for weeks!
- Estimates of total damages in the
Midwest from weather events during 1993 ranged between $12 and $16
billion.
- Over half of these were agricultural
damages, with the remaining being primarily to residences, businesses,
public facilities, or transportation.
- 100,000 home were damaged, 50% of
those due to groundwater or sewer backup.
- Thirty-eight deaths were attributed
directly to the flood.
- Many levees broke, as evident in the
satellite pictures
|
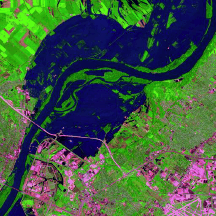
This Landsat image of the Mississippi
River was taken in 1988. |
|

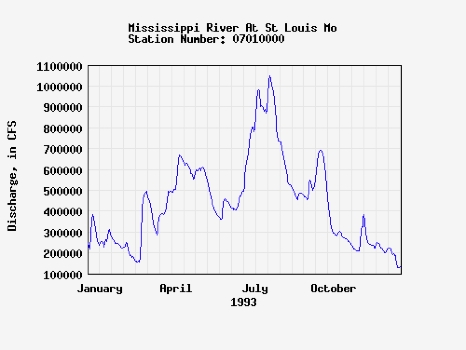
The Mississippi River at St. Louis, Missouri
- location of St. Louis in the upper
Mississippi River Basin
- Click on links for examples of overall acreage damages and emergency
costs and finally for a overall extent of flood.
Feel free to consult the Army
Corps of Engineer’s web site for more info.
Flood Prediction: The Mississippi case-study:
1) Upload the data annual peak
discharge data of the Mississippi at St Louis (StLouis-Discharge).
If you like, you can visit the source of the data on the USGS water resources
page (Mississippi
River At St Louis Mo).
2) Make a histogram of the
entire data set and verify (visually) that it is normally distributed.
3) Calculate the natural
logarithm of the annual peak discharge and determine the basic statistics of
those data (MIN, MAX, AVERAGE, STDEV)
4) Calculate the discharge rate
equivalent to the 100 years flood (P=0.01). (in Ft3/sec. Do not
forget to reverse the transformation by using the EXP function):
a) Graphically: Transform the
data by calculating exceedance level (r/(n+1)) and then plot that vs. lnQ. Use
this graph to estimate the value of the 100 years flood. (Note: You can use 1) a regression
function applied to the portion of the curve that is linear ob 2) a polynomial
fitted to the entire data set).
b) Formula: Use the NORMINV function
to determine this value. The NORMINV function in Excel returns the inverse of
the normal cumulative distribution for the specified mean and standard
deviation. Syntax: NORMINV(probability,mean,standard_dev), where “Probability” is a
probability corresponding to the normal distribution, “Mean” is the arithmetic
mean of the distribution, and “Standard_dev” is the standard deviation of the
distribution.
c) Are these values similar?
Explain why.
5) Do the same for the 1000 year
flood
6) How does the 1993 flood
compare to these two discharge rates (100- and 1000-years floods)?
7) What is the recurrence
interval of the 1993 flood at St. Louis? Use the NORMDIST function. The NORMDIST
function in Excel returns the normal distribution for the specified mean and
standard deviation. Syntax: NORMDIST(x,mean,standard_dev,cumulative),
where “X” is the value for which you want the distribution, “Mean” is the arithmetic
mean of the distribution, “Standard_dev” is the standard deviation of the
distribution, and “Cumulative” is a logical value that determines the form of
the function. When cumulative is TRUE, NORMDIST returns the cumulative
distribution function.
8)
Perform
the calculation for the 100 years flood again, this time using a period of only
20 years from anywhere in the record (make sure you state which period you chose).
9) Compare this result to the
one obtained using the entire data set. How big a data set should you use? Why?
What processes may prevent using the present data set for predictions of future
flood magnitude and frequency?
Precipitation Prediction
Student
exercise: Precipitation
prediction
10) Upload the precipitation data for several cities in the US.
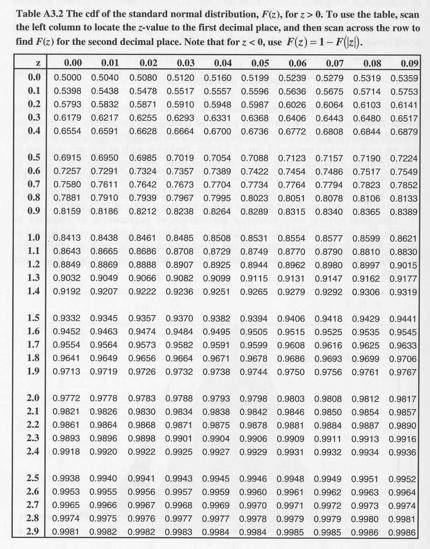
11) Use these data to calculate
the 100 years rain event in the city of your choosing (ask yourself: which data
you should use?). To perform this calculation, you should use the table below
that provides cdf for any particular z-value.
12) Compare this value with the
number of times measured precipitation did equal or exceed the prediction made
in the previous question. Are they similar/different? Why?
13) Perform the calculation for
the 100 years precipitation, this time using a period of only 20 years from
anywhere in the record of the chosen city. Are the results similar? Explain
why.
Challenge Question:

Identify a station in the U.S. for which you can obtain a time series for precipitation and for streamflow (visit the USGS web site: http://water.usgs.gov/waterwatch/). Is there a correlation between precipitation and streamflow? Why?