LAB 1: Introduction to ArcGIS 8
Outline
- Introduction
- Purpose
- Lab Basics
- About the Computers
- About the software
- Additional
information
- Data
- ArcGIS Applications
- Starting ArcGIS
- ArcCatalog
- Starting ArcCatalog
- What is in
ArcCatalog
- Connecting to data
- Working with
ArcCatalog
- Searching data
- Metadata Tools
- Managing data
- About ArcToolbox
- Starting ArcToolbox
- What is in
ArcToolbox
- About ArcMap
- Starting ArcMap
- What is in ArcMap
- Adding data /
creating a map
- Symbology and data
appearance
- Display
- Labels
- Querying data
- Cartography
- Conclusion
- To turn in
1.0 Introduction
Please read the labs in their entirety before attending your
session. Skipping sections may result in you missing important explanations.
We will be
using ArcGIS 8.2 for the rest of the course. The 3 basic applications you will
be using in ArcGIS are:
…
ArcMap: where you can view, edit, and analyze your data
and create graphs, reports and printable maps.
…
ArcCatalog: where you can preview, document, and
organize your data.
…
ArcToolbox: where you can perform, advanced data
analysis and processing tasks.
After starting
the program it may take a few moments for it to appear. Be patient and do not
attempt to restart it, or else you'll end up with multiple copies running.
To find out
what any button does in ArcGIS, place the cursor over it and note the
explanatory text provided at the bottom left of the screen. Play around with
the various buttons and tools in order to discover their capabilities.
You are
encouraged to use the Zip drive directory as your working workspace. To begin,
copy your lab data on your zipdisk. While working on your lab, save your map
document to this directory by using the File > Save AsÖ option from the menu bar. Once the document has been
saved once, you can simply use the ìSaveî icon on the toolbar.
Note: Extra help is available at the on-line HELP with
ArcGIS. The easiest way to use the help is through the topics section (vs.
keying in the word).
1.1 Purpose
To
familiarize with:
…
The three main applications of ESRIís ArcGIS Software,
namely ArcCatalog, ArcMap and ArcToolbox
…
Basic data display, queries, and publication
…
How to navigate through the ArcInfo help files
1.2 Lab Basics
About
the Computers:
…
The
computers are DELL with Intel Pentium
Processors.
…
Avoid
opening multiple applications was this may freeze the computer
…
You may
experience your computer crashing without notice. Please save regularly.
…
Please
create your folder under the appropriate drive. This will be used as your
personal workspace in future labs. Note: No spaces in folder or filenames.
ArcInfo (a component of ArcGIS) does not allow spaces in folder or filenames.
About
the software
Throughout this lab we will be working with ESRI's ArcGIS software. We
have the latest version (ArcInfo 8.2). The software consists of two basic
components, ArcGIS 8.2 Desktop and ArcInfo 8.2. ArcGIS Workstation. ArcInfo 8
is structured around three applications- ArcCatalog, ArcMap, and
ArcToolbox.
The 3 basic
applications and their functionalities:
…
ArcMap: Lets you display, edit, and analyze your data
and create graphs, reports and printable maps.
…
ArcCatalog: Lets you preview, document, and organize
your data
…
ArcToolbox: Lets you can perform, advanced data
analysis and processing tasks.
We
also have the ArcInfo 8.2 Workstation as an add-on to the desktop. It is
essentially the same as previous dos-based or unix ArcInfo 7. ArcInfo may be
clumsy to learn but still provides the most comprehensive suite of
geoprocessing tools.
Additional
information
Additional information on the ArcGIS software can be found through ESRI'sArcGIS 8 web site, and through the ESRI Virtual Campus web site, which offers
several free modules on ArcGIS and ArcInfo extensions.
1.3 Data
The
data that we will be using in this lab are:
Geodatabases:
- New York ñ New York State geodatabase - contains state
boundary, counties, roads, rivers, and cities
Coverages:
- NY_lakes - Coverage New York State Lakes
Shapefiles:
- Us48states - Shapefile of lower 48
1.4 ArcGIS Applications
To start any of
ArcGIS application, go to Start >Programs > ArcGIS Ö
and select the application.
It may
take a few moments for the program to appear. Be patient and do not attempt to
restart it, or else you'll end up with multiple copies running.
To find out
what any button does in ArcGIS, place the cursor over it and note the
explanatory text provided at the bottom left of the screen. You should play
around with the programs in order to discover their capabilities.
Data for this
lab will be available for download on to your machine. While working on your lab,
save your map document to your folder by using the File > Save AsÖ option from the menu bar. Once the document has been
saved once, you can simply use the ìSaveî icon on the toolbar.
Remember
that extra help can be found on-line. Select ArcGIS Desktop Help under the Help
menu in each of the applications. You have the option to use the through the
topics section, keying in a word.
1.4.1 ArcCatalog
ArcCatalog
is the ArcGIS Desktop application for organizing, browsing, and managing your
data and map files. It includes tools for browsing and finding geographic
information, recording as well as for viewing and editing metadata. In many
ways, ArcCatalog is similar to Windows Explorer. Since it is easy to delete
files this way, you should be careful to delete only when you are sure that you
will not need the file any longer.
Starting ArcCatalog
Now we will start ArcCatalog and explore its contents. To start
ArcCatalog, click on the  button and navigate to Programs -> ArcGIS -> ArcCatalog
Note: You can also start ArcCatalog from ArcMap
application by clicking 
ArcCatalog is similar in structure to Windows Explorer -- on
the left hand side is a view of the table of content or Catalog
"tree" showing how the data are organized. The right hand
side provides options for exploring the contents of the data shown in the
Catalog tree. You will notice that there are different icons used to represent
the available folders and their contents.
When ArcCatalog is started up, it automatically looks for
folders containing spatial data. If spatial data are found somewhere in
the folder the following icon  is used to represent it. If no spatial data are found,
a regular folder icon is used (such as in the ESRI folder seen on the right-hand side of the image
above). Other icons that may of interest are:
is used to represent it. If no spatial data are found,
a regular folder icon is used (such as in the ESRI folder seen on the right-hand side of the image
above). Other icons that may of interest are:
 for Database Connections, Geocoding
Services, Internet Servers, and Search Results.
for Database Connections, Geocoding
Services, Internet Servers, and Search Results.
Throughout the lab, it will helpful to you if you spend a
bit of time examining these on your own as they become active. To find out what
a particular button does, hold your mouse cursor over the button for several
seconds. A note will appear telling the function associated with the
button, and a more informative description will appear on the bottom of the
ArcCatalog window -- if you hold your cursor over the upward pointing arrow
(the first button directly under 'File'),
you will see a note reading 'Up One Level,' and the bottom of the window will
read 'Go to the next level up in the catalog tree').

|
|
|
Some basic icons used in ArcGIS and what they represent
|

|
Folder connection containing
geographic data (Workspace)
|

|
Folder containing no geographic data
|
|

|
Map file
|

|
Folder containing geographic data - inside a Workspace (second level)
|
|

|
Geodatabase
|

|
Coverage - Polygon
|
|

|
Geodatabase feature dataset
|

|
Coverage - Arc
|
|

|
Geodatabase feature class - Annotation
|

|
Coverage - Point
|
|

|
Geodatabase feature class - Polygon
|

|
Coverage feature class - Polygon
|
|

|
Geodatabase feature class - Arc
|

|
Coverage feature class - Arc
|
|

|
Geodatabase feature class - Point
|

|
Coverage feature class - Tic
|
|

|
Shapefile - Polygon
|

|
Coverage feature class - Label
|
|

|
Shapefile - Arc
|

|
Grid data
|
|

|
Shapefile - Point
|
|
|
|

|
Geodatabase feature class - Point
|
|
|
|
Accessing data in ArcCatalog
You can access your data
in ArcCatalog by using the following ways:
1. By navigating down the catalog tree to
your data folder if there is already a connection to the drive with your data.
This is fairly straightforward if catalog tree is not extensive.
2. Another option is to create a direct
connection to your data. A direct connection will help increase speed of
accessing your data. This is procedure is also a necessary step if the drive
with your data are not shown in the Catalog tree (i.e.,if you are using data
saved on your network drive).
To connect to your data, click on the "Connect to
Folder" button.  Navigate to the folder containing your
data for this lab- in this example: D:\data.
Select the folder (it will be highlighted in blue), and then click
"OK." A direct connection to your data folder will now appear in
the Catalog Tree.
Navigate to the folder containing your
data for this lab- in this example: D:\data.
Select the folder (it will be highlighted in blue), and then click
"OK." A direct connection to your data folder will now appear in
the Catalog Tree.
|
Question 1
|
|
|
What is the function
of each of the following buttons?
|
|
|
|

|
|
|

|
|
|

|
|
|

|
|
|

|
|
|

|
|
|

|
|
|

|
|
|
Working with ArcCatalog
ArcCatalog is used for "organizing, browsing, and
managing your data and map files. It includes tools for browsing, and finding
geographic information, viewing and editing metadata, and defining the schema
structure for geographic data.
Data organizing in ArcCatalog is very similar to that in
Windows Explorer - you can drag and drop coverages, shapefiles, or geodatabases
into new workspaces, or you can use the Windows shortcut keys (CTRL-C and
CTRL-V). Please note that delete, move,
or otherwise alter the data using ArcCatalog is permanent. You cannot recover a
Coverage or Shapefile deleted using ArcCatalog.
In ArcCatalog - the Catalog tree displays in a
hierarchical fashion all of the items in the Catalog - much like how data
browsing is done through programs such as "Windows Explorer." A
folder that contains files will have a box with a plus or minus sign to the
left of the file name. This indicates whether or not the folder has been
expanded.
The ArcCatalog interface consists of the menu bar, table of
content area and content viewing area. The Menu bar contains the dropdown menu,
windows file management and metadata editing buttons. Please take a moment or
two to explore the data in the Catalog tree. You can use the arrow buttons on
your keyboard, or your mouse to navigate. While navigating, pay
attention to the changes that take place on the right hand side of the
ArcCatalog window.
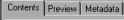
The right hand side of the Catalog allows you to examine the
data further with three basic tabs- Contents, Preview and Metadata. The
"Contents" tab will show a list of all the files that comprise the
folder or coverage of interest. These files can also be viewed if you
click on the plus sign to the left of the folder or Coverage icon.
The "Preview" tab, will enable you to preview of
the data geography or the data attribute table. You can change from geography
view to table view (or vice versa) using the preview pulldown menu at
the bottom of the Window.
|
Question 2:
|
|
List the new set of icons that become active in the menu
bar when you select the Preview Tab. Why? What do they do?
Are they always active when previewing data?
|
|
Question 3
|
|
List the names of icons that
get turn on when you select the Metadata tab. What does each do?
|
Working with Data Management Tools
Within ArcCatalog, you can create folders, geodatabases,
datasets or feature classes
(Shapefiles, Coverages and tables).
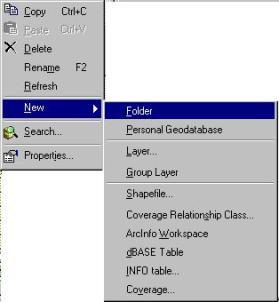
To Create a new
folder, geodatabase or new layer, right-click on the drive you want to create
in and select new as shown below.
To Delete dataset,
folder select the item in the table of content and delete with 
Quickly explore the rename, copy and paste functions work.
NOTE: NEVER use
Microsoft windows file manager to manage your geographic data like Coverages
and grids. This may cause irreparable damage to your data.
|
Question
4
|
|
Right-click on the ny_cities feature class and select
properties. What are the five menu tabs that show up?
a.
b.
c.
d.
e.
|
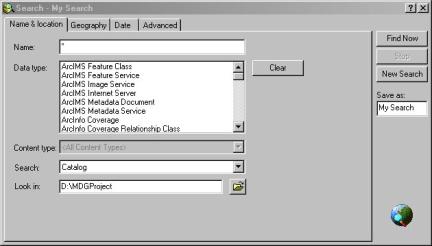
Searching Data in ArcCatalog
You can search geographic information locally (on your
machine) or cross the network (including the Internet) using one or a
combination of the following search criteria- Name & Location,
Geography, Date or Metadata element.
Metadata Tools
Metadata is the
supporting descriptive information about data. Metadata includes information
such as date, creator, geographic extent, coordinate system, and attribute
domains. The ArcCatalog Metadata tab helps display metadata for a selected
data. If Metadata does not exist for a selected data ArcGIS automatically fills
in some of the fields in the metadata.
You can create thumbnails of your data as part of the metadata. To
create thumbnail locate one of the data layers (shapefile, feature class or
grid) in the table of content. Select the Preview tab and the Thumbnail icon
gets turned on. Click on the Thumbnail icon to create the Thumbnail.
Question 5
|
|
Using the ny_cities as name search for all
shapefiles, in the New York Geodatabase. Use Identify tool within
Preview tab to locate any three towns:
a. Lat Long
b Lat Long
c Lat Long
|
Question 6
|
|
Which of the metadata fields are automatically filled?
|
1.4.2 ArcToolbox
ArcToolbox provides the tools for data management, analysis
and conversion tools. Also provides an option for the user to write scripts and
create customized tools on their own.
You can start ArcToolbox, using either one of two ways: Through
the start menu, you can click on the Start button and navigate to Programs -> ArcGIS -> ArcToolbox.
From ArcCatalog, you can click on the  icon.
icon.
 If you
click on any of the headings, a short description of the tools under that
heading is listed at the bottom of the ArcToolbox window.
If you
click on any of the headings, a short description of the tools under that
heading is listed at the bottom of the ArcToolbox window.
You can view the tools available under each of the major
headings by clicking on the + next to a
tool heading (i.e. Data Management Tools, Analysis Tools and My Tools).
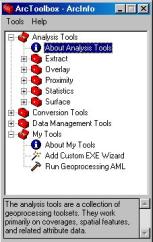
For an overview of all of the
functions of a tool set, select the "About..." topic (e.g., About
Analysis Tools, as seen in the image to the right).
Inside
the tool folders (such as Extract, Overlay, Proximity, etc. listed under
"Analysis Tools"), to select a tool, double-click on either the specific tool you want to
use  , or
select the Wizard tool
, or
select the Wizard tool  if
you are unsure which specific tool you need to use.
if
you are unsure which specific tool you need to use.
Take a few minutes to explore the
toolbox and the geoprocessing options provided and answer the following
question.
|
Question 7
|
a. What does the view tab under the Tools/Options selection show?
b. What happens to the ArcToolbox interface when you turn
on and off the check marks?
|
1.4.3 ArcMap
ArcMap is the ArcGIS application for
displaing, querying, editing, creating and analyzing data. ArcMap makes it easy
to layout your maps for printing, embedding in other documents, or electronic
publishing. When you save a map,
all your layout work, symbols, text and graphics are automatically preserved.
Starting ArcMap
ArcMap
can be opened via the Start menu (Start -> Programs -> ArcGIS -> ArcMap) or from ArcCatalog (click on the  ArcMap icon). In addition, you can open ArcMap by double clicking
on a map file
ArcMap icon). In addition, you can open ArcMap by double clicking
on a map file  in
ArcCatalog.
in
ArcCatalog.
When
you first start ArcMap, you may see the"Welcome to ArcMap" window.
This window will provide the options to:
1.) Create a new map,
2.) Open the last map you were using,
3.) Open an existing map, or
4.) Create a new map using a map
template.
The
ArcMap Window
The
top portion of the ArcMap window contains the menu and toolbars. You can change
which toolbars are displayed by right-clicking on the top portion of the window (the
gray part) and selecting which menu you need or don't need (below).
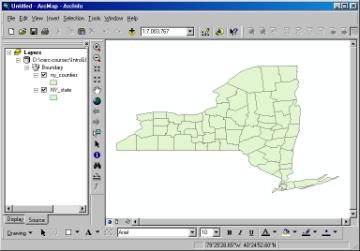
The left portion of ArcMap shows the
table of content. This displays the layers (the "layer tree") added
to the map (and whether or not they are currently displayed). There are
two ways to explore included data - by "Display" or
"Source." You can toggle between the two by selecting the
appropriate tab on the bottom of the layer tree: 
The
Display tab shows the
layer name, whether or not the layer is displayed. A check mark in the box next to the name indicates the layer
is being displayed. A ì+î or ì-ì sign against the name indicates how the layer
is displayed.
The Source tab shows the appropriate layer icon
(same as seen in ArcCatalog), as well as the location (or "source")
of the data.
The right portion of ArcMap
provides a view of the data. This is very much like the view window in ArcView
3.x GIS. The icon  allows you to toggle between "data
view" (the globe) or "layout view" (the paper icon) mode.
allows you to toggle between "data
view" (the globe) or "layout view" (the paper icon) mode.
Data
view mode enables you to
zoom in and out, pan, identify, select, etc. the data in this portion by using
the following tools:

The Layout view is
similar to the layout in ArcView. A new set of tools are provided for
exploration of the layout:
In layout view, you also may use the tools to zoom in / out
/ pan, etc. that are available in the data view.
Go examine how zoom in /zoom out tools in both the layout
and data view affect your map and map elements.
Working with data in ArcMap
Unlike ArcView 3.x GIS ArcMap do
not allow you to open more than one view at the same time. To open a new map
file we either need to open a new ArcMap window or close the existing map file.
Several options to add data to a
map file:
1.
Use the "Add data" button on the ArcMap
toolbar 
2.
Navigate to File ->
Add data
3.
Drag and drop data from ArcCatalog.
With both ArcCatalog andArcMap open, left click on the data that you want
to add to your map file- hold the mouse button down, do not release the button
yet. If you can see both the Catalog tree in ArcCatalog and the
view window inArcMap, drag the data straight from ArcCatalog to the view window
in ArcMap. Release the mouse button and drop the data in ArcMap.
Try each of these methods, and add the data layers from the
New York geodatabase.
Order of data layers
ArcMap automatically organizes data layers as they are
added. From top to bottom, Point layer is placed on top followed by lines,
polygons and grid data. Layers added last are placed on top of their
counterparts. For instance rail layer would be placed on top of line layers
below points.
The order in which layers appear in the table of content can
be changed re-organized by clicking on a layer and dragging to the desired
location.
Data
properties: You can view
the properties of a data layer by either double click on the data layer's name
or right-click on the data layerís name and selecting properties option.
The Data Properties window has several tabs through which you can view
and modify the display properties of the data layer. Spend the rest of this lab
exploring the various tabs and functions within the Data Properties window.
|
Question
8
|
|
What
do the options under the scale range in the General Tab do?
|
|
Question
9.
|
|
Under
which tab can you view the spatial extent of your data set?
|
|
Question
10
|
|
In
the Display Tab what does changing the transparency value do to your map?
|
1.5 Conclusion
In this lab, we have explored the three basic applications of ArcGIS,
namely ArcCatalog, ArcToolbox, and ArcMap have been covered. Please note
that one lab session would not be enough to completely master the various functions
of the ArcGIS. In the coming weeks
we will work on specific applications of the software.
Please turn in your answer sheets
Please
check your answers before turning them in. You must turn in all your answers
before the start of next weekís lab.