
I am an X-ray physicist, software engineer and machine learning enthusiast. I earned my PhD degree from Department of Applied Physics and Applied Mathematics at Columbia University in 2015, and Master of Computer Science in Machine Learning from Georgia Institute of Technology in May, 2020. I have ten years of experience programming with Python. I have written and published two software programs xINTERPDF and JRgui at peer-reviewed journals. I have also developed web apps for scientific computing using Django/Flask web frameworks.(more details see the CODES and WEB APPS tabs).
Dr. Chenyang Shi
Department of Applied Physics and Applied Mathematics
Columbia University,
and College of Computing
Georgia Institute of Technology
Education
- Georgia Institute of Technology, Atlanta, GA, 2018-2020 (in May)
M.S., Computer Science, specialized in Machine Learning, GPA 3.90/4.00
Ten Courses completed: Graduate Algorithm (A), Computer Simulation (A), Big Data for Health Informatics (A), Machine Learning (A), Artificial Intelligence for Robotics (A), Computer Vision (A), Knowledge-based AI (A), Machine Learning for Trading (A), Computer Networks (A), and Computational Photography (B). - Columbia University, New York, NY, 2015
Ph.D., Materials Science
Thesis: Local structure and lattice dynamics study of low dimensional materials using atomic pair distribution function and high energy resolution inelastic x-ray scattering - Chinese Academy of Sciences, Beijing, 2011
M.S., Materials Science,
Thesis: A study on structure-property relationship in functional electronic ceramics - Tongji University, Shanghai, 2008
B.S.E., Materials Science and Engineering, minors in German and Japanese
Academic awards and fellowships
- 2015 Chinese Government Award for Outstanding Self-Financed Students Abroad
- 2014 Engineering Graduate Student Council Scholarship, Columbia University
- 2014 Poster Session Award, NSLS/NSLS-II and CFN Users' Meeting, Brookhaven
- 2012-2014 Energy Frontier Research Center Fellow, Columbia University
- 2011 President's Award, Chinese Academy of Sciences
- 2008 Excellent undergraduate thesis, Tongji University
Program Codes Developed
xINTERPDF: a GUI program to extract structural information from measured X-ray pair distribution function (PDF) data for organic materials(YouTube Demo, Link to Paper)
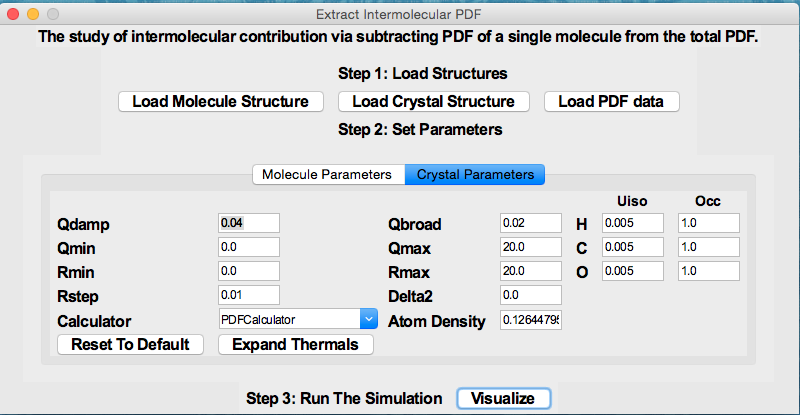
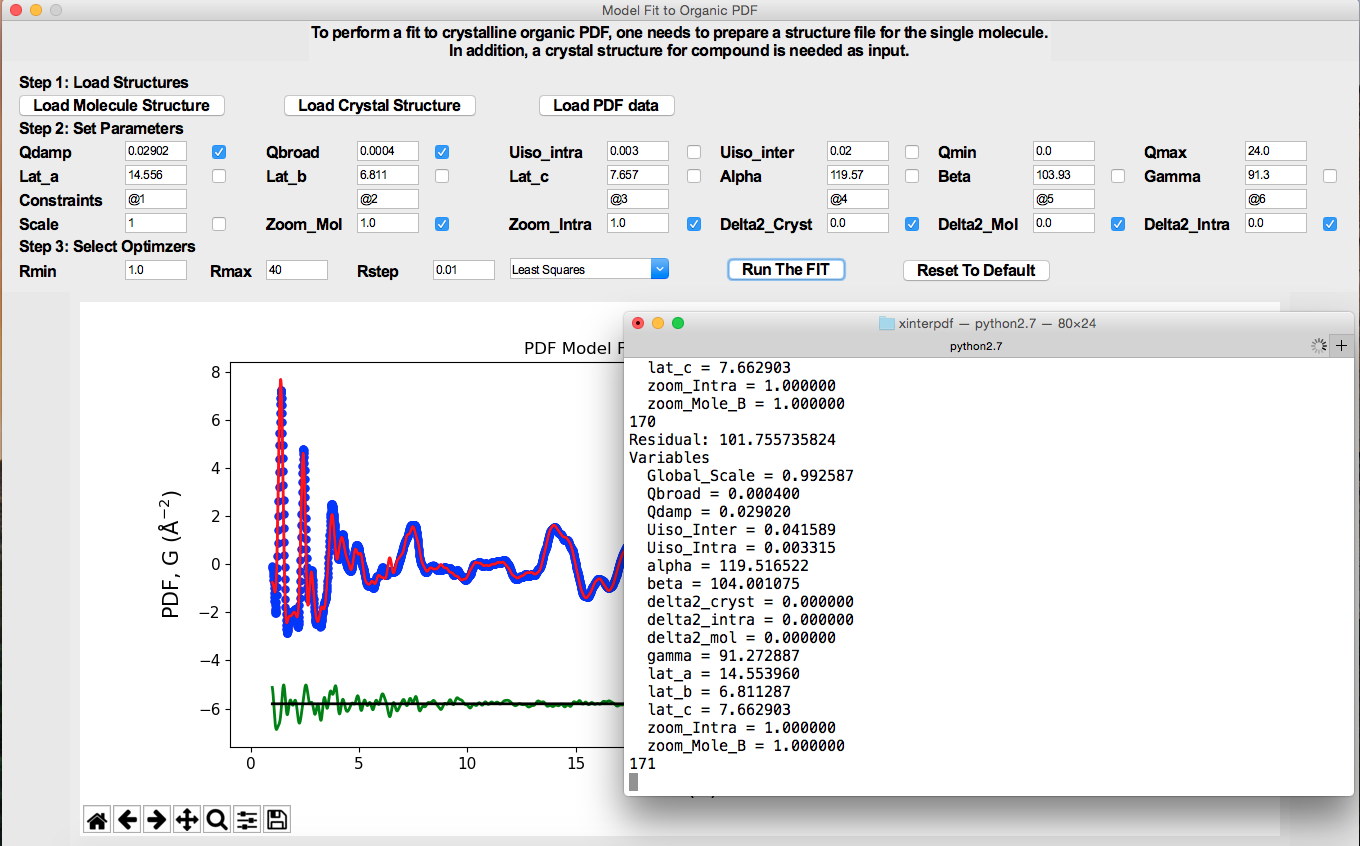
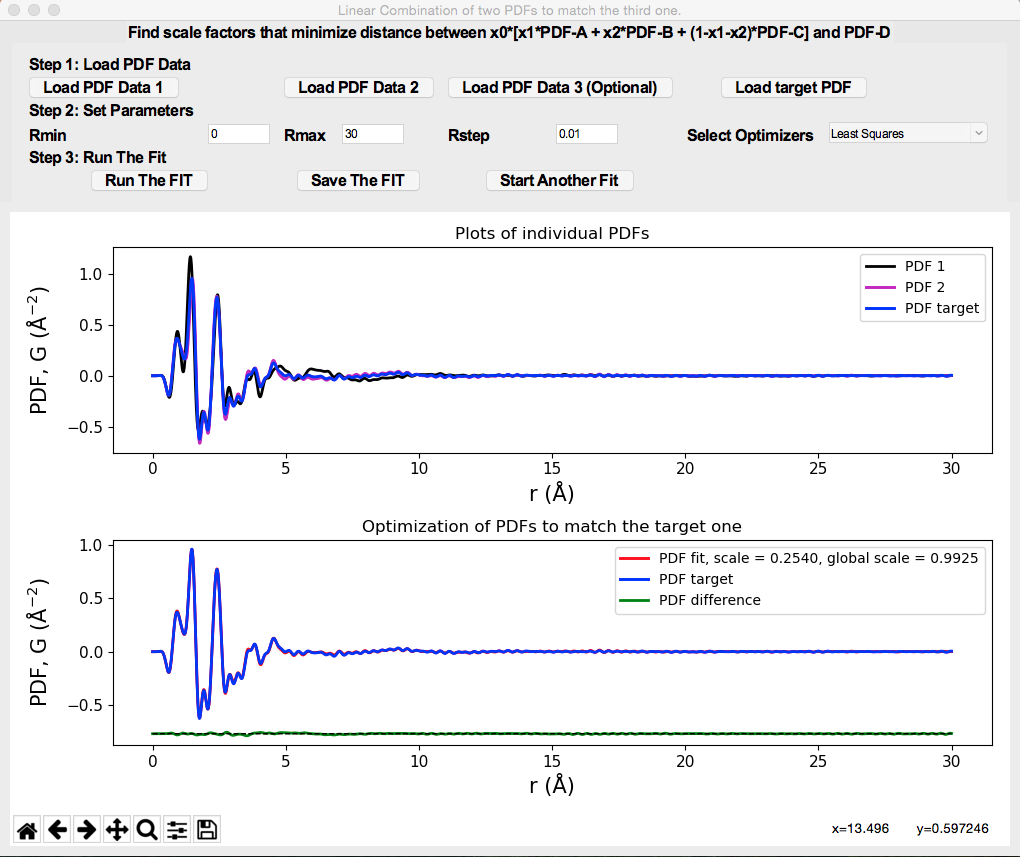
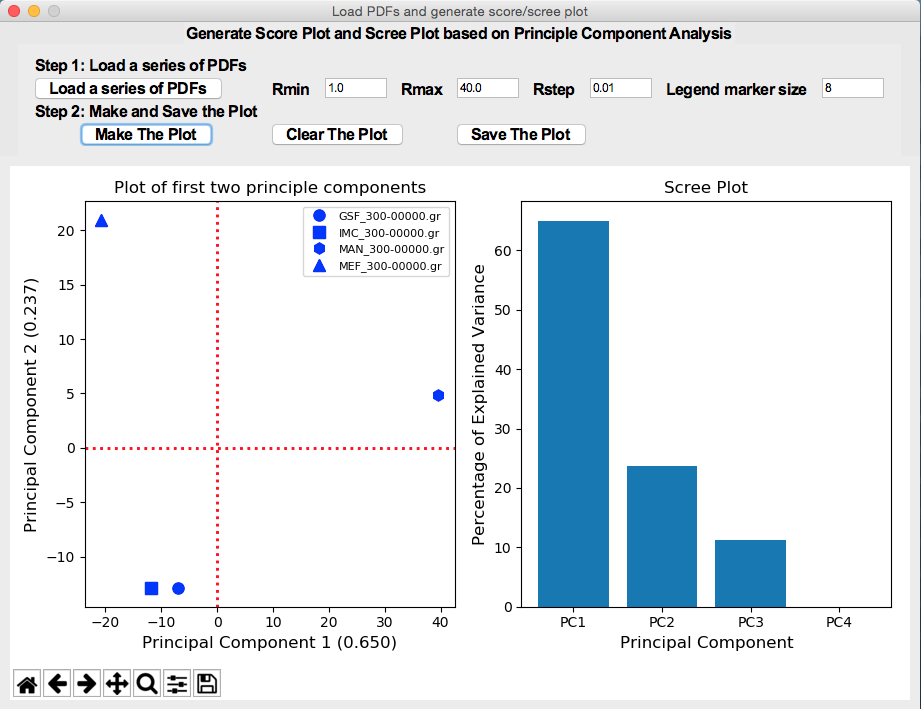
The program is designed for analyzing organic pair distribution function (PDF) data collected at synchrotron and/or laboratory X-ray sources. It uses DiffPy-CMI as a backend for simulation of PDFs. Currently it supports (1) The study of intermolecular interaction (e.g. hydrogen bonds) by subtracting out the scattering signal of single molecule(s) in real space. (2) The PDF model fit of the crystalline organic compound using the method proposed by Prill et al. (J. Appl. Cryst., 48, 171-178, 2015.) (3) The phase quantification of physical mixtures of organics. (4) Generate Score/Scree plots based on Principle Component Analysis. The program is accessible via (https://github.com/curieshicy/xINTERPDF), and is distributed through Conda. The program has a main interface.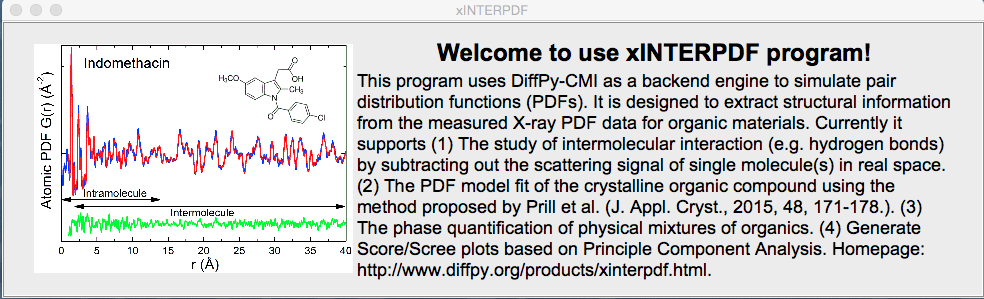 The interface for the study of intermolecular correlation is as follows.
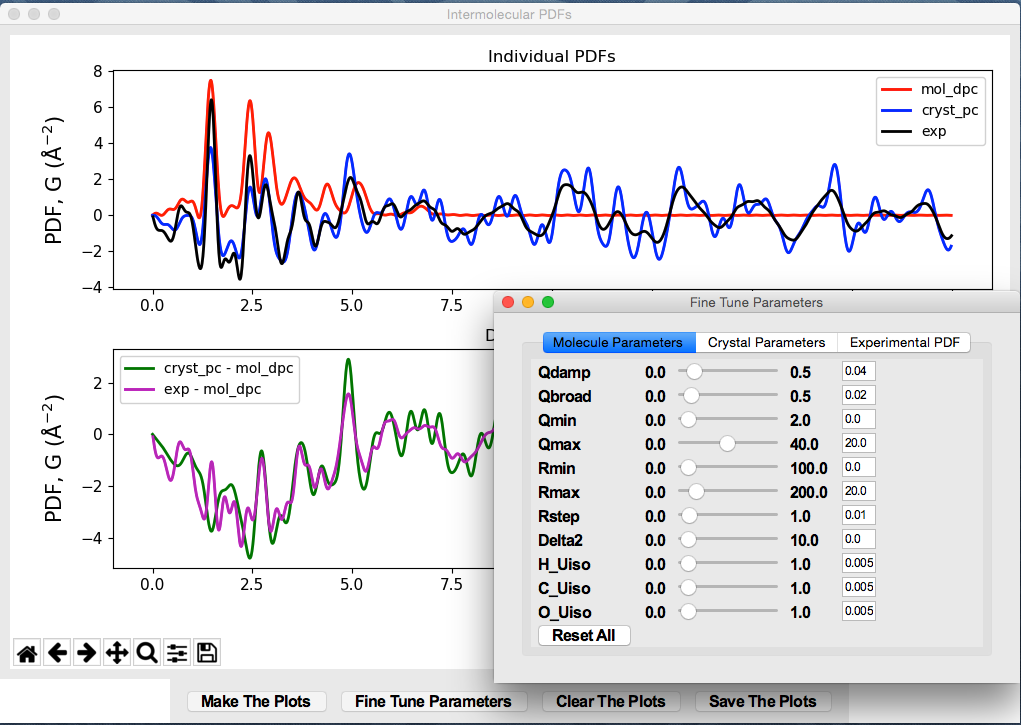
 The window for visualization of intermolecular PDF looks like
 Below is the GUI window for PDF model fit of a crystalline organic compound.
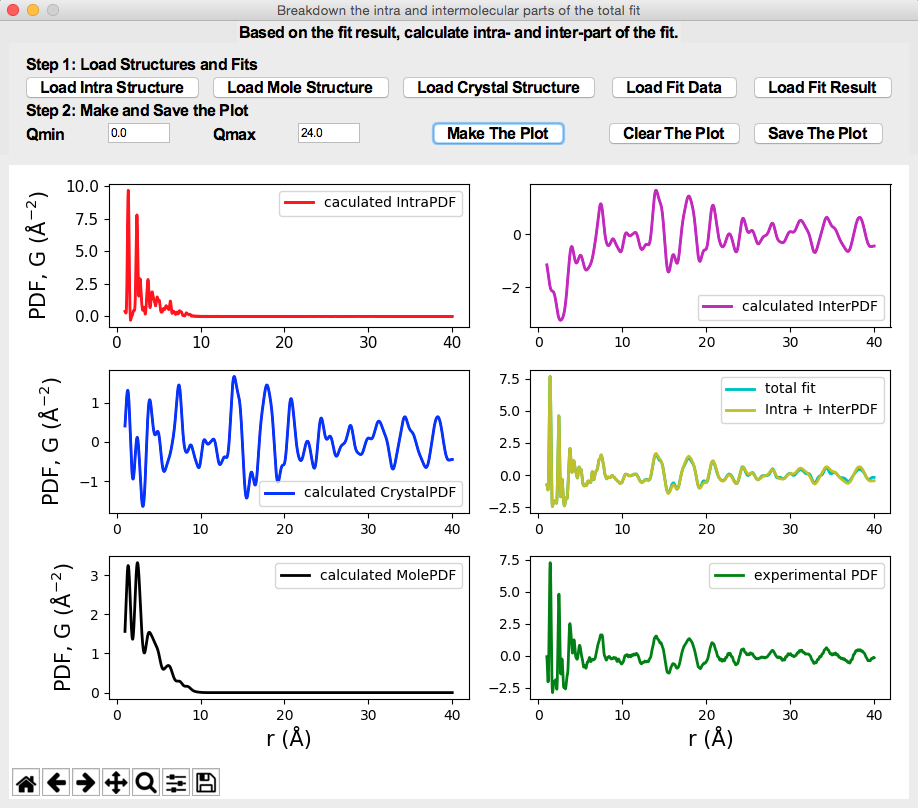
 A breakdown of the total fit to the organic crystalline PDF.
 The interface for phase quantification
 Generation of Score/Scree plots from Principle Component Analysis
JRGUI: a GUI program for prediction of physicochemical properties of drug-like molecules (Link to Paper)
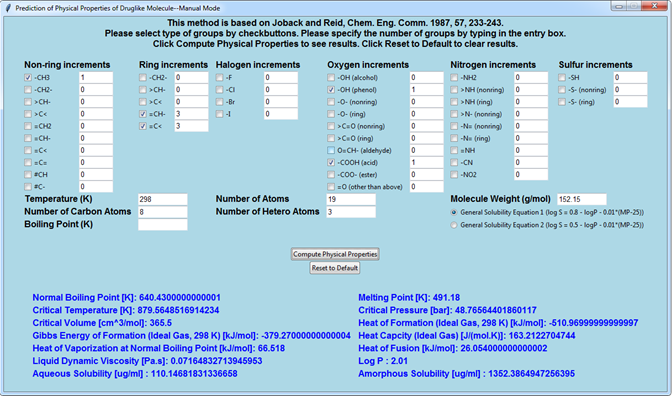
By using the modern object-oriented programming language Python (e.g. tkinter and pandas modules) and a chemoinformatics open source library (RDKit), the classic Joback and Reid group contribution method was revisited and written into a graphical user interface program—JRgui. The underlying algorithm behind the program is explained, herein, with the users being able to operate the program in either a manual and automatic mode. In the manual mode, the users are required to determine the type and occurrence of functional groups in the compound of interest and manually enter into the program. In the automatic mode, both of these parameters can be detected automatically via user input of the compound SMILES string. An additional advantage of the automatic mode is that a large number of molecules can be processed simultaneously by parsing their individual SMILES strings into a text file which is read by the program. The resulting predicted physical properties along with approximately 200 molecular descriptors are saved in a spreadsheet file for subsequent analysis. The program is freely available from (https://github.com/curieshicy/JRgui) for Windows, Linux and macOS 64-bit operating systems. It is hoped that the current work may facilitate the creation of other user friendly programs in the chemoinformatics community by using Python. The JRgui has a main interface.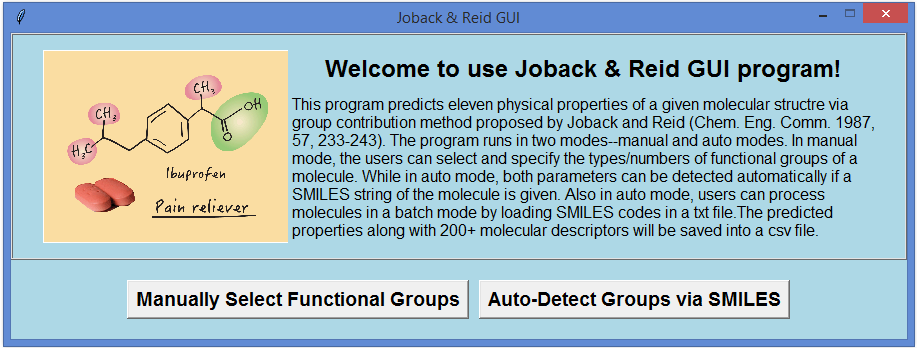 In mannual mode, the users have the options to input the types and occurrences of the functional groups
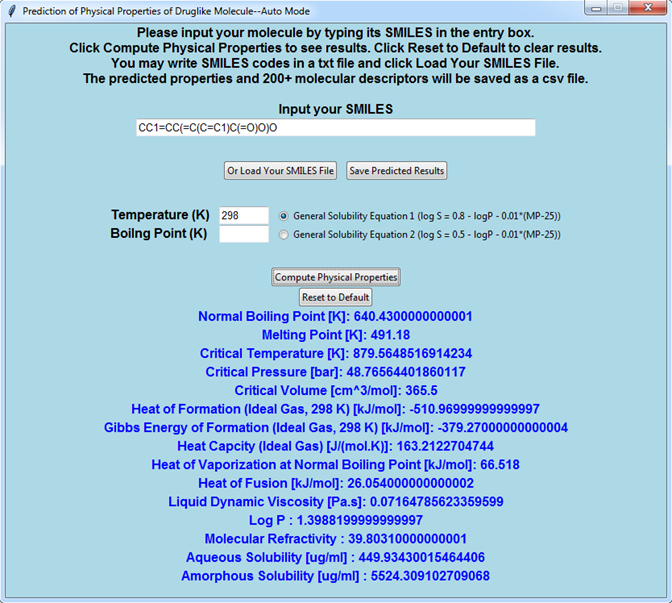
 While in auto mode, only the SMILES codes are necessary from users.
The Web Apps Developed
The web interface for prediction of drug absorption by human body.
This web application, built using Python micro web framework Flask, predicts the fraction of absorption (i.e. Fa) of drug molecules based on input parameters of dose amount, solubility and permeability of drug substances. Two drug particle sizes (250 nm versus 25 µm) are considered. The predicted Fa value is displayed on an interactive heatmap that depicts the entire parameter space. The web app is hosted at Amazon linux server.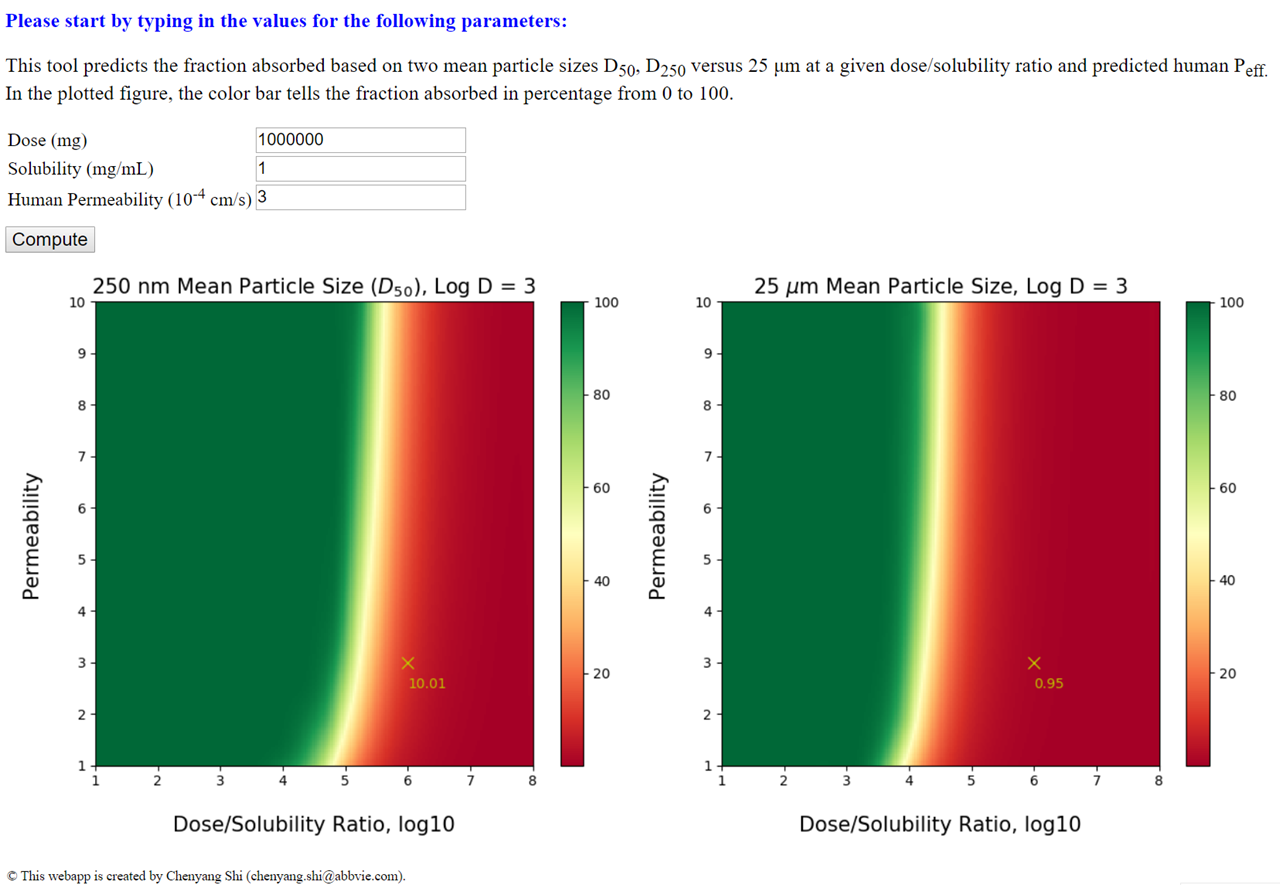
An web application for quick estimation of moleculear properties based on 2D structures.
Another Flask web app that calculates and predicts various molecular properties given an input of two-dimensional molecular structure in SMILES format. The LogD prediction model was built using >140,000 molecules with a R2 value > 0.82. In addition, the Joback and Reid method has been rewritten into a web interface.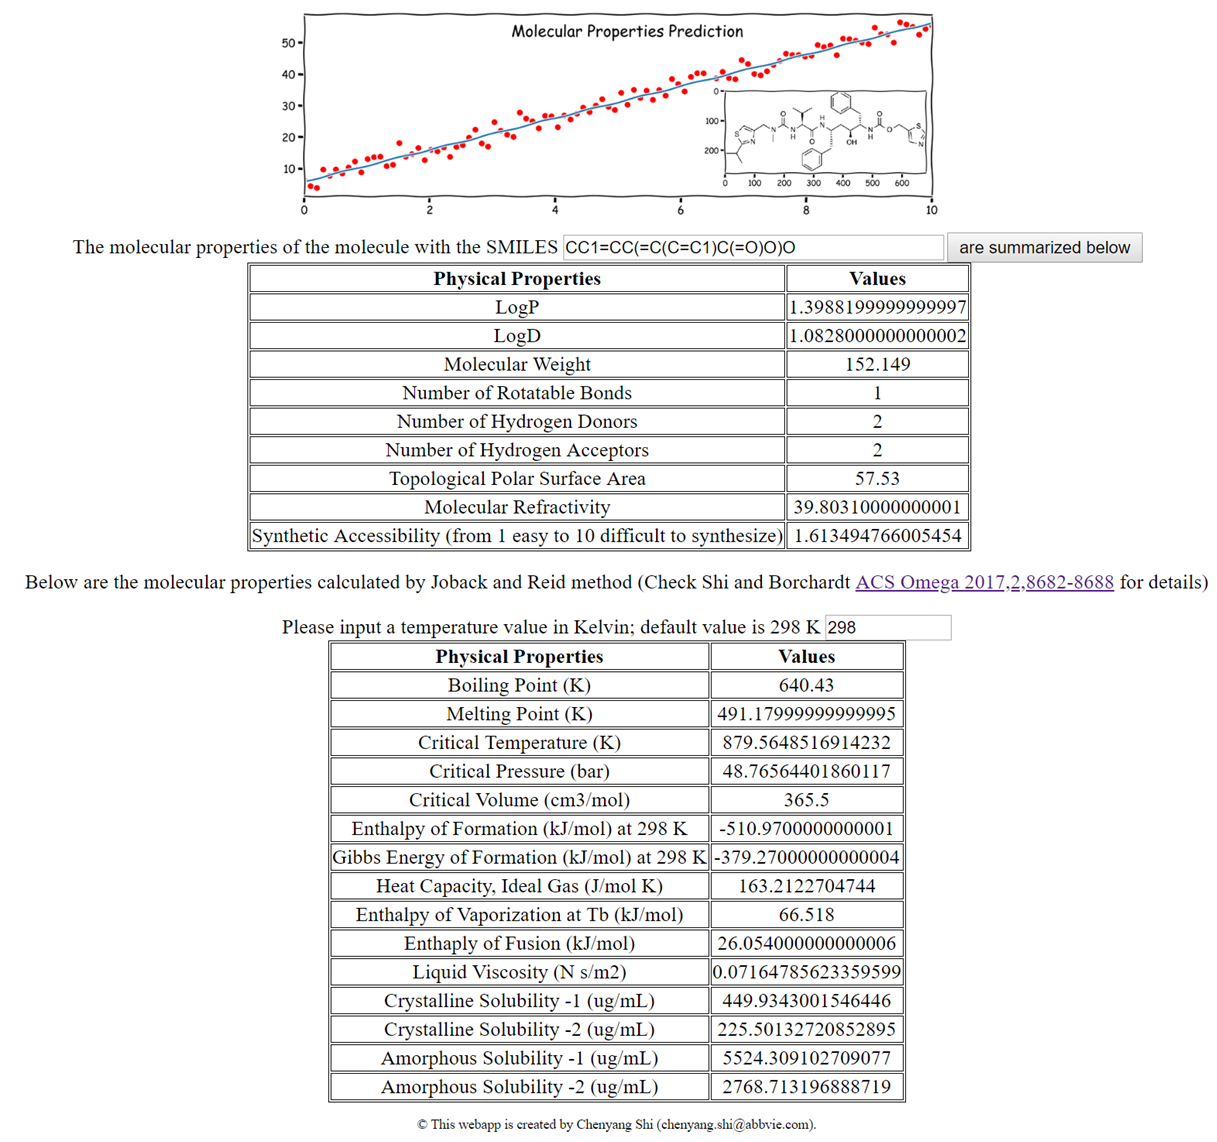
Computer Vision
Colorization Using Optimization
The project implements the colorization algorithm from Levin et al. (The first three equations have been implemented). Given a grayscale image, the algorithm colorizes it based on scribbled color hints. The detailed procedure is outlined below with three set of example results shown to the right.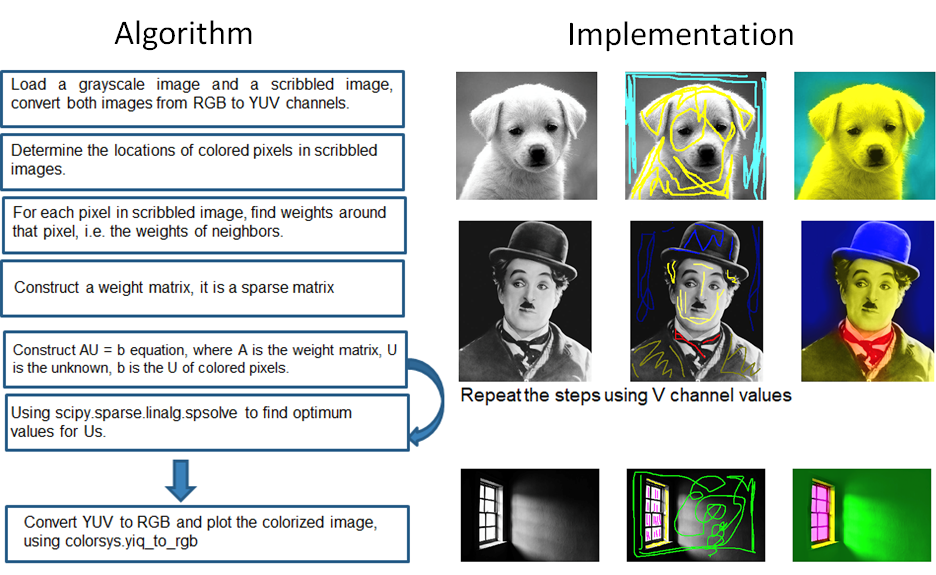
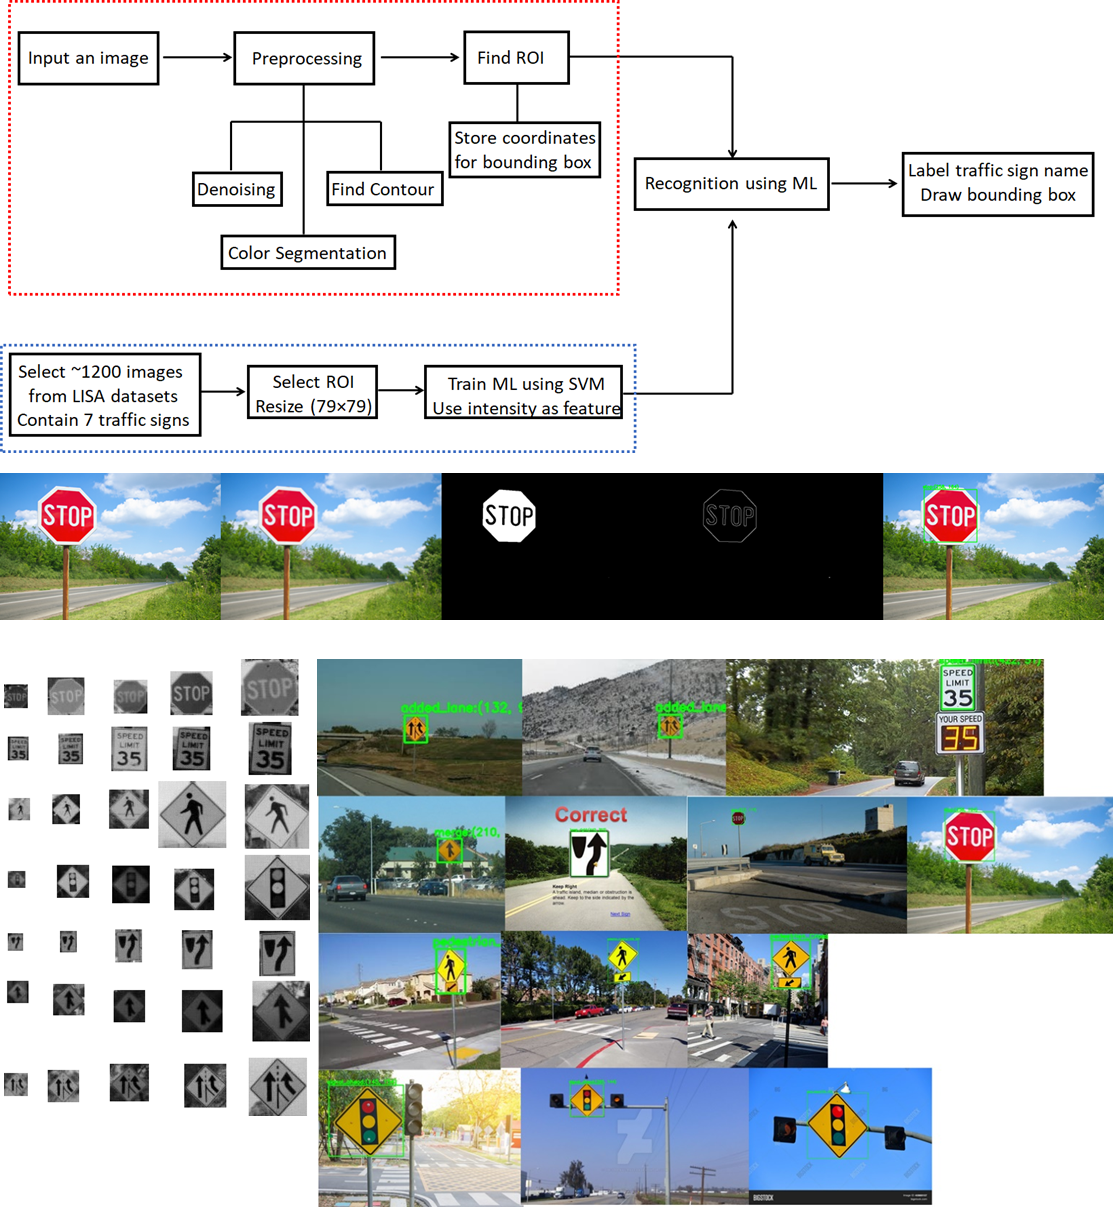
Enhanced Road Sign Detection and Recognition Using Color Segmentation and Support Vector Machine (YouTube Presentation, Link to Paper)
In this project, a pipeline has been built to detect and recognize seven road signs in real-world images (i.e. stop, added lane, signal ahead, merge, speed limit, pedestrian crossing and keep right). The detection part utilizes color segmentation and contour-finding algorithms to locate the region of the interest (ROI) while the recognition part trains on 1214 images from LISA database of these seven traffic signs using a support vector machine (SVM) algorithm.
The detailed algorithm is shown below. The miscellaneous computer vision techniques were adpoted including Gaussian blur (to remove noise), color segemenation and contour-finding to locate the traffic sign. This is illustrated using stop sign as an example shown below the algorithm diagram. The next step was to train a machine learning classifier using cropped images (~1200) of seven traffic signs of interest from LISA dataset. The database images are grayscale images taken at various angles and lighting conditions with a large distribution of sizes.
For machine learning purpose, the 1214 ROI images are resized to be of the same mean size (i.e. 79 × 79 pixels). The images are flattened to a long vector of a size 6241, which is scaled using StandardScaler() from Scikit-Learn before feeding into a Support Vector Machine classifier (clf = svm.SVC(kernel='linear', C=1)). A ten-fold cross-validation is implemented. The final SVM model together with the scaler are saved using pickle.dump(clf, open(modelname, 'wb')) which will be called later. After ten-fold cross-validation, a classification accuracy of 99.67±0.54% is achieved.
Artificial Intelligence
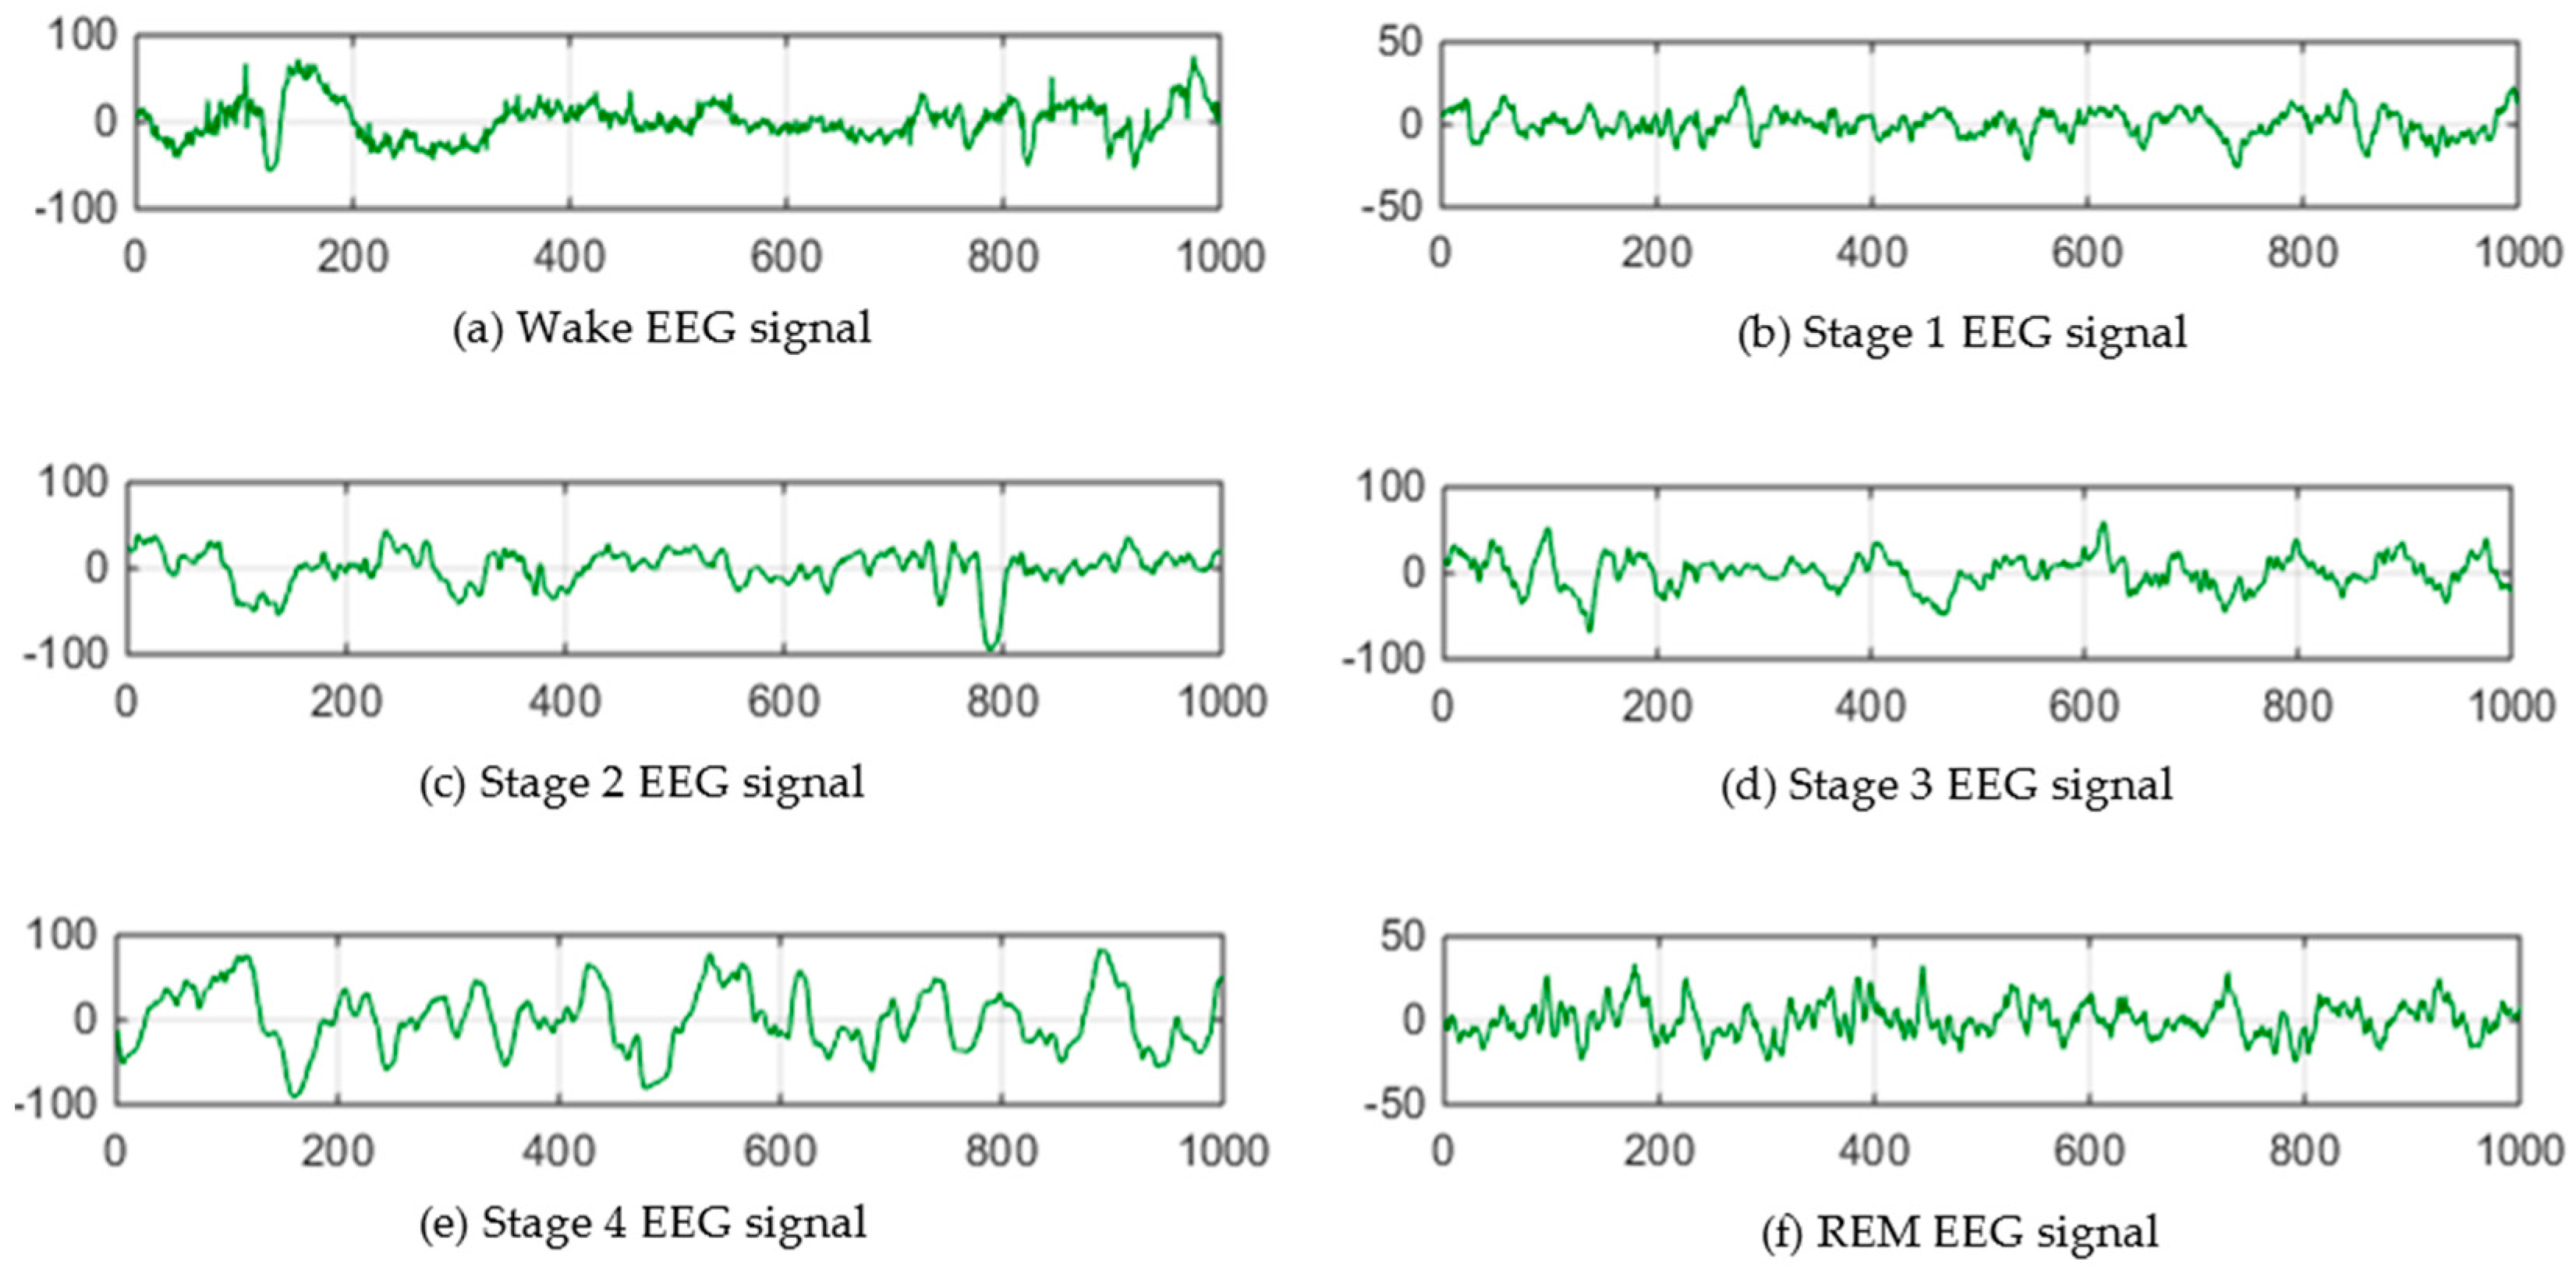
Automated Sleep Staging Annotation via Shallow and Deep Learning (YouTube Presentation, Link to Paper)
Sleep stage annotation as inferred from polysomnogram (PSG) signals is central in analyzing sleep data as it detects potential sleep disorders at an early stage. However, this task is still largely handled by an expert sleep technologist. Using open dataset of the Sleep Heart Health Study (SHHS), in this paper, we explored deploying a variety of basic machine learning and deep learning algorithms on classifying sleep stages based on raw electroencephalogram (EEG) signals (see image below. credit: Aboalayon et al., Entropy 2016, 18(9), 272). The models were trained on intra- an inter-subjects, respectively. For intra-subject study Recurrent Neural Network (RNN) achieved an overall accuracy of 87%, while for inter-subject case, the best performance came from convolutional neural network (CNN) with a classification accuracy of 78%. A further performance enhancement was attempted with an ensemble approach, where a super learner method yielded an accuracy of 80% on inter-subject study. In both cases, deep learning outperform basic machine learning by a large margin.
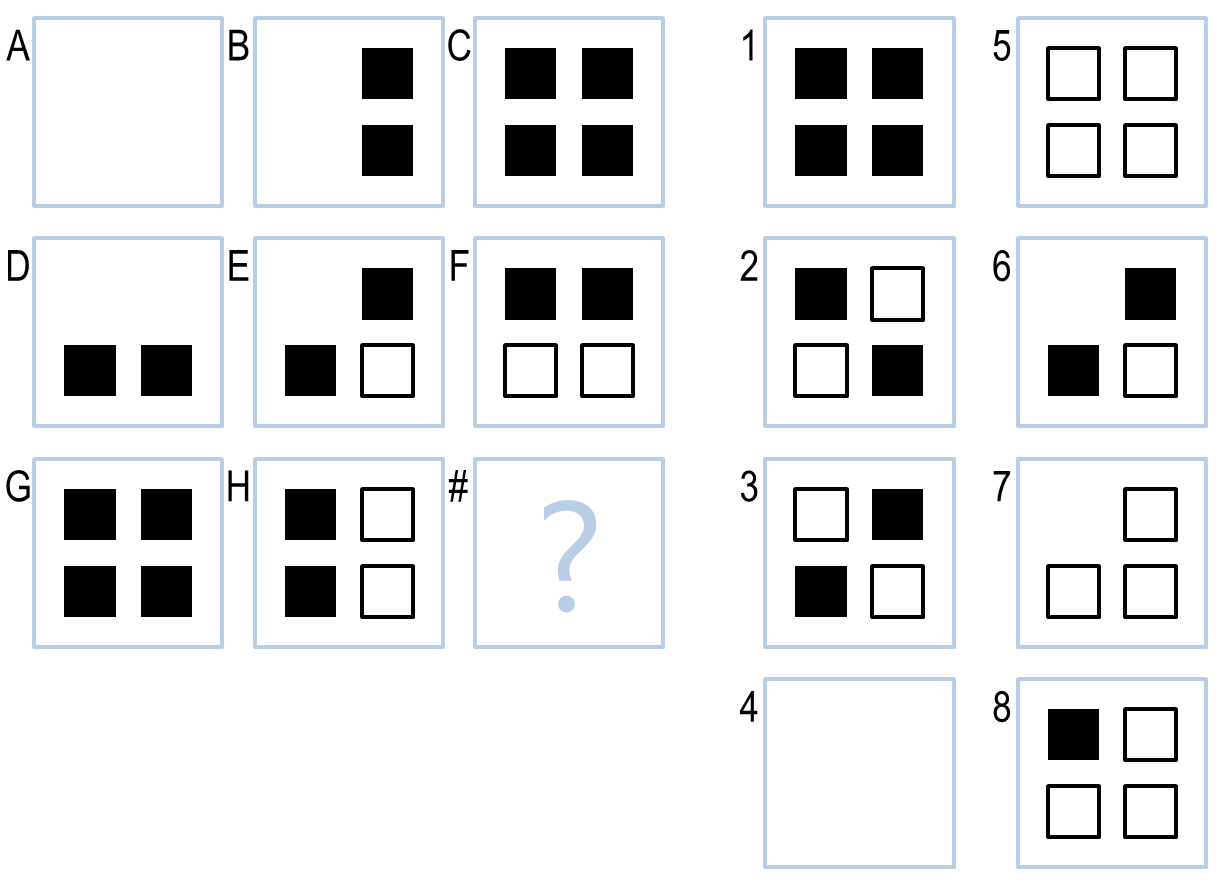
Building AI agent to solve Raven's Progressive Matrices (RPM)
This project is about the design of an AI agent capable of solving the 3×3 Raven's Progressive Matrices (RPM) problem. One example of such problem is shown below. To solve it, one needs to consider the relationship between three image pairs in each row and column (and potentially diagonally) before arriving at an answer from eight candidate images provided. For the problem shown below, the AI agent needs to figure out the bitwise operation (i.e. black & white == white and black & black == white) to select the correct answer (#5).
Clearly it is not straigthforward to apply machine learning algorithms to solve the RPM problems since there are very few training images. Instead we need a new approach, i.e. the one that captures the underlying relationships across image pairs, to attack this problem. The knowledge based AI is the chosen method here.
In terms of implementations, there could be various ways of solving it. For example, one could use Pearson Coefficient or mean squared errors to quantify the similarity/difference between a pair of images. Alternatively, one may use computer vision techniques to detect the objects in the images and record their relative sizes and locations. The method I used was based on dark pixel ratio (DPR) and intersection pixel ratio (IPR) between two images. The reasoning of choosing DPR and IPR are as follows. First of all, the contour of the objects is delineated by the dark pixels not white pixels, so one should focus on them. Second, from left to right (e.g. A>>B>>C) or from top to bottom (A>>D>>G), if the dark pixel ratio increases from one pair to the other (such as from A>>B to B>>C), it is reasonable to pick up an image X such that the dark pixel ratio increases from G>>H to H>>X and with similar magnitude. The implementation of the intersection pixel ratio shares the same logic. Overall, by using DPR/IPR, the agent can see the similarity between images which is a method natural to human.
Machine Learning for Trading
Machine learning (strategy learner) can be applied in stock trading. The key task is to decide the daily trading positions which are typically one of 1000 shares LONG, 1000 shares SHORT and DO NOTHING. In this project a random forest classifier has been trained on historical trading data to determine the proper trading activities. The technical indicators used are momentum, Bollinger Band (BB) and Moving Average Convergence Divergence (MACD) as shown in the figure below.
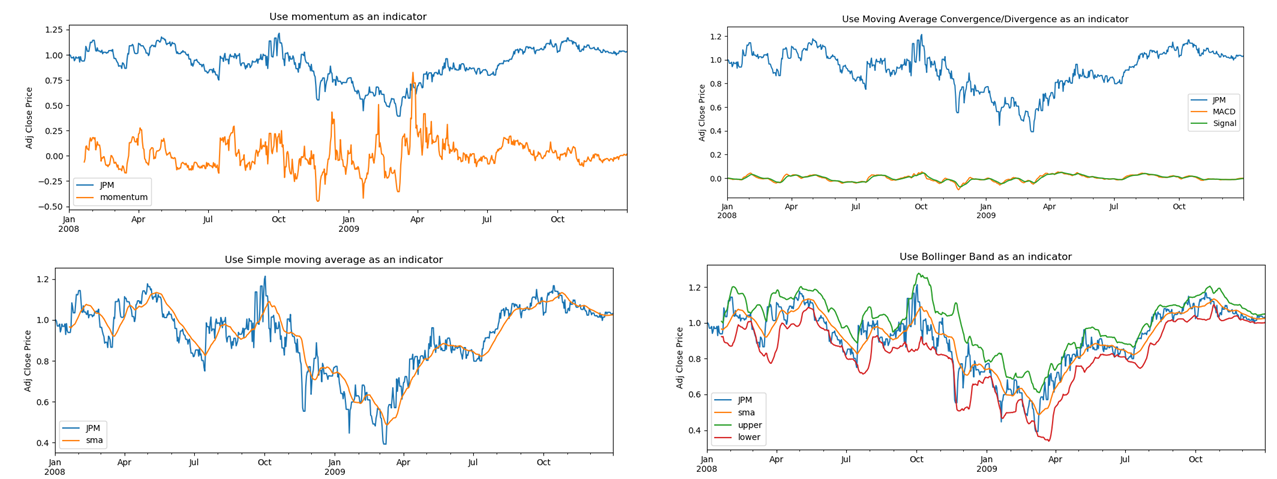
For these technical indicators, momentum measures a stock’s rate-of-change. It compares the current price with the previous price from a number of days ago. The Bollinger Band takes into account the volatility of the latest trading days. BB calculates the simple moving average (SMA) curve (for example the orange curve) and bounds it with two standard deviations of the window of prices that are used to calculate SMA. MACD is another trend indicator, which can be calculated by subtracting the 26-period exponential moving average (EMA) from the 12-period EMA.
The figure belows compares the benchmark, manual strategy and machine learning strategy. The benchmark is the performance of a portfolio starting with $100,000 cash, investing in 1000 shares of JPM and holding that position.In manual strategy, the trading positions are determined using intuition based on technical indicators. For example, to use momentum to decide a LONG, SHORT or DO NOTHING position, one may set a pair of positive and negative thresholds on momentum such that (1) if momentum is greater than the positive threshold, it gives a BUY signal (2) if momentum is smaller than the negative threshold it indicates the time to SELL. To use MACD to make a trading decision, an additional “signal” line is also plotted which is a 9-day EMA of the MACD. The decision is made based on the crossover of MACD and signal lines. If MACD goes from above the signal line to below it, it indicates SELL. The opposite case indicates BUY. To use BB to decide the trading strategy, one tracks the crossover positions where (1) the price decreases from above the upper bound value of BB to below it and (2) the price increases from below the lower bound value of BB to above it. The former situation indicates SELL while the latter BUY.
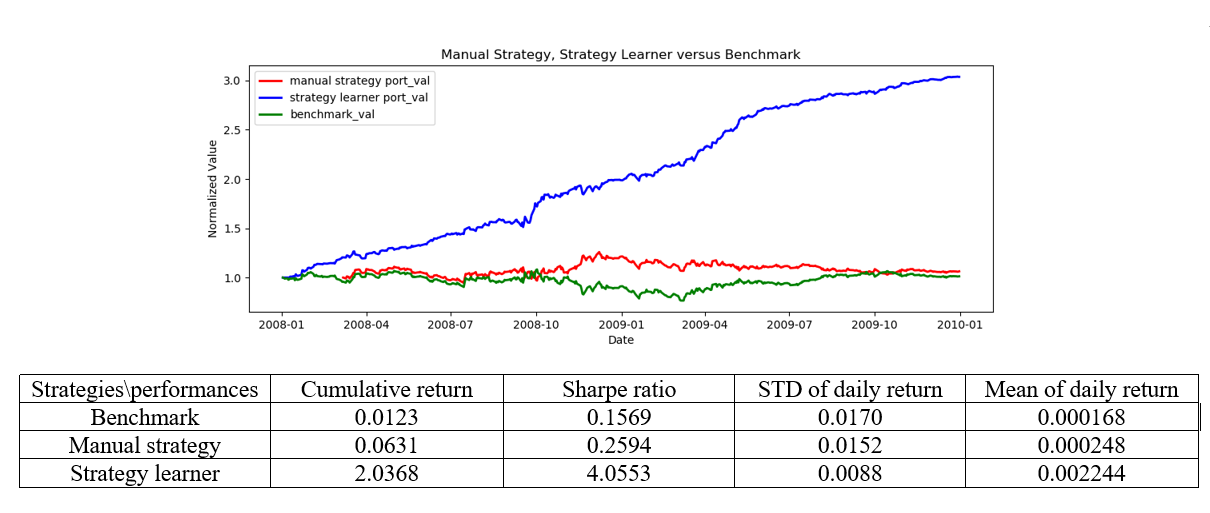
Not surprisingly, the strategy learner outperforms benchmark and manual strategy by a large margin. The strategy learner has the largest cumulative return, Sharpe ratio and mean daily return, and smallest standard deviation of daily return.
Research
- The pharmaceutical commnunity has a long tradition of compiling large datasets of physicochemical properties of drug molecules. Each major pharmaceutical company has built their own internal database for informatic study. These highly diverse and high quality datasets have made the machine learning a natural choice for finding hidden patterns which cannot be easily detected by human experts.
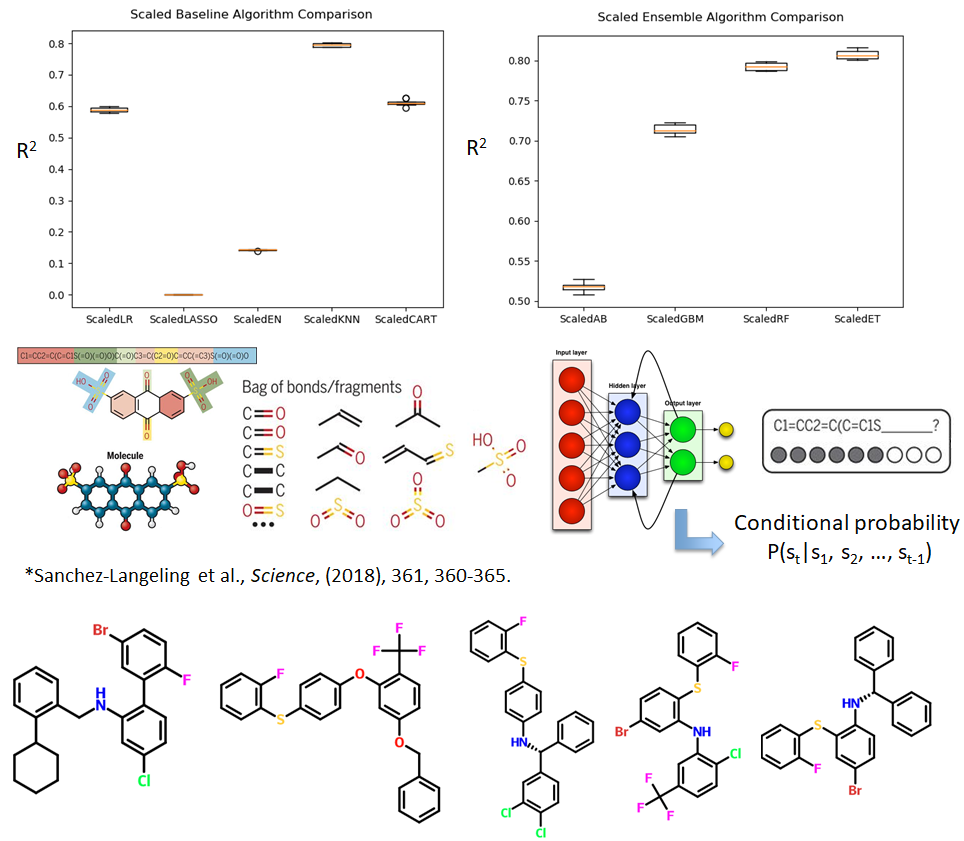
Using a partition coefficient dataset of >140,000 molecules, the machine learning is adopted to establish a Quantitative Structure Property Relationship (QSPR) model. A series of basic and more advanced learning algorithms were applied in this supervised learning problem. Among them, the deep feed forward neural network has achieved the best predictive performance with a R2 value > 0.8.
Use the same dataset and the predictive model just built, we moved on to generate the novel molecules with desired properties. These properties include a maximum value of partition coefficient, Lipinski's Rule of Five and ease for synthesis. The core techniques for molecule generation are recurrent neural network (RNN) and Monte Carlo Tree Search (MCTS) where the RNN learns the rule to form a valid molecule and the MCTS efficiently search the large chemical space. The predictive model built in the first step was used to predict the partition coefficient value of the newly generated molecules.
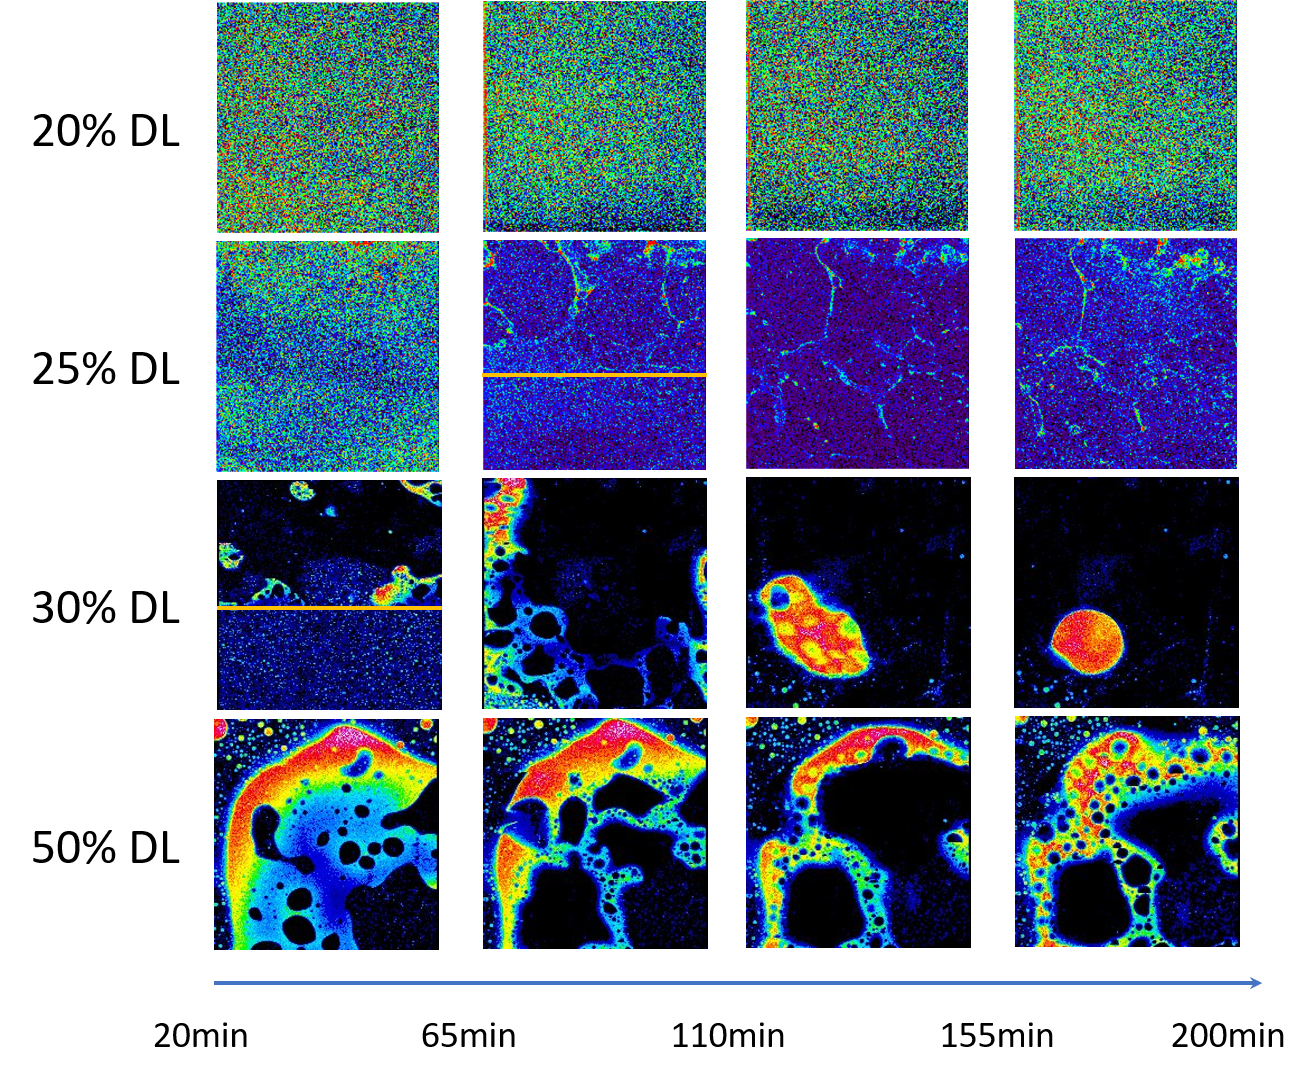
This example has demonstrated the power of machine learning in predictive and generative modeling. - Using in situ X-ray fluorescence imaging technique to determine the onset time for amorphous-amorphous phase separation (AAPS) in ritonavir-copovidone amorphous solid dispersion (ASD). This study is the first of its kind, and provides important guidance for rational formulations of ASDs, which are currently at the center of pharmaceutical research.
- Using group contribution methods to ab initio predict physical properties of drug-like small molecules. A graphical user interface software program JRgui was written that implements Joback & Reid method for property prediction.(JRgui program can be downloaded from https://github.com/curieshicy/JRgui)
- Using machine learning and deep learning algorithms to effectively predict properties of drug-like molecules through data-mining of large compiled datasets.
- Developed and released xINTERPDF (hosted at https://github.com/curieshicy/xINTERPDF): a GUI program to extract structural information from measured X-ray pair distribution function (PDF) data for organic materials
- Synchrotron X-ray total scattering data were collected on mefenamic acid precipitated from various polymer solutions including PVP, PEG and HPMC. A novel methodology was developed to access the packing disorders in organic pharmaceutical compounds
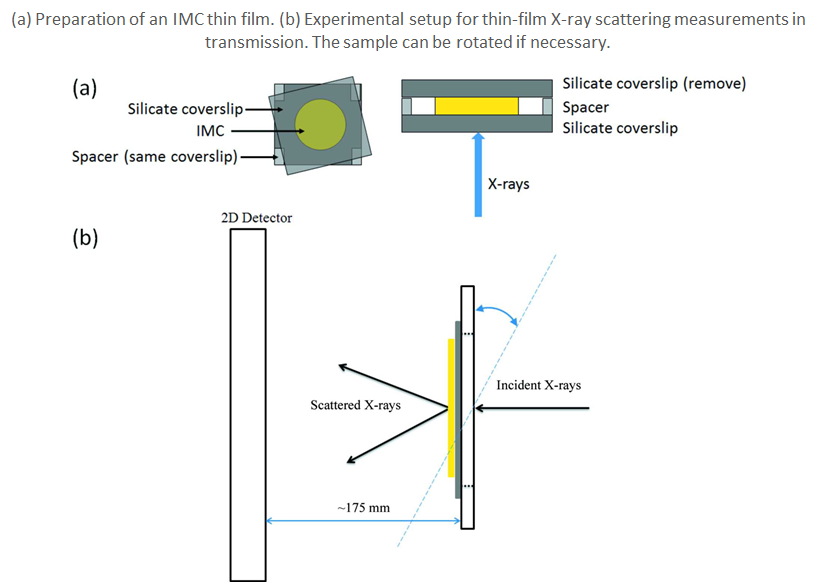
- For the first time, the robust X-ray total scattering signals in transmission mode were collected on 130 micron thick indomethacin thin film deposited on the borosilicate glass substrate of equal thickness.
- A methodology was developed to extract X-ray scattering signal for intermolecular correlation in amorphous/crystalline organic compounds.
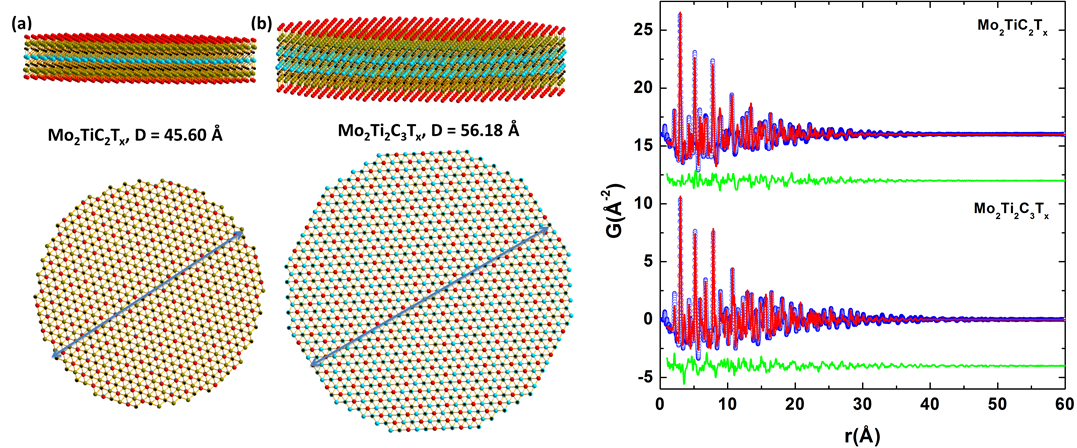
- X-ray total scattering experiment in combination with atomic pair distribution function (PDF) technique were applied to investigate the local structure of various technologically relevant nanoparticles (NPs) ranging from carbon supported platinum NPs, emerging two-dimensional Ti3C2, Nb4C3 MXene materials, zirconium based ion exchangers through Co, Ni and Mn based water splitting catalysts to ferroelectric BaTiO3 and metallic ferrite NPs.
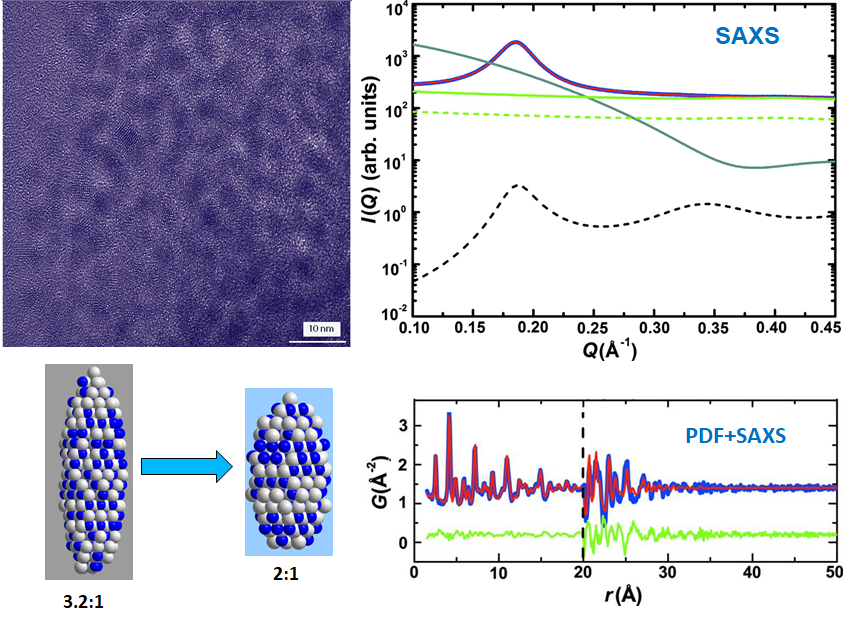
- Small angle X-ray scattering and PDF techniques were combined in a "complex modeling" to obtain robust morphological and structural parameters of CdS NPs.
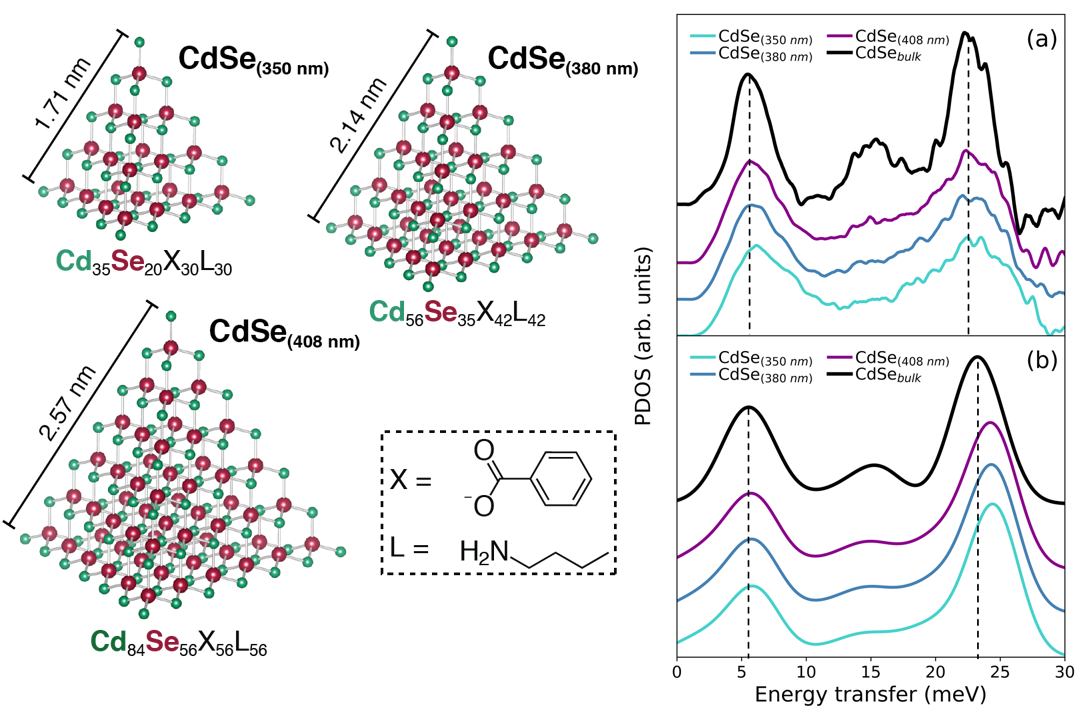
- For the first time we directly mapped out the phonon density of states of three quantized grown “magic size” CdSe nanoclusters using HERIX technique at Argonne National Laboratory. Theoretically lattice dynamics was investigated by empirical force field calculation and ab initio DFT.
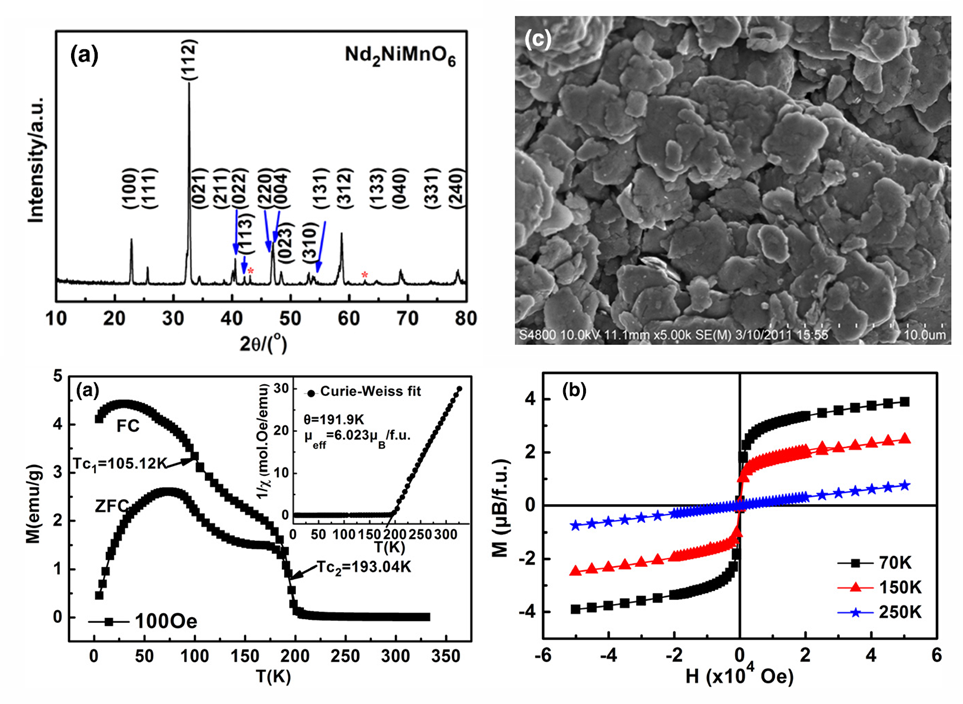
- Structural, magnetic and dielectric properties of a wide variety of functional ceramics systems were investigated including modified multiferroics BiFeO3, Ca doped La2NiO4, Nd2NiMnO6 and colossal dielectrics Ca2TiMnO6.
Harness the predictive and generative power of machine learning in novel drug design and discovery (Jan. 2019 – present)
Determination of onset of polymer-drug separation in ASDs (Jan. 2017 – present)
Prediction of aqueous solubility of drug-like molecules (Jan. 2017 – present)
Study of structures of crystalline and amorphous pharmaceuticals (Oct. 2015 – present)
Study of local structure and lattice dynamics of nanoparticles (Sep. 2011–Aug. 2015)
Structure-property correlation of functional ceramics (Sep. 2008 –Jul. 2011)
Publication(Google Scholar)
- Xin Yao, Chengbin Huang, Emily Benson, Chenyang Shi, Geoff G. Z. Zhang and Lian Yu, “Effect of polymers on crystallization in glass-forming molecular liquids: Proportional suppression of nucleation and growth and master curve for prediction”, Cryst. Growth Des. 20(1) (2020) 237-244. (Link)
- Chenyang Shi, Luxi Li, Thomas B. Borchardt and Geoff G. Z. Zhang, “Direct visualization of drug-polymer phase separation in ritonavir-copovidone amorphous solid dispersion thin film via in situ synchrotron X-ray fluorescence imaging”, Mol. Pharm. 16(11) (2019) 4751-4754. (Link) (Highlight APS)
- Chenyang Shi, Yan Li, Alexander N. Beecher, Bogdan M. Leu, Ayman Said, Michael Y. Hu, Jonathan S. Owen and Simon J. L. Billinge, “Size-dependent lattice dynamics of atomically precise cadmium selenide quantum dots”, Phys. Rev. Lett., 122 (2019) 026101. (Link) (Highlight APS)
- Casey N. Brodsky, D. Kwabena Bediako, Chenyang Shi, Thomas P. Keane, Cyrille Costentin, Simon J. L. Billinge, and Daniel G. Nocera, “Proton–electron conductivity in thin films of a cobalt–oxygen evolving catalyst”, ACS Appl. Energy Mater., 2(1) (2019) 3-12.(Link)
- Chenyang Shi, “xINTERPDF: a graphical user interface for analyzing intermolecular pair distribution functions in organic compounds from X-ray total scattering data”, J. Appl. Cryst., 51 (2018) 1498-1499.(Link)
- Chengbin Huang, Zhenxuan Chen, Yue Gui, Chenyang Shi, Geoff Zhang and Lian Yu, “Crystal nucleation rates in glass-forming molecular liquids: D-sorbitol, D-arabitol, D-xylitol, and glycerol”, J. Chem. Phys., 149 (2018) 054503. (Selected as Editor's Pick) (Link)
- Chenyang Shi, Simon J. L. Billinge, Eric Puma, Sun Hwi Bang, Nate Bean, J. C. de Sugny, Robert G. Gambee, Richard C. Haskell, Adrian Hightower and Todd C. Monson, “Barium titanate nanoparticles: short-range lattice distortions with long-range cubic order”, Phys. Rev. B, 98 (2018) 085421.(Link)
- Chenyang Shi and Thomas B. Borchardt, “JRgui: A Python program of Joback and Reid method”, ACS Omega, 2(12) (2017) 8682–8688. (Link)
- Maxwell W. Terban*, Chenyang Shi*, Rita Silbernagel, Abraham Clearfield and Simon J. L. Billinge, “The structure of layered nanocrystalline zirconium phosphonate-phosphate ion exchange materials and intercalation environment of Tb3+”, Inorg. Chem. 56(15) (2017) 8837-8846. (*co-first authors) (Link)
- Chenyang Shi, Rattavut Teerakapibal, Lian Yu, and Geoff G. Z. Zhang, “Pair distribution functions of amorphous organic thin films determined by synchrotron X-ray scattering in transmission mode”, IUCrJ, 4 (2017) 555-559. (Link)
- Babak Anasori, Chenyang Shi, Eun Ju Moon, Yu Xie, Cooper A. Voigt, Paul R. C. Kent, Steven J. May, Simon J. L. Billinge, Michel W. Barsoum and Yury Gogotsi, “Control of electronic properties of 2D carbides (MXenes) by manipulating their transition metal layers”, Nanoscale Horiz., 1 (2016) 227-234. (Selected as Journal Cover) (Link)
- Chenyang Shi, “Local structure and lattice dynamics study of low dimensional materials using atomic pair distribution function and high energy resolution inelastic x-ray scattering”, PhD Dissertation, (2015). (Link)
- Michael Huynh, Chenyang Shi, Simon J. L. Billinge and Daniel G. Nocera, “The nature of activated manganese oxide for oxygen evolution”, J. Am. Chem. Soc., 137 (2015) 14887-14904. (Link)
- Amanda L. Tiano, Georgia C. Papaefthymiou, Crystal S. Lewis, Jinkyu Han, Cheng Zhang, Qiang Li, Chenyang Shi, Milinda Abeykoon, Simon J. L. Billinge, Eric Stach, Justin Thomas, Kevin Guerrero, Pablo Munayco, Jimmy Munayco, Rosa B. Scorzelli, Philip Burnham, Arthur J. Viescas and Stanislaus S. Wong, “Correlating size and composition-dependent effects with magnetic, Mössbauer, and pair distribution function measurements in a family of catalytically active ferrite nanoparticles.” Chem. Mater., 27 (2015) 3572-3592. (Link)
- Chenyang Shi., Majid Beidaghi, Michael Naguib, Olha Mashtalir, Yury Gogotsi and Simon J. L. Billinge, “Structure of nanocrystalline Ti3C2 MXene using atomic pair distribution function.” Phys. Rev. Lett., 112 (2014) 125501. (Link)
- Michael Ghidiu, Michael Naguib, Chenyang Shi, Olha Mashtalir, L. M. Pan, B. Zhang, J. Yang, Yury Gogotsi, Simon J. L. Billinge and Michel W. Barsoum, “Synthesis and characterization of two-dimensional Nb4C3 (MXene).” Chem. Comm., 50 (2014) 9517-9520. (Link)
- Christopher L. Farrow, Chenyang Shi, Pavol Juhas, Xiaogang Peng and Simon J. L. Billinge, “Robust structure and morphology parameters for CdS nanoparticles by combining small-angle x-ray scattering and atomic pair distribution function data in a complex modeling framework.” J. Appl. Cryst., 47 (2014) 561-565. (Selected as Journal Cover) (Link)
- Mengqiang Zhu, Paul Northrup, Chenyang Shi, Simon J. L. Billinge, Donald L. Sparks and Glenn A. Waychunas, “Structure of sulfate adsorption complexes on ferrihydrite.” Environ. Sci. Technol. Lett., 1 (2014) 97-101. (Link)
- Chenyang Shi, Erin L. Redmond, Amir Mazaheripour, Pavol Juhas, Thomas F. Fuller and Simon J. L. Billinge, “Evidence for anomalous bond softening and disorder below 2 nm diameter in carbon supported platinum nanoparticles from the temperature dependent peak width of the atomic pair distribution function.” J. Phys. Chem. C, 117 (2013) 7226-7230. (Link)
- Chenyang Shi, Yongmei Hao and Zhongbo Hu, “Microstructure and colossal dielectric behavior of Ca2TiMnO6 Ceramics.” Scripta Mater., 64 (2011) 272-275. (Link)
- Chenyang Shi, Yongmei Hao and Zhongbo Hu, “Local valence and physical properties of double perovskite Nd2NiMnO6.” J. Phys. D: Appl. Phys., 44 (2011) 245405. (Link)
- Chenyang Shi, Zhongbo Hu and Yongmei Hao, “Structural, magnetic and dielectric properties of La2-xCaxNiO4+δ (x=0, 0,1, 0,2, 0,3).” J. Alloys. Compd., 509 (2011) 1333-1337. (Link)
- Chenyang Shi, Xinzhi Liu, Yongmei Hao and Zhongbo Hu, “Structural, magnetic and dielectric properties of Bi1-ySryFe(1-y)(1-x)Sc(1-y)xTiyO3 (x=0-0.2, y=0.1-0.3) ceramics.” Mater. Res. Bull.., 46 (2011) 378-383. (Link)
- Chenyang Shi, Xinzhi Liu, Yongmei Hao and Zhongbo Hu, “Structural, magnetic and dielectric properties of Sc modified (1-y)BiFeO3-yBaTiO3 ceramics.” Solid State Sci., 13 (2011) 1885-1888. (Link)
- Chenyang Shi, Zhongbo Hu and Yongmei Hao, “Structural and magnetic properties of single perovskite Ca(Ti1/2Mn1/2)O3.” J. Magn. Magn. Mater., 323 (2011) 1973-1976. (Link)
- Chenyang Shi, Yongmei Hao, Yanqing Tan and Rui Song, “The magnetic properties of Bi0.9Ba0.1Fe0.81M0.09O3 solid solutions (M=Co, Mn, Sc, Al).” Mater. Res. Bull., 46 (2011) 1848-1852. (Link)
Selected Oral and Poster Presentations
- Invited talk at 3rd Spring Pharmaceutical Synchrotron XRPD workshop, Argonne National Laboratory, Lemont, IL, May 18-20, 2020.
- Invited talk at 17th European Powder Diffraction Conference, Sibenik, Croatia, May 26-30th, 2020.
- Invited talk at 2nd International Conference on PharmScience Research and Development, Los Angeles, CA, Feb 24-26th, 2020.
- Invited talk at Center for Nanomaterials (CFN) at Brookhaven National Laboratory, March 20th, 2019.
- Invited talk at 1st Spring Pharmaceutical Synchrotron XRPD workshop, Purdue University, West Lafayette, IN, May 6-8, 2018.
- Formulation department talk at AbbVie, April, 2018, “Application of Synchrotron X-ray techniques and in silico modeling to pharmaceutical research.”
- Joint DPD, MST and PRD poster session at AbbVie, August 10th, 2017, “Applications of synchrotron X-ray techniques and in silico modeling in pharmaceutical research.” (Poster)
- American Association of Pharmaceutical Scientists (AAPS) conference, 2016, Denver. “Investigation on Molecular Packing of Pharmaceutical Compounds by Synchrotron X-ray Total Scattering Technique.” (Poster).
- Invited Talk at School of Pharmacy, University of Wisconsin at Madison, August 11th, 2016.
- Interview talk at Drug Product Development, AbbVie, September, 2015.
- Interview talk at JILA, University of Colorado at Boulder, July 15th, 2015.
- Interview talk at Chemical and Engineering Materials Division, Oak Ridge National Lab, July 1st, 2015.
- Interview talk at Materials Science and Technology Division, Oak Ridge National Lab, May 4th, 2015.
- Talk at Engineering Graduate Student Council Scholar Showcase, Columbia University, Feb. 26th, 2015.
- Nanoscience NY symposium, City University of New York, Feb. 19th, 2015. “Structure of Ti3C2 and Nb4C3 MXenes using atomic pair distribution function.” (Poster).
- NSLS/NSLS-II DOE Triennial Review, Brookhaven National Lab, Sep. 23rd, 2014 “Structure of Ti3C2 and Nb4C3 MXenes using atomic pair distribution function.” (Poster).
- Organizer of “1st Structure in the City Symposium”, Columbia University, August 18th, 2014. “Validation on lattice dynamics methodologies: Testing on bulk CdSe as an initial step.” (Oral).
- NSLS/NSLS-II and CFN Users' Meeting, Brookhaven National Lab, May 2014. “Structure of nanocrystalline Ti3C2 MXene using atomic pair distribution function.” (Poster).
- APAM research conference, Columbia University, March 2014. “Lattice dynamics study on size dependent CdSe clusters through PDF, Raman, IXS coupled with MD and DFT calculations.” (Oral).
- NSLS/NSLS-II and CFN Users' Meeting, Brookhaven National Lab, May 2013. “Extracting thermodynamic and structure-function properties of small nanoparticles from the atomic pair distribution function.” (Poster).
- American Conference on Neutron Scattering, Washington D.C. June 2012. “Size dependent Debye temperatures of platinum nanoparticles extracted from temperature dependent peak width of atomic pair distribution function.” (Poster).
- National School on Neutron and X-ray Scattering, Argonne and Oak Ridge National Lab, August 12th-15th, 2012. “Powder neutron diffractometer (POWGEN).” (Oral).