Exploration of DEC seasonal and weekday trend
Since Zev's model incorperate seasonal, weekday and hour temporal adjustment, we want to explore such temporal trend in DEC data as a reference.
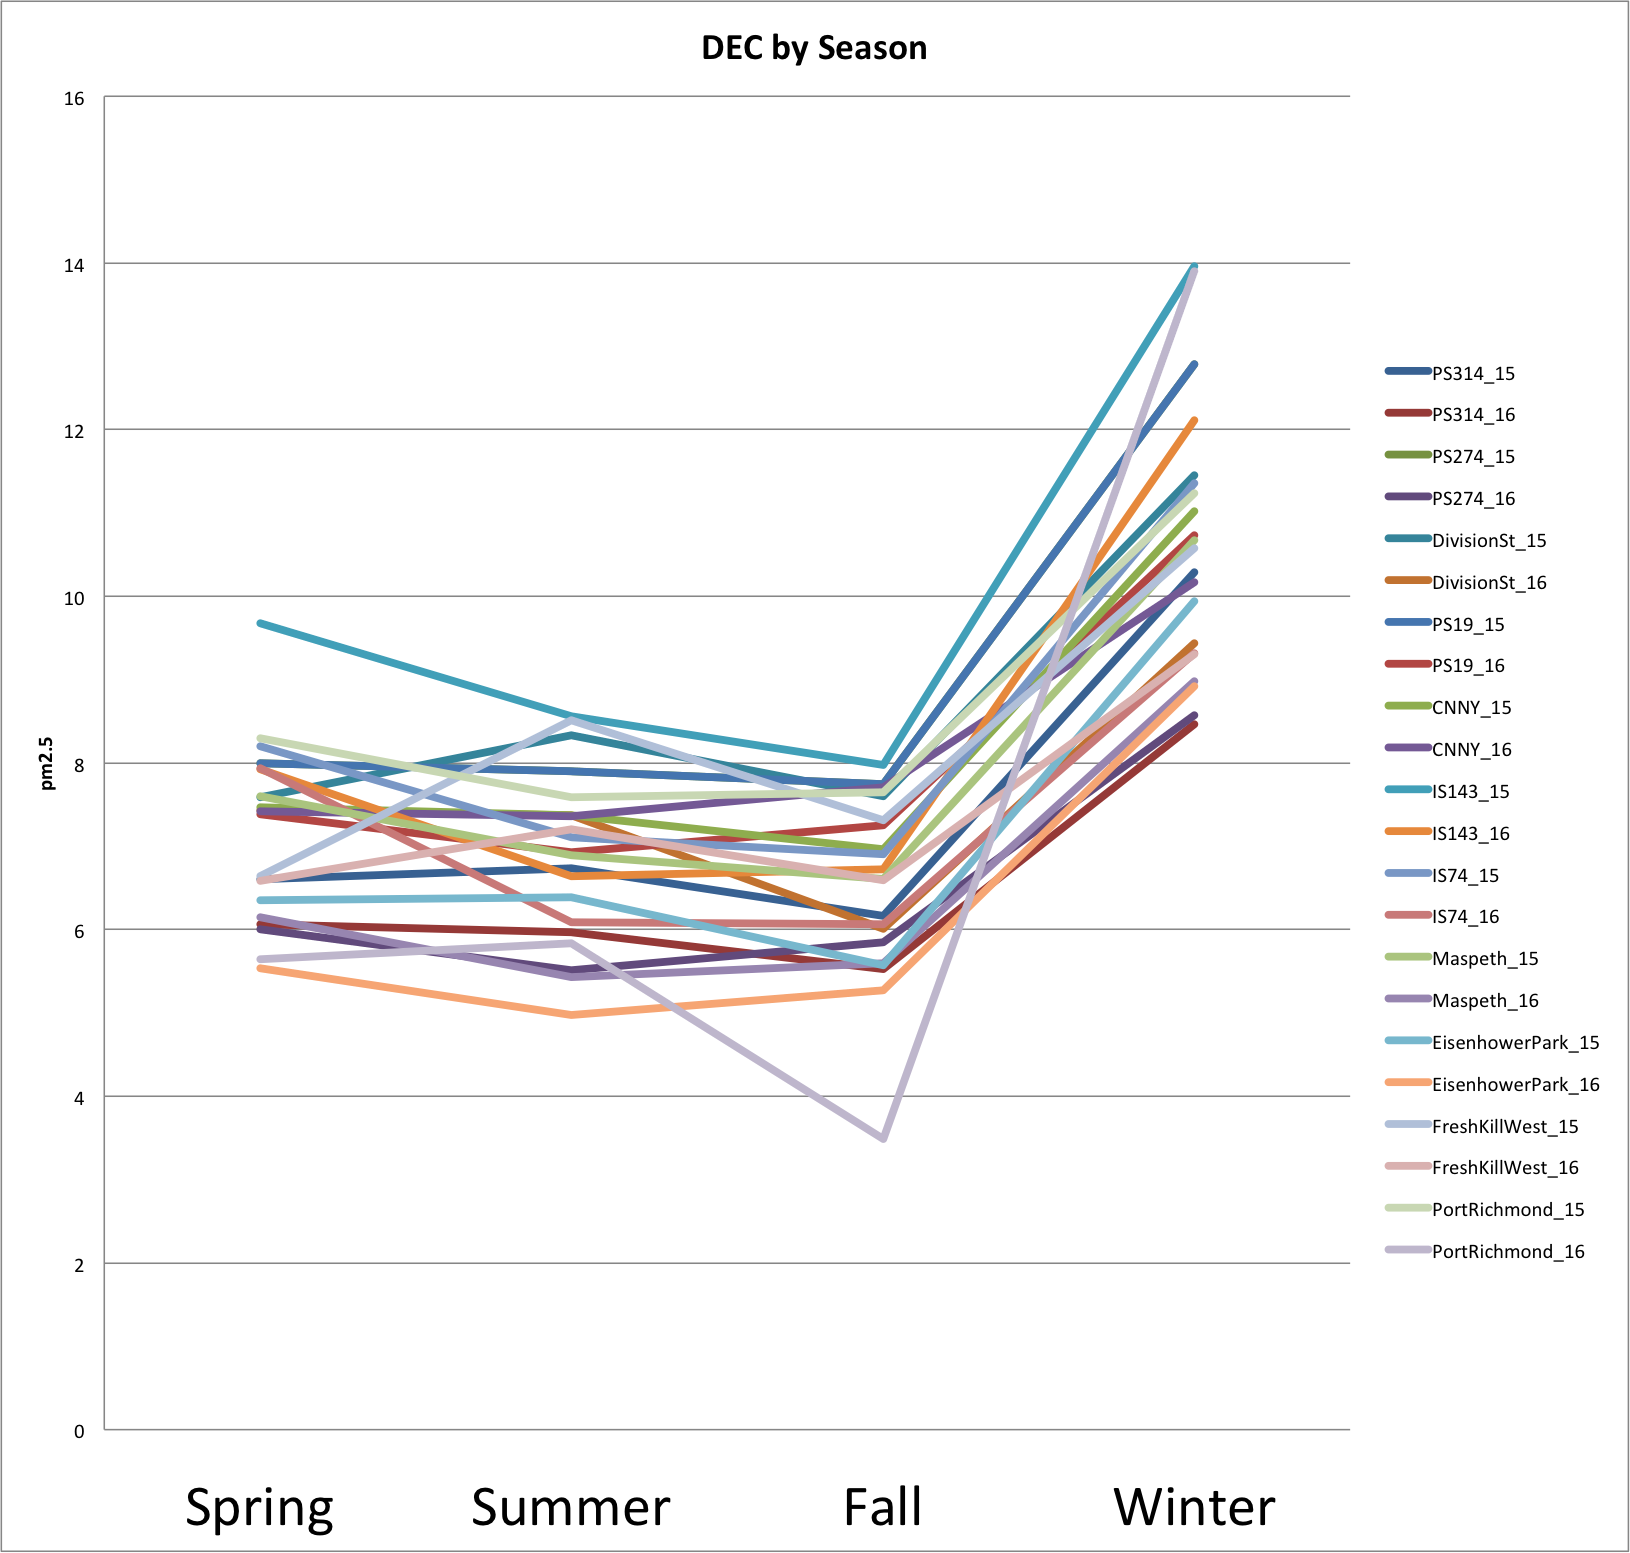
Seasonal
Click here for the spreadsheet of seasonal statistics in year 2015 and 2016
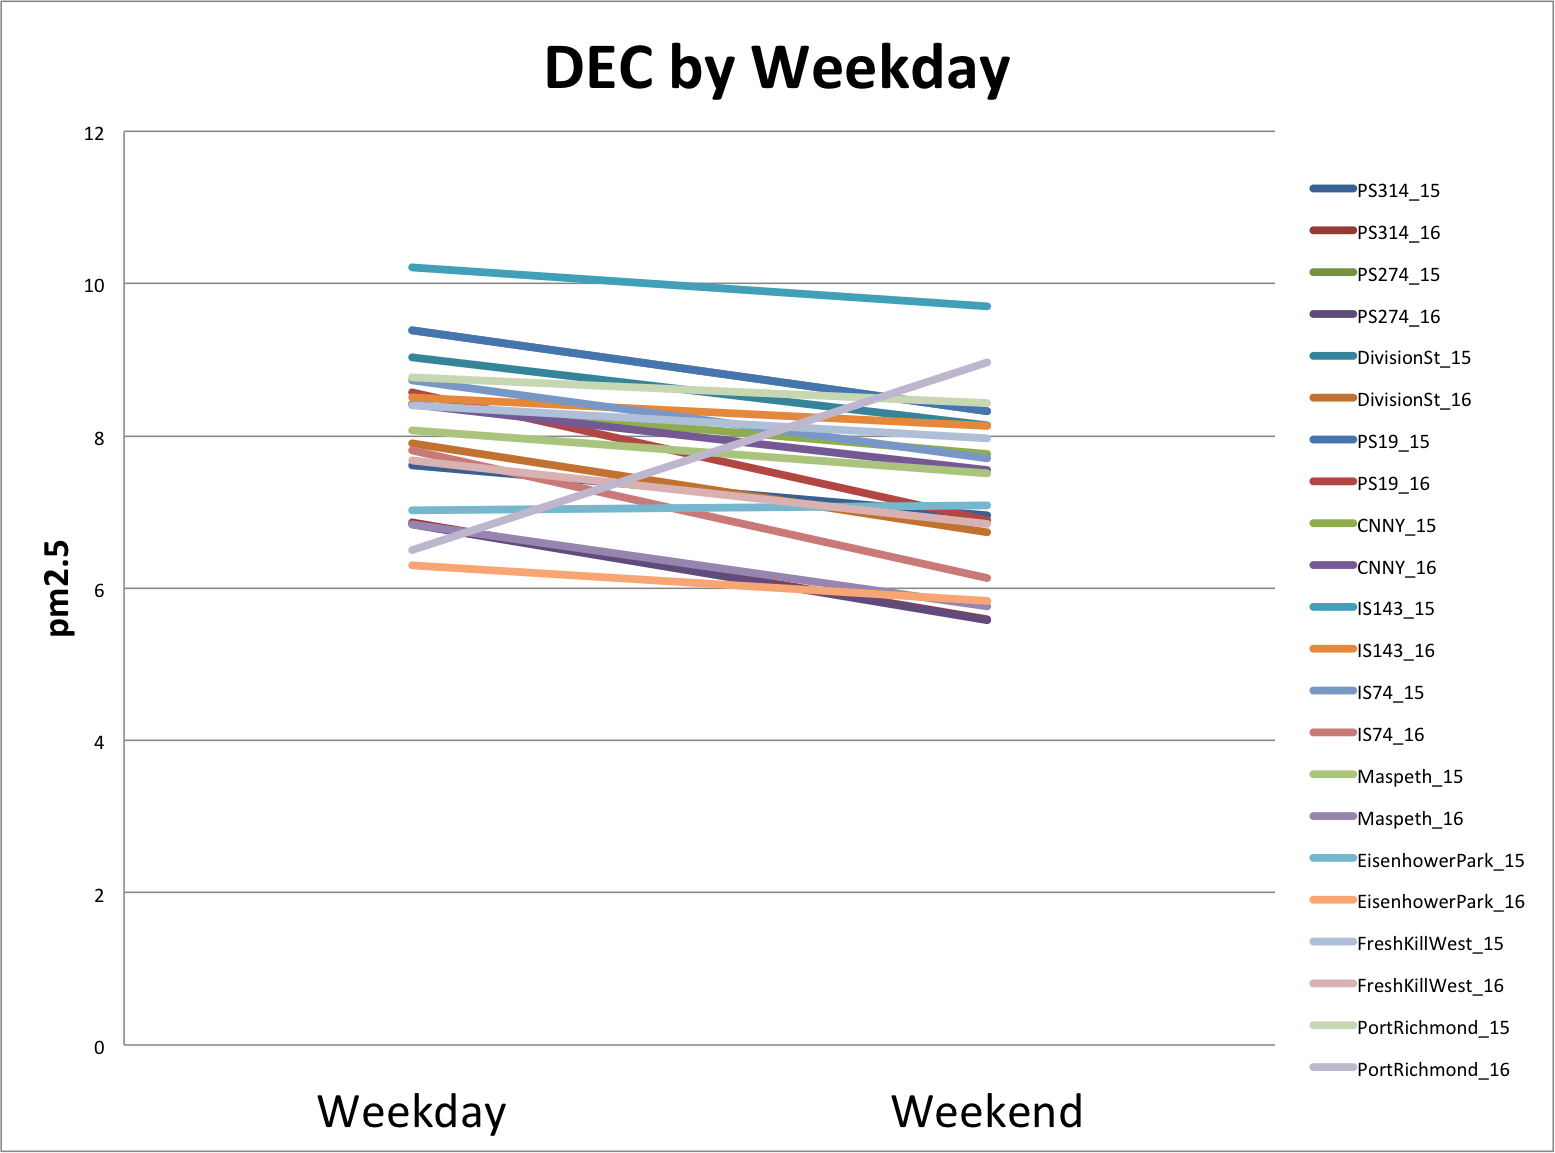
Weekday
Click here for the spreadsheet of weekday statistics in year 2015 and 2016
Model Comparison between Zev's model and our biking data
We merged the GPS file with the lattice in Zev's model, so that we can calculate the corresponding pm2.5 value using Zev's model
Spatial Distribution of Biking data
Spatial Distribution of Zev's model
Correlation of Biking model and Zev's model
Summer
Fall
Possible reasons of low correlation
- The pm2.5 range in biking data is much wider than that of Zev's model
- pm2.5 predicted by Zev's model are all under 30
- The max of biking pm2.5 is over 700
- Outliers in biking data due to possible inaccuracy of measurement (BIKE 0020 BIKE 0016)
- Seasonal and hour limitation of biking data
- All biking data are in fall and summer
- No biking data are obtained at night (10 pm to 4 am)
- Resolution difference between two models
- GPS data is measured every second, but pm2.5 is measured every minute
- Zev's model regard the pm2.5 value of every instance in a 100 * 100 lattice the same given same season, weekday and hour