Electoral Security Project
OUTLIER DETECTION
___________________________________________
2004 Election Outcome
We have run our algorithm on the data from 2004. Broadscale
multi-county multi-state
statistical anomalies above rates of previous elections addressable by
our algorithm were not detected.
On the other hand, open questions remain about manipulations directed
at specific counties
in specific states. Two plots for Florida below illustrate these
questions.
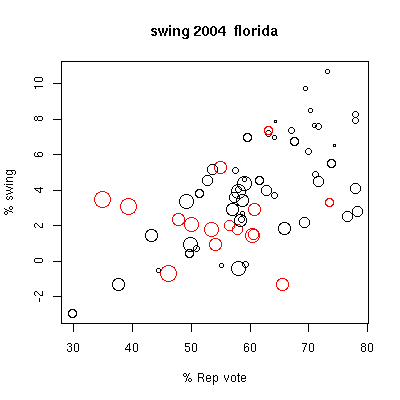
In the first figure, we plot for each county the change in percentage
Republican presidential vote
from 2004 compared with 2000, the "swing", against the percentage
Republican vote in 2004
(counting only democratic and republican votes in each election).
The symbols are
size coded for total county vote (symbol size ~ log10(vote) ), and
color coded for
voting technology: red for electronic voting, black for optical
scan precinct based.
A somewhat surprising positive swing, more Republican leaning vote, is
seen in the
large most democratic-leaning electronic-voting counties (Broward and
Palm Beach).
The statistical sample is too small to make any statements, but this
does warrant further investigation.
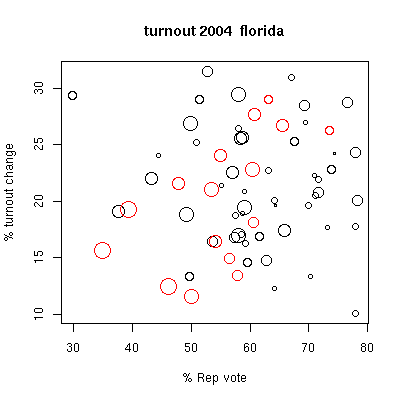
The second figure, with symbols coded the same as in the first plot,
show percent change in turnout
from 2004 cmpared with 2000, again versus Republican voting
percentage. We see a downward
trend in turnout with democratic leaning in the electronic-voting
red circles, a trend not seen
with the black optical scan circles. Again, small statistical
samples preclude making any
strong conclusions. These anomalies do, however, suggest
more thorough investigations be made.
At this point, more sophisticated and information intensive analysis of
the results are needed, something which
goes beyond the scope of our work. Please see other sites
concerned with these issues for further information.
Other Websites concerned with election monitoring, outlier
detection, and voting technology:
http://elections.fas.harvard.edu
http://www.verifiedvoting.org
_____________________________________________________________________________
PRE-ELECTION BACKGROUND:
Introduction
What is Electoral Security?
We are concerned with electoral security- how protected is our
electoral process from manipulation?
Our elections reflect our
democracy in action.
Any possibility that they will be undermined
threatens our society and its values at its very core.
Yet have we
done enough to make our electoral process secure? The answer is,
no!
What Can Be Done?
A number of analysts with different political party affiliations
have raised concern about
the integrity and security or our
electoral process. The potential vulnerability of our electoral
process
is such that even external actors could potentially
interfere in the outcome of our election.
This is intolerable and a
profound threat to our democracy.
This concern has deepened
with the use of electronic voting machines
which may be particularly prone to external manipulation.
In light
of this threat a group of concerned scholars
have developed a series of statistical methods
for
detecting possible anomalies on election night.
These methods would
then allow us to pinpoint which counties require further
investigation
into reasons for the irregularity.
Our group here at Columbia University has developed a
method
based on looking at changes in voting patterns on a
county by county basis over time.
The variable we track is the fraction
of Republican votes over the total number of votes
for Democrats
and Republicans (We could have just as easily used Democratic
votes-this is an arbitrary choice).
Past election data reveal a pattern of changes in this variable over
time, a kind of electoral
signature for each county.
This change is then compared to the voting patterns of
a set of counties with similar electoral signatures.
This allows us
to see whether changes in any specific county are
anomalous relative to others.
We have developed a program that allows for easy detection and visual
representation
of potentially anomalous voting by county in a state.
Our hope is that this will help us pinpoint
potential cases where
the integrity of our electoral system may be at risk.
It should be stressed that this program does not verify whether any
irregularity
has actually taken place.
Instead it merely gives a fast way to
detect where attention needs to be focused.
**Not
all
types of manipulation are detectable with this algorithm, and a lack of
a signal does not indicate a lack of any
problem!**
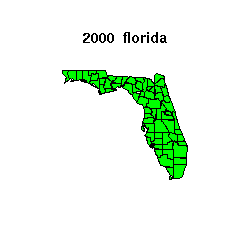
An example of this kind of methodology, applied to the past three
elections in a state, Florida is this case, is shown below.
Further explanation of what is plotted, and the
algorithm which goes into the plot, can be found below.
The plot below shows Florida for the 1992, 1996 and 2000
elections.
On election night, we will make a similar plot for 2004 for this and
other states as the election results are reported.
What is plotted?
For each election we measure the difference in the fraction of
Republican vote
in each county relative to a prediction of a matching county
set,
where the matching county set is chosen from counties which have behaved
similarly in previous elections (the database used here goes back to
1968).
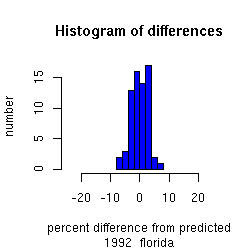
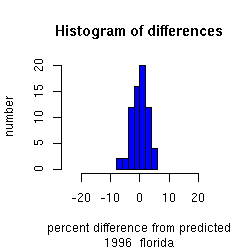
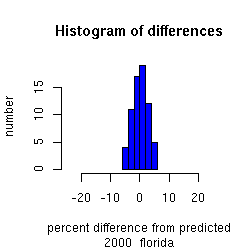
We plot a histogram of the distribution of these differences in the
bottom panel,
and a map of
the state in the top panel color-coded by
the anomaly, the absolue value of the differences.
In the map,
less than 6% anomaly is colored green,
between 6% and 9% anomaly is colored dark green,
between 9% and 12% anomaly is colored yellow,
above 12% anomaly is colored red;
if there is missing data for a county in a state, it is colored grey.
Note that on this color scale, the bright colors are rare. We
have chosen
the colors such that in the historical record they are rarely triggered.
The intervals in the distribution represent standard deviations,
with a national average of approximately 3% standard deviation.
A map unprecedented in it brightness would indicate an outlier relative
to the historical previous elections, and be cause for further
investigation.
Other states:
Link to
other states
Contact Information:
http://www.columbia.edu/~jk2002
How the analysis works
The best approach for checking the accuracy of electoral results is to
use a variety of
methodologies. The Electoral Security Project involves a
consortium of researchers looking
from a variety of points of view at the results. Here, we present
results from one particular
algorithm, which can detect some types of manipulation. Not all
types of manipulation
are detectable, and a lack of a signal
does not indicate a lack of a
problem. A detection of
a signal, on the other hand, does raise the warning flag to look in
further more specific detail.
Technical Aspects
The particular algorithm used here by our group at Columbia University
involves looking at changes in votes from one election to the next at
the county level.
The measure is the fraction of the Republican vote relative to the
Republican plus Democratic vote
(this is a more stable measure to elections when there were larger
shares for third parties).
These changes are compared against the changes in other counties in a
state.
Counties which have behaved similarly in the past to a given county
are found from
historical data, and grouped as a matching set for each county.
The results from a given election
of the matching set for each county is used to predict the expected
change in vote for each county
for that same election, and the difference between the reported
vote and this predicted vote
is then tabulated for each county.
This gives a distribution of differences for each county in a state
between predicted and reported results.
Past elections are analyzed with the same algorithm to give a baseline
distribution to compare against.
Increases significantly above this baseline variability would be cause
for further detailed examination
by other means.
The fraction of the two-party measure we use is particularly sensitive
to 'flipping' a vote
from one party to another, a method of cheating which preserves the
total number of votes cast.
A different algorithm a group in our consortium is running is sensitive
to nullifying a vote,
an operation this algorithm would not pick up. This points to the
virtue of running many
different algorithms. It also points out that passing this
particular test does not mean that
other forms of cheating, or cheating below our detection threshold,
have not occurred.
We are setting the algorithms and all parameters used before the
election, so that the results are indeed
a legitimate prediction, rather than postdiction. The exact
algorithm and parameters will be distributed
before the election to independent parties to formalize the prediction
aspect of this analysis.
This does not imply other analysis made afterward in a retrospective
fashion do not have
validity. It instead emphasizes the statistical forecasting
nature of the analysis:
the results are not 'tuned' to the current election in any way in this
predictive mode.
We have set our algorithm to use easily available data so that it can
run election night.
This has the advantage of allowing rapid response. Other
algorithms using more
detailed data are being used by other groups in the consortium.
They have the advantage
of being more able to accommodate mitigating factors which might
explain anomalies.
We have intentionally devised an algorithm which is simple and easy to
follow,
and neglected many adjustments which could be made, in order to keep it
simple
and not needing additional information. If outiers are detected
with this algorithm,
additional more sophisticated analysis and studies which take into
account other pertinent
information should then be applied.
One important aspect of our algorithm is that we have the ability to
look at distributions of
anomalies taking into account different technologies and different
machines. This enables a
technology, manufacturer, and machine specific check on the
results. Given the inherent
vulnerabilities in the computer software involved in the machines, this
is a key area
we will examine.
We have run our algorithm on presidential election results from
1968-2000.
Results for the same analysis we will be using on the 2004 data are
shown
for the 2000, 1996, and 1992 elections in the example shown above.
(The use of historical data to construct the matching set limits how
far back we
can go in analyzing past elections before we run in to the earliest
election
in 1968 in our dataset. Each analysis uses the same number of
prior
elections, so a constant number are used and any prior ones not needed
ignored).
Other Websites concerned with election monitoring, outlier
detection, and voting technology:
http://elections.fas.harvard.edu
http://www.verifiedvoting.org
Contact Information: