Sample Work
Data Visualization and Analysis Samples
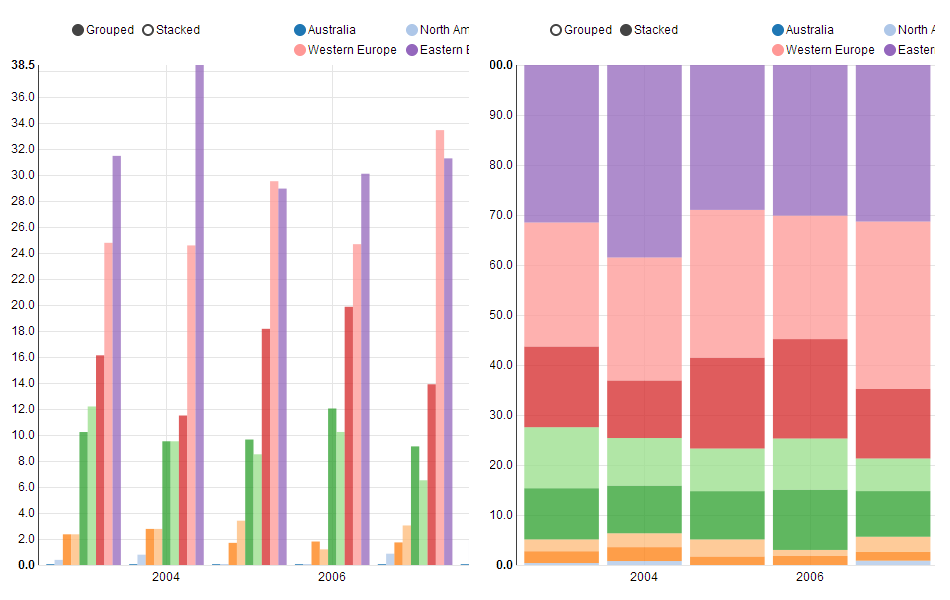
US Open Men's Tennis data from 2003 to 2013 customizable by continent/region or type of graph. |
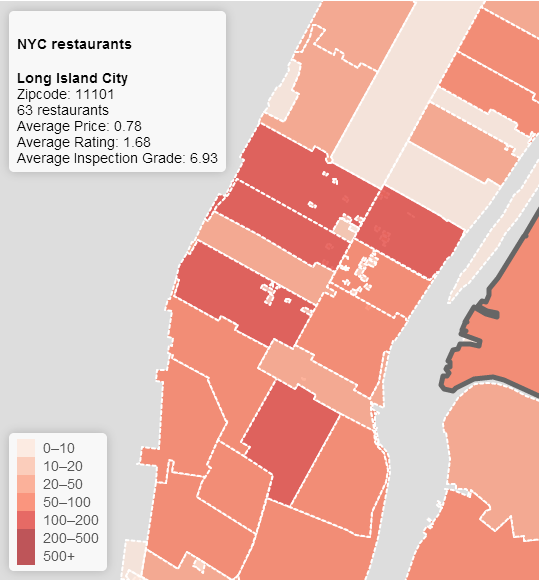
New York City Restaurant Map that is customizable by cuisine type. Provides average price, rating (yelp.com API) and inspection grade (NYC Open Data) information by zipcode area. |
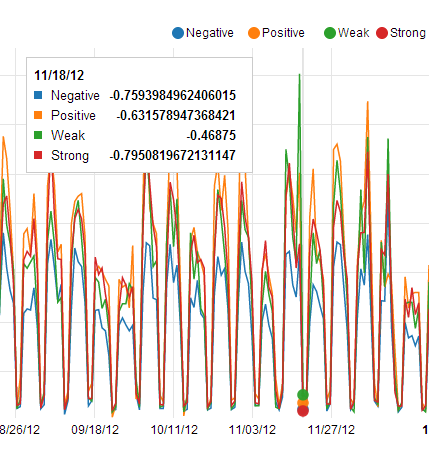
Presidential reelection year news release lexicon based sentiment analysis on positive, negative, strong and weak words. |
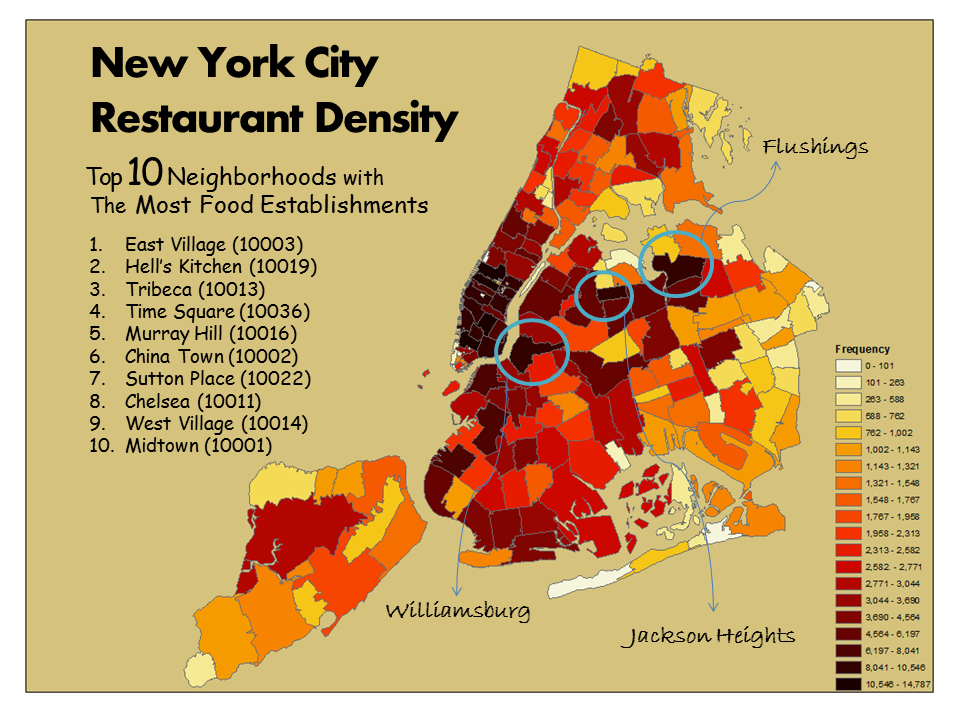
New York City Restaurant density map created in ArcGIS by merging zip code area shape file with restaruant data in R |
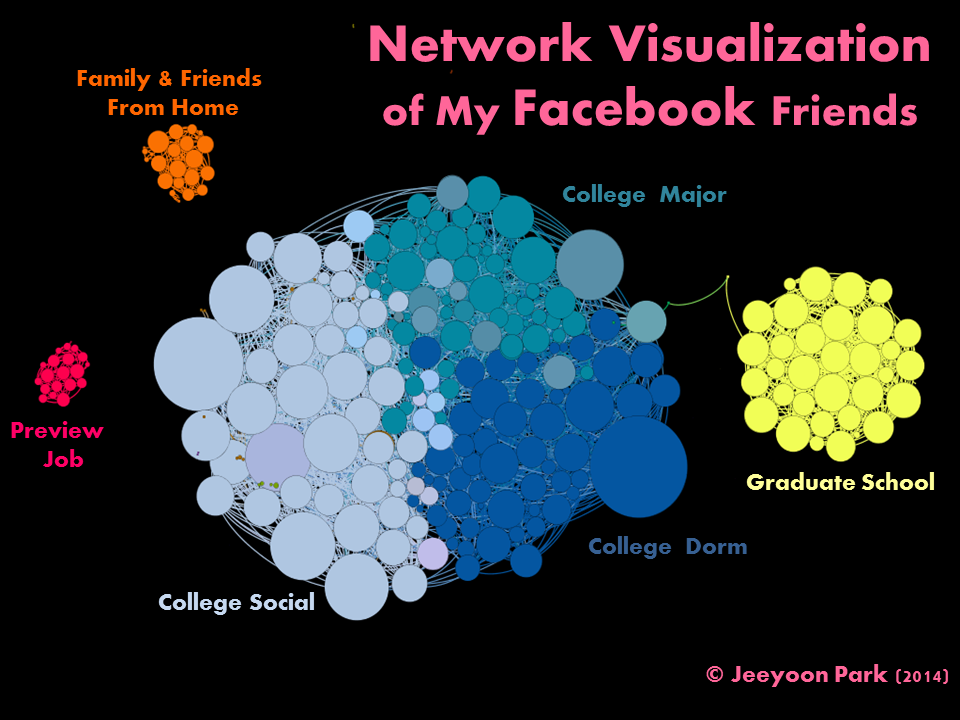
A vizualization of my facebook friends network using facebook API, R and Gephi. Node sizes are based on degree centrality and grouped by modularity |
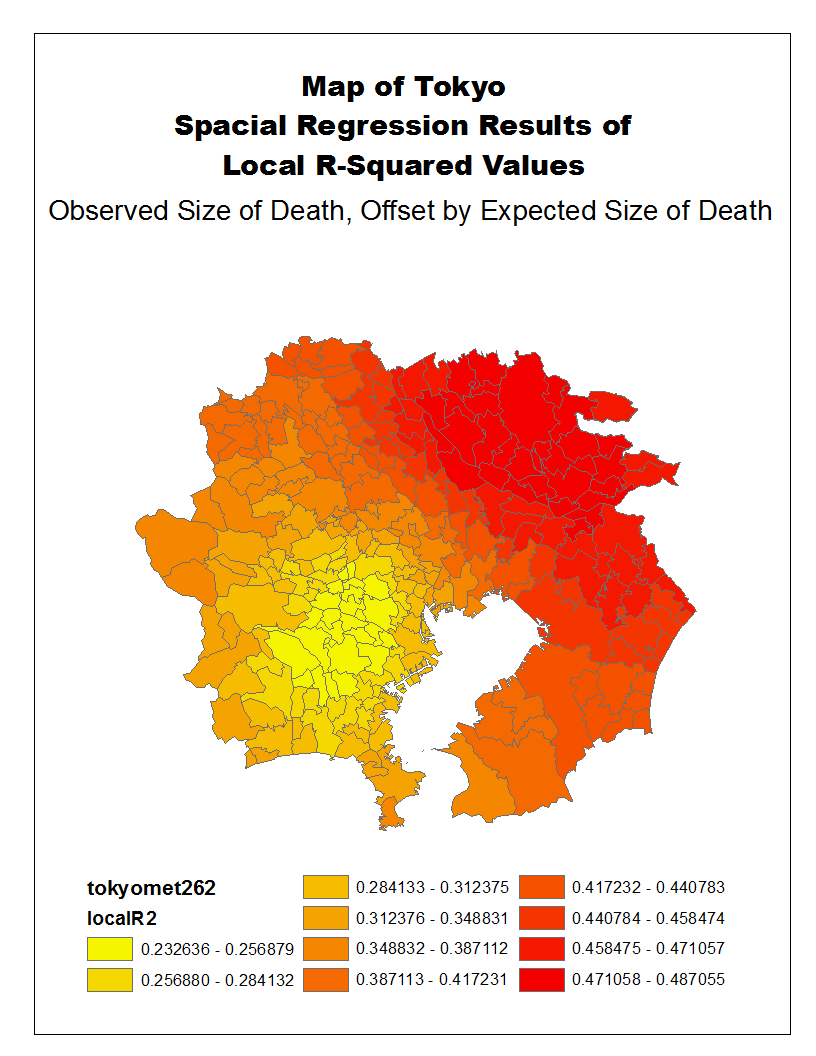
Spatial regression analysis of sample Tokyo mortality data using GWR and ArcGIS |
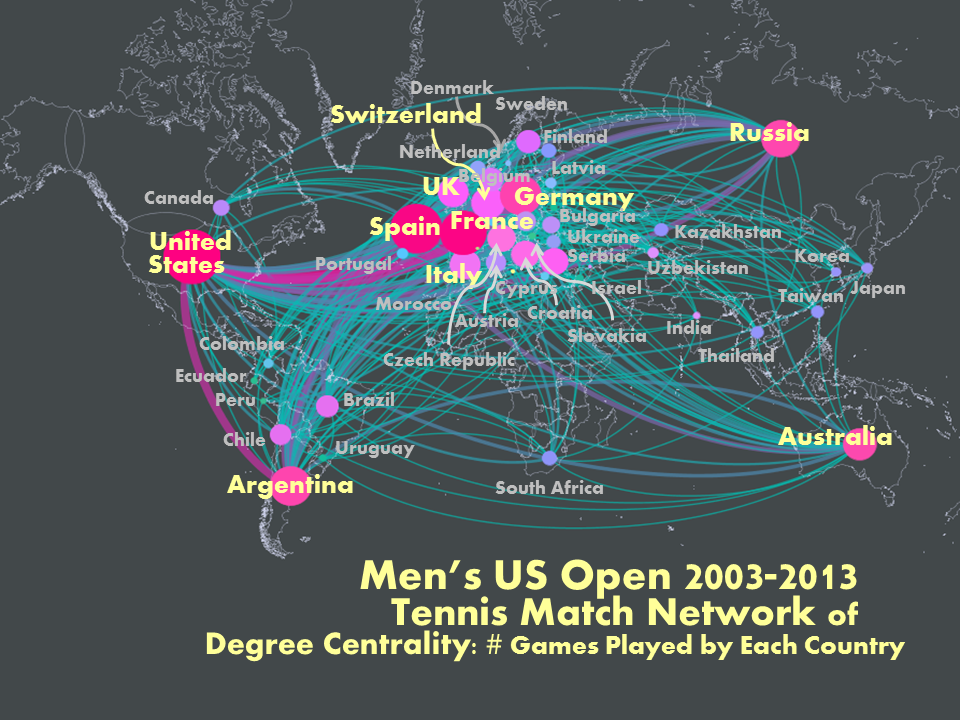
Network visualization of men's tennis matches at the US open between 2003 and 2013 using igraph package in R and world map plugin in Gephi. Node size is based on degree centrality calculated by number of games played by country |
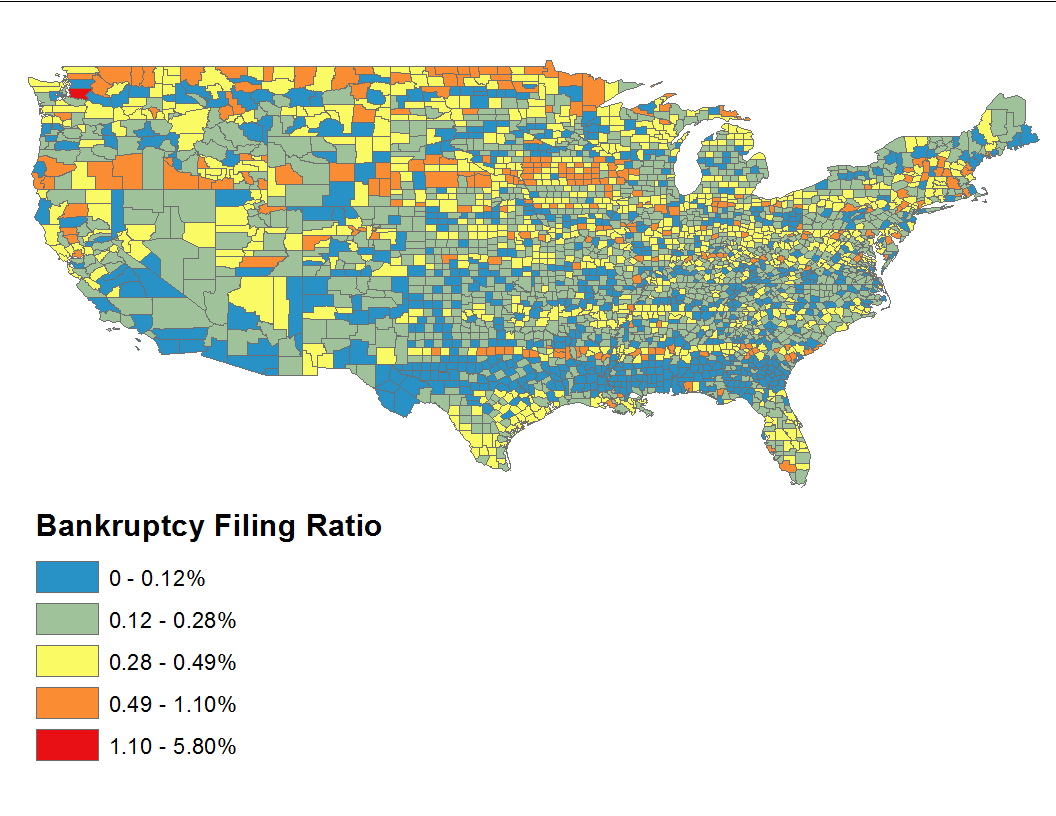
Visualization of 2013 business and consumer bankruptcy filing rates calculated from population size at the county level. |
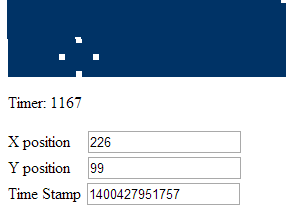
A program that outputs mouse coordinates and time stamp during the first 15 seconds of user interatcion for mock advertisement behavior measurement. |