2.1 RHEOLOGY OF THE CIRCULATION
The pressure generated by cardiac contractions serves to provide the energy for blood flow. Since the vessels of the cardiovascular system are composed of distensable walls, pressure variations are also related to volume changes. Therefore, it is useful to review some of the basic principles in rheology, which is the science of the study of flow and deformation of matters. ĀThese principles will then be applied to the analysis of pressure-flow and pressure-volume relations in the circulatory system. Memorizing the formulas associated with these principles is not necessary but understanding the relationship between the variables will help to gain grasp of the behavior of the blood in the circulatory system.
A. HEMODYNAMIC RELATIONSHIP BETWEEN PRESSURE AND FLOW: RESISTANCE
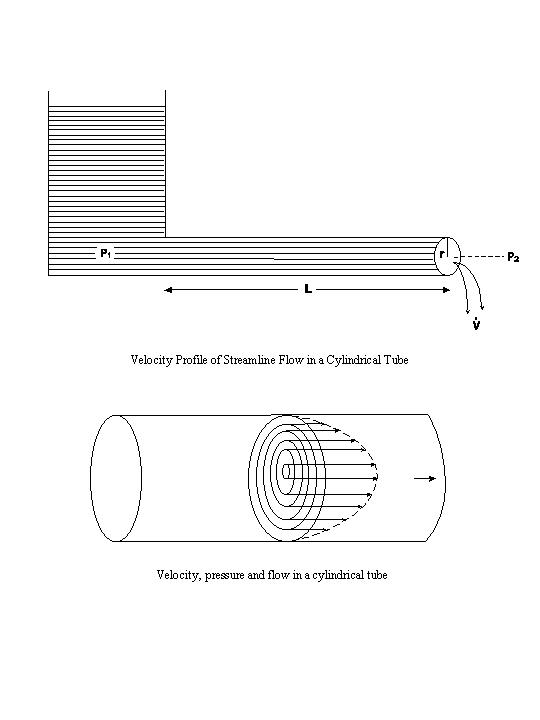
If a cylindrical tube is attached to a water reservoir having a pressure P1,
and the pressure at the other, open end of the tube is P2, then the pressure difference,
(P1-P2), will cause water to flow out of the tube opening (see above
diagrams). In a streamline flow, the fluid can be visualized as a concentric series of
infinitely thin cylindrical laminae slipping over one another with a velocity profile shown above.
The fluid is essentially stationary at the wall of the tube, and its velocity increases progressively
in a parabolic fashion to attain the maximum velocity in the center of the tube. In such streamline
flows, the pressure needed to overcome the friction between the adjacent fluid laminae is
distributed along the tube. The degree of ease with which the laminae slip over one another is a
function of the fluidity of the liquid. The reciprocal of fluidity is the viscosity (η). At a
given pressure difference and tube geometry, the rate of the streamline flow varies inversely with η.
If the pressure difference and the fluid viscosity are kept constant but the tube geometry is changed,
then the rate of flow ( ) will vary inversely with the length (L) of the tube, and
will vary directly with the internal radius (r) of the tube raised to the fourth power. This fourth
power effect indicates the strong influence of tube radius on flow. The relationships between the flow
rate, pressure difference, tube geometry, and fluid viscosity are combined in the Poiseuille-Hagen law for
streamline flow:
) will vary inversely with the length (L) of the tube, and
will vary directly with the internal radius (r) of the tube raised to the fourth power. This fourth
power effect indicates the strong influence of tube radius on flow. The relationships between the flow
rate, pressure difference, tube geometry, and fluid viscosity are combined in the Poiseuille-Hagen law for
streamline flow:
| = (P1-P2) π r4 / 8Lη |
(1) |
The pressure-flow ratio is often express as a resistance (R) to flow.
| R = (P1-P2) / |
(2) |
This equation can also be written in either of the following forms:
| = (P1-P2) / R |
(3) |
| P1-P2 = R |
(4) |
| R = Rv = 8Lη / π r4 | (5) |
For N tubes arranged in parallel,
| R = Rv = 8Lη / Nπ r4 | (6) |
The Poiseuille-Hagen law was derived for steady streamline flow in straight, rigid tubes for fluids that have a viscosity independent of the rate of flow. In the circulatory system, however, blood flow is pulsatile, the blood vessels curve, taper and branch, the vessel wall is distensible, and the viscosity of blood varies inversely with the rate of flow. Therefore, the Poiseuille-Hagen law cannot be applied quantitatively to the circulation in the body. Nevertheless, it is still true that the relation between pressure difference and blood flow is a function of vessel geometry and blood viscosity. Thus, the resistance to flow varies with the blood viscosity and the vascular hindrance:
| Rv = Aη | (7) |
where A is a geometric factor including the length, the radius and the number (N, arranged in parallel) of blood vessels:
| A = f (L/Nr) | (8) |
The use of the symbol f( ) indicates that the vascular hindrance A is a function of the three parameters given in the parenthesis: A varies in the same direction as L and in the opposite direction to N and r, without specifying the exact quantitative relationship.
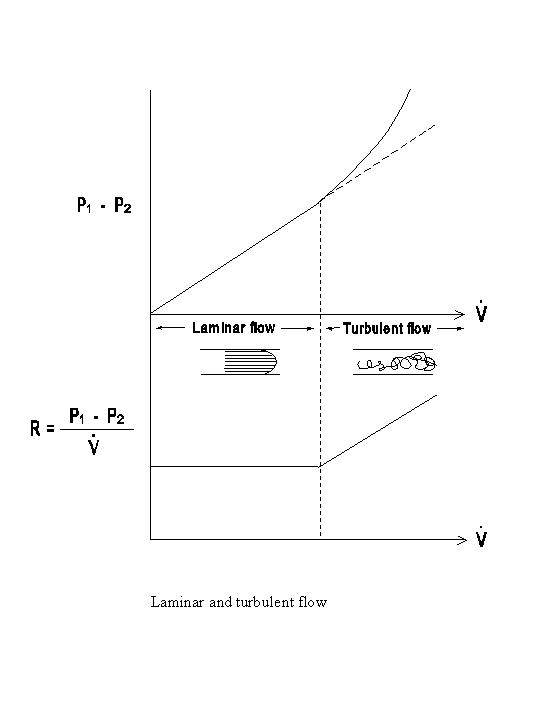
As indicated above, the flow resistance in streamline flows is entirely attributable to viscous resistance. When the fluid elements follow erratic patterns of flow, e.g., in eddies, the kinetic energy loss leads to an inertial resistance (R1), which causes additional pressure dissipation across the vessel wall at a given flow rate. The inertial resistance is a function of the flow rate and the fluid density (ρ), as well as the tube geometry:
| R1 = Bρ |
(9) |
where B is a geometric factor. Combination of inertial and viscous resistances gives the total resistance (RT):
| RT = Rv + RI = Aη + Bρ |
(10) |
Since
| RT = (P1-P2) / |
(11) |
it follows that
| P1-P2 = Aη + Bρ2 |
(12) |
Thus, a significant inertial resistance leads to a greater pressure dissipation than that expected from viscous resistance alone, and this effect is primarily seen at high flow rates (see diagram below).
The relative magnitude of the inertial and viscous resistances is:
| R1 / Rv =
Bρ2 / Aη =
Bρ / Aη |
(13) |
where B/A is a geometric factor. The ReynoldÆs number (Re) is a dimensionless parameter used to indicate the relative importance of RI in comparison to Rv:
|
Re = 2ρ / π r η
| (14) |
Since = π r2![]() ,
this equation can also be written as
,
this equation can also be written as
|
Re = ρ | (15) |
where d is the vessel diameter (d = 2r). The larger the ReynoldÆs number, the greater the contribution of inertial resistance to total resistance. In flow through a straight tube with a uniform radius, turbulence occurs when Re is greater than a critical value (Rc) of approximately 2000. With the complex geometry of the cardiovascular system, however, turbulent flow may occur at Rc values lower than 2000. The ReynoldÆs numbers in the normal cardiovascular system are generally rather low, except near the orifices of the cardiac valves. Therefore, inertial resistance is generally less important than the viscous resistance, and the term resistance is often used to imply viscous resistance only. Streamline flow is silent, whereas turbulent flow is associated with sound production. The presence of turbulence near the orifices of the cardiac valves contributes to the generation of heart murmur, while the closure and vibration of the valves are primarily responsible for heart sounds.
B. PRESSURE-VOLUME RELATIONSHIP AND THE CAPACITY OF THE CIRCULATION
The pressure in a container is exerted in all directions. In analyzing the pressure-flow relation, the pressure at one section in the vessel is compared to that at another section along the longitudinal axis of the vessel. When the pressure at one section inside the vessel (Pi), which may be P1 or P2 in the diagram below is compared with the pressure outside (Po) the vessel, the transmural pressure difference (P = Pi¢Po) serves to distend the vessel and increase the volume of blood contained therein. When two vessels with different distensibilities are subjected to the same transmural pressure, the one which is more distensible can accommodate a larger blood volume and is said to have a larger capacity. The term capacity (C) refers to the ratio between the static values of blood volume and transmural pressure.
| C = V / P | (16) |
In contrast to the term capacity which refers to the static relation between blood volume and transmural pressure, the term capacitance, or compliance, (Cd) describes the dynamic relation between these two parameters. The capacitance of a vessel denotes the variation in volume per unit change in transmural pressure.
| Cd = ΔV / ΔP | (17) |
Therefore a vessel which can accommodate a large expansion of blood volume with a small increase in pressure has a large capacitance.
The pressure-volume relationships for arteries and veins are compared in the volume/pressure relationship in arteries and veins figure. The arteries have a higher transmural pressure and a smaller blood volume, indicating a low capacity. The veins have a lower transmural pressure but contain a larger blood volume, i.e., they have a high capacity. When the change in volume for unit change in pressure is considered, the capacitance is again smaller in the arteries than in the veins. Therefore the veins, which have a high capacity and a large capacitance, are usually referred to as the major capacitance vessels.
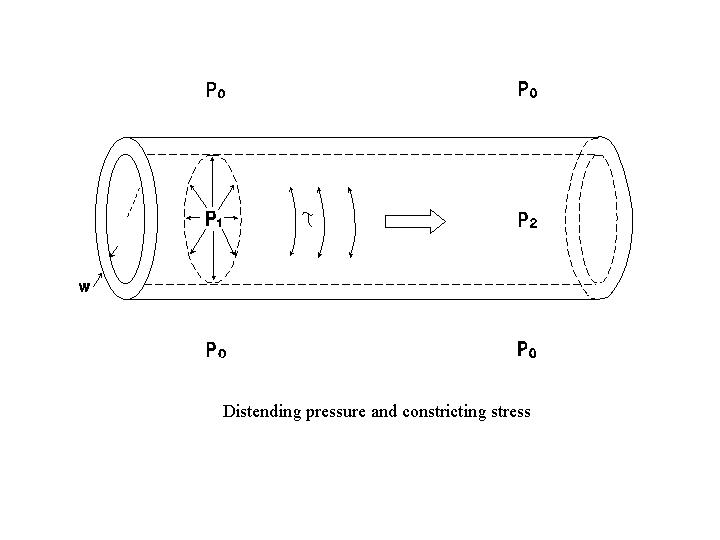

The pressure in a distensible chamber tends to increase the chamber size, and the circumferential wall stress (τ, in dynes/cm2) tends to reduce the chamber size. At an equilibrium chamber size, the distending pressure is in equilibrium with the constricting stress. The Laplace law describes the relation between transmural pressure (P, in dynes/cm2) and the circumferential wall stress at an equilibrium chamber size:
| P = τw (1/r1 + 1/r2) | (18) |
where w is the wall thickness (assumed to be uniform) and r1 and r2 are the major and minor radii of curvature of the chamber. The product τw gives the wall tension (T, which is the force per unit vessel length, in dynes/cm). Therefore, eq. (18) can be written as:
| P = T (1/r1 + 1/r2) | (19) |
Equation (18) and (19) are the general forms of Laplace law describing the conditions required to maintain the equilibrium state of a chamber. For spheres, the major and minor radii are the same, r1 = r2 = r. This is approximately the situation for the ventricle. For a spherical chamber,
| P = 2τw / r or | (20) |
| τ = Pr / 2w | (21) |
For cylindrical vessels, one of the radii of curvature is its cross sectional radius r and the other is infinity (because the longitudinal direction of the vessel cannot be inscribed by any finite radius). Therefore, for a cylindrical vessel,
| P = τw / r or | (22) |
| τ = Pr / w | (23) |
Equations (21) and (23) indicate that an increase in wall thickness reduces the wall stress for a given pressure. In other words, a higher pressure can be maintained by an increase in wall thickness without a commensurate rise in wall stress. Hypertrophy of ventricular myocardium can occur in people with high blood pressure. It also occurs in response to increased functional demands in normotensive individuals; for example, as a result of physical training, when increased cardiac output occurs repeatedly during the exercise periods.
A. GENERAL OUTLINE OF THE CIRCULATORY SYSTEM
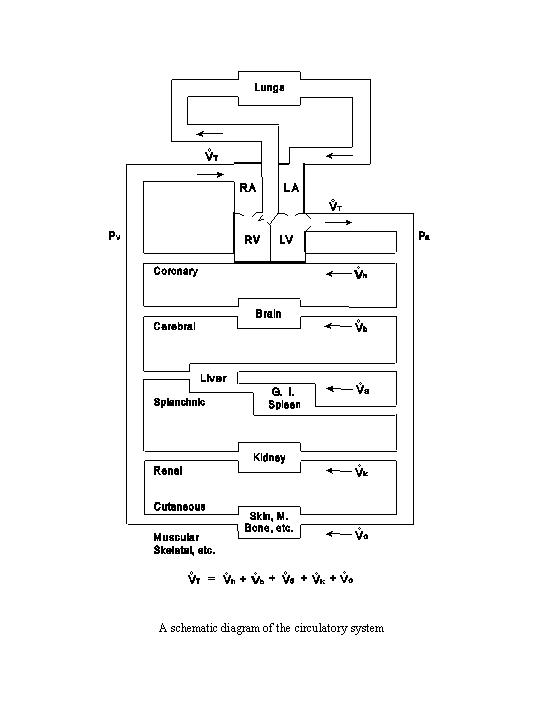
The output of the left ventricle flows into the aorta and is then distributed into many parallel circuits in the systemic circulation: the coronary circulation (heart), the cerebral circulation (brain), the splanchnic circulation (spleen, gastrointestinal tract and liver), the renal circulation (kidneys), and the circulation through the other organs and tissues, including the skeletal muscle, skin and bone (see the following diagram). The liver receives a double supply of blood, i.e., from the hepatic artery and the portal vein, which carries the outflow from the spleen and the gastrointestinal tract. After traversing these parallel circuits the venous blood, with various degrees of deoxygenation, is recombined and returned to the right atrium and the right ventricle. The output from the right ventricle is delivered to the pulmonary circulation (lungs) via the pulmonary artery. The oxygenated blood returns via the pulmonary vein to the left atrium and the left ventricle.
In a steady state the outputs of the two ventricles are the same, and equal to the venous return to each
atrium. Thus the same symbol of T can be used to denote the total flow entering or
leaving either side of the heart per unit time. There may be transient disparity between the total flows through
the two sides of the heart, but this difference cannot persist in the normal circulation.
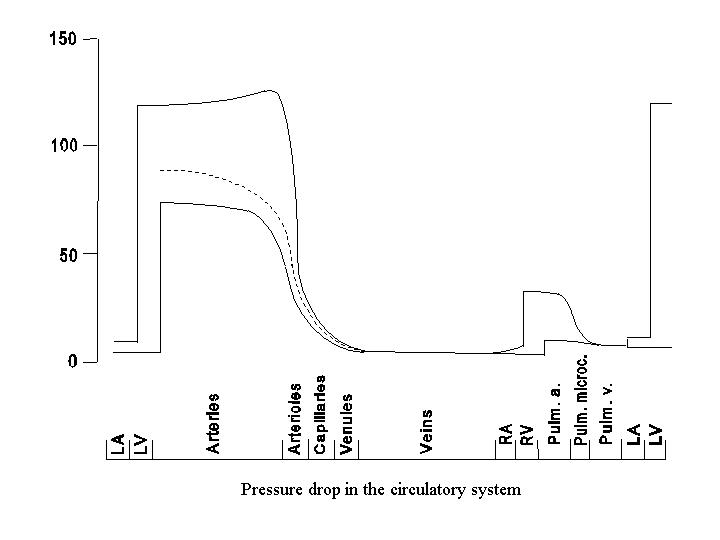
The pressure profile along the path of the circulatory system is shown in the following diagram. The pressure decreases progressively from the aorta throughout the systemic circulation, reaching the lowest value (near atmospheric pressure, or 0) in the right atrium, reflecting the energy dissipation in flow. The magnitude of the pressure drop varies along the circulatory path, being small in the large arteries and veins and large in the small vessels. The pressure drop is the steepest in the small arteries and arterioles, which are referred to as the major resistance vessels. The detailed contour of the pressure drop in some parts of the circulation (e.g., kidney or splanchnic circulation) may differ considerably from that shown here because of the existence of two sets of capillary beds in series.
B. RESISTANCES IN SERIES AND IN PARALLEL
The resistances in the consecutive segments in the circulation can be added directly to one another to yield the total resistance in the serial circuit. The resistances in the arteries, the arterioles and the arteriolar end of the capillaries are often grouped together and referred to as the precapillary resistance (Ra). The resistances in the venular end of the capillary, the venules and the veins are generally grouped and referred to as the postcapillary resistance (Rv). According to the definition of resistance,
|
Ra = (Pa-Pc) /
| (24) |
|
Rv = (Pc-Pv) /
| (25) |
where Pa, Pc and Pv are arterial, mid-capillary and venous
pressures, respectively, and is blood flow. Combining these two equations yields
|
Ra + Rv = (Pa-Pv) /
| (26) |
Since the right hand side of this equation is the definition of the total resistance through the entire serial circuit, this indicates that the total resistance is equal to the sum of the individual resistances in series. This also holds true for electrical resistors arranged in a serial circuit.
In parallel circuit, as indicated under the diagram on circulatory system, the total blood flow
(T) is equal to the sum of the flows through each of the parallel paths
(coronary flow h, cerebral flow b, splanchnic
flow s, renal flow k, and flow through
other regions o).
|
T = h + b
+ s + k + o
| (27) |
In each of the parallel paths, the flow is equal to (Pa-Pv) / R. Hence,
| (Pa-Pv) RT |
(Pa-Pv) Rh |
(Pa-Pv) Rb |
(Pa-Pv) Rs |
(Pa-Pv) Rk |
(Pa-Pv) Ro |
(28) |
| or | 1 RT |
1 Rb |
1 Rh |
1 Rs |
1 Rk |
1 Rk |
(29) |
where Rh, Rb, Rs, Rk, and Ro, are resistances in the coronary, cerebral, splanchnic, renal and other circulations, respectively.
Therefore, in parallel circuits in the circulation, as electrical resistors arranged in parallel, the reciprocal of the total resistance is equal to the sum of the reciprocals of the resistances in the individual circuits.
C. STRUCTURAL FEATURES OF SERIAL SEGMENTS OF VASCULAR TREE
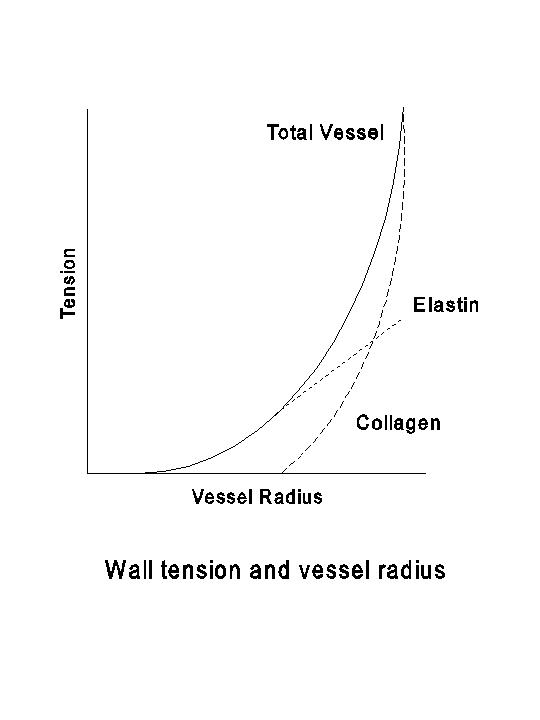
In any region of the circulation, the serial segments of blood vessels are divided on structural and functional bases into arteries, arterioles, capillaries, venules and veins. The basic types of tissues found in the vascular wall are endothelium, smooth muscle, elastin and collagen. The smooth muscle, when contracting, generates active tension. The elastin and collagen are the principal determinants of the passive distensibility of the vessel. Elastin fibers have a low mechanical threshold, and they produce the passive tension when a vessel is subjected to a light distension. Collagenous fibers have a higher mechanical threshold and are less distensible than elastin; they are responsible for the large passive tension generated when the vessel is subjected to considerable distention (see the following diagram).
The large arteries, i.e., the aorta and pulmonary artery and their major branches, are referred to as elastic arteries because of the presence of relatively large amounts of elastin. With the branching of the arterial tree, the elastin and collagen content of the wall decreases and the concentration of smooth muscle increases. Therefore, the smaller arteries are referred to as muscular arteries. The predominance of smooth muscle fibers is especially pronounced in the arterioles. Hence the small arteries and the arterioles can generate considerable active tension and constitute the major determinant of the resistance in the circulation.
The structural features of the various segments of the arterial tree have functional significance in the conversion of discontinuous ventricular output to a continuous (though pulsatile) flow in the peripheral circulation. Due to the distensibility of the large arteries and the resistance encountered in the peripheral circulation, a portion of the blood ejected by the ventricle is stored in the large arteries during systole (ventricular contraction). During diastole (ventricular relaxation) this stored blood is released, thus maintaining the continuity of peripheral blood flow and preventing excessive fall in arterial pressure. Capillaries are thin-walled vessels composed primarily of an endothelial cell layer. The thin walls of the capillaries, together with their enormous surface area, make them ideally suited for exchange between blood and extravascular fluid. In comparison to arteries, veins at equivalent levels in the vascular tree, generally have thinner walls, larger lumens, less smooth muscle and less elastin. These features form the structural basis for the veinsÆ greater capacitance as compared to the arteries.
D. GEOMETRIC CONSIDERATIONS OF THE VASCULAR TREE
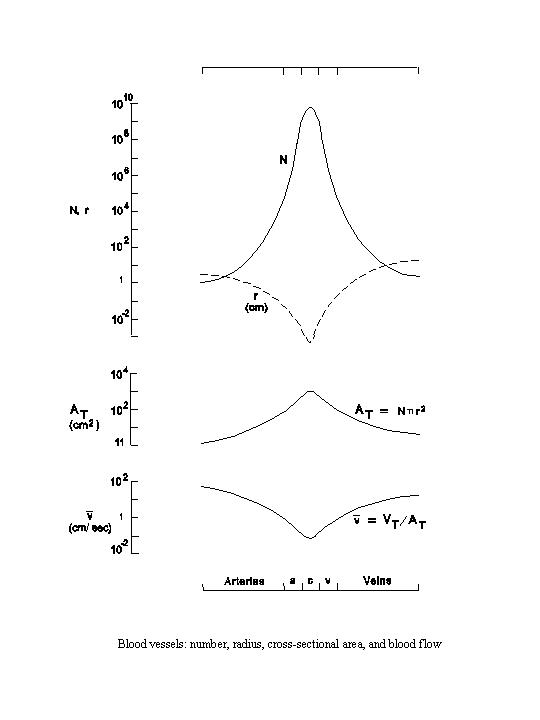
The parallel arrangements in the circulatory system result from branching of the vessels. With branching, the number of vessels increases, while each vessel becomes progressively smaller. Thus the aorta, which is the single outflow vessel from the left ventricle, by repeated branching, eventually gives rise to more than one billion capillaries in the systemic circulation. Together with the increase in number, the internal radius of each vessel decreases rapidly from over 1 cm in the aorta to less than 10-3 cm in the capillaries, thus representing a difference of over 1,000 fold (see the following diagram). As the capillaries reunite to form venules, the number of vessels becomes progressively reduced and the size of each vessel becomes increasingly larger. When the size of a vein is compared with that of a companion artery, e.g., a femoral vein vs. a femoral artery, the internal radius of the vein is larger than that of the artery.
The cross-sectional area of a cylindrical vessel can be calculated from its internal radius (r) as π r2. The total cross-sectional area (AT) occupied by a given segment or type of blood vessel, e.g., the capillaries, can be calculated as the product of the average cross-sectional area and the total number (N) of such vessels.
| AT = Nπ r2 |
At the beginning of the arterial system, the total cross-sectional area is the cross-sectional area of the aorta. Although each capillary is small, the total area occupied by the capillaries is approximately 600 times greater than that of the aorta due to their large number (over 1 billion). Upon returning through the venous side, the cross-sectional area of each vessel becomes larger, but the number of vessels is reduced more rapidly than the cross-sectional area increases. This leads to a decrease in total cross-sectional area going from the capillaries to the veins. Since the cross-sectional area of a vein is larger than that of the corresponding artery and the number of these two types of vessels are comparable, the total cross-sectional area on the venous side is larger than that of the corresponding arterial segment.
As the output of the left ventricle is equal to the venous return to the right atrium in a steady state, the total
volumetric flow (T) through each type of vessel (e.g., the aorta or
the capillaries) must also be the same. The mean linear velocity ( ) of blood flowing through each
segment of the circulation can be calculated as:
) of blood flowing through each
segment of the circulation can be calculated as:
|
T / AT
|
With the same T for each segment, the linear velocity varies inversely
with the total cross-sectional area (see diagram). Thus, the linear velocity is the fastest in the aorta (mean value
of approximately 30 cm/sec) and the slowest in the capillaries (approximately 0.05 cm/sec), with a difference on the
order of 600 fold. Upon returning through the venous side, the cross-sectional area decreases and the linear velocity
again increases. Since the total cross-sectional area of the veins is larger than the corresponding arteries, the
linear velocity in the veins is slower than that in the corresponding arteries.
The volume of blood (V) contained within each segment of the circulatory system can be calculated by multiplying the total cross-sectional area by the average length (L).
| V = AT L |
Although the total cross-sectional area in the minute vessels (including the capillaries, arterioles and the venules) is large, because of their short span the volume of blood contained in this segment is not very large; probably less than 10 percent of the total blood volume in the systemic circulation. The arteries contain approximately 20-30 percent of the systemic blood volume. The veins, which have a larger cross-sectional area than the arteries and a similar length, contain approximately 60-70 percent of the systemic blood volume. Although the above discussions were centered on the systemic circulation, similar geometric considerations on vessel size and number, linear velocity, and volume distribution can be applied to the pulmonary circulation. The results differ only quantitatively.