Biophysics of T Cell Activiation
Artificial Organs Research Laboratory, Chemical Engineering Department,
Columbia University, 814 Mudd Bldg, 500 West 120 Street, NY, NY 10027
by Sarah Patrick, Sobin Kim, Hong An, and Ned Bruinstein
The purpose of this project is to investigate biophysical properties of the activation of T lymphocytes by antigen presenting cells. T cell activation has been studied extensively by biologists, leading to the identification of the relevant receptor-ligand pairs involved and their affinities for one another, as well as most of the steps of the subsequent T cell signal transduction pathway. However, these studies have been conducted largely without control of contact of the receptor-ligand pairs involved in T cell activation. Our laboratory has developed a method to control the contact of T cell surface receptors with activating ligands. Using this method, the T cell activation process will be examined in a controlled and detailed manner with the goal of gaining kinetic and thermodynamic information about specific steps in the signal transduction pathway. Specifically, the goals of this investigation are: (1) to establish a detailed relationship between the number of ligands exposed to cell surface receptors (determined by cell contact area with, and the ligand density of, the activating surface), and time-length of contact and the consequent activation of T cells, (2) to quantitatively examine the relationship between receptorligand binding events, early signal transduction events and late activation events and (3) to use these relationships to infer kinetic and thermodynamic data for a model of some of the steps in the T cell activation process.
To control the contact of T cell receptors (TCR) with activating ligands, a film-thinning apparatus (FTA) has been developed (Figure lA). In this apparatus a ligand-coated coverslip forms the base of the well, and allows microscopic observation of the cells. The well is filled with medium and cells, forming a thick film (Figure iB). The attached syringe is used to thin the film, drawing down the air-liquid interface and forcing the cells into contact with the adsorbed ligands (Figure IC).
Figure 1. Film-thinning apparatus. (A) Chamber with attached syringe. (B) Thick film. (C) Thin film. Click image to see this image full size.
To achieve very fine control of the contact area of the cells with the ligand-coated surface, the final height of the thinned film must be controlled to within one micron. Nondeformable microspheres, or beads, are used to indicate the film height (Figure 2). The beads are chosen to be slightly larger than the T cells. The amount of deformation of the cells, and thus the contact areas produced, is inferred from the film height. When the film is thinned, the air-liquid interface is drawn down upon the beads. When the film is illuminated from a point source of monochromatic light, interference rings are produced by the curvature of the film covering the beads (Figure 3). The interference rings indicate the distance below the bead height down to which the film has been drawn. The shape of the film falling from the beads can be reconstructed from the interferogram. The reconstructed shape agreed well with the theoretically calculated profile (Figure 4). This profile was found by numerical integration of the equation of Young and Laplace from the bead surface to the chamber wall.(prop 45).
pgy + Change in Pref = y [y’’/(l + y’2)3/2 + y’/r(l + y’2)1/2]
Figure 2. Microspheres used to indicate film height in the FTA.
Figure 3. Interference rings formed by a 14.6 micron bead in the FTA.
Figure 4. Comparison of theoretically and experimentally determined profiles for a film falling from a 14.6 micron bead.
An immune response is initiated when a unique I lymphocyte recognizes a foreign antigenic peptide expressed by an antigen presenting cell (APC) in the context of a class II major histocompatibility complex (MHC) molecule (prop 1). Upon ligation of T cell receptor complex (TCR and associated CD3 molecule), signals are transduced into cytoplasm and ultimately to the nucleus. One of the early biochemical responses is a rise in intracellular calcium (prop 8). The rise in intracellular calcium activates a series of enzymes, leading to the activation of the transcription factor NFAT, which is then able to translocate to the nucleus and initiate cytokine gene expression (prop 12).
To examine the biophysics of T cell activation methods are employed to monitor early and late steps in the T cell signal transduction pathway. Calcium mobilization can be measured at the single cell level using Fura-2 AM, a calcium-sensitive fluorescent dye (paper 15,22). Pairs of images are taken of the cells at 340 and 380 nm. The ratio of these images corresponds to the level of calcium within the cell. Ratioed images which track calcium mobilization it I cells are shown in false color in Figure 5. The color of the cells changes from green to yellow to red as the calcium levels increase.
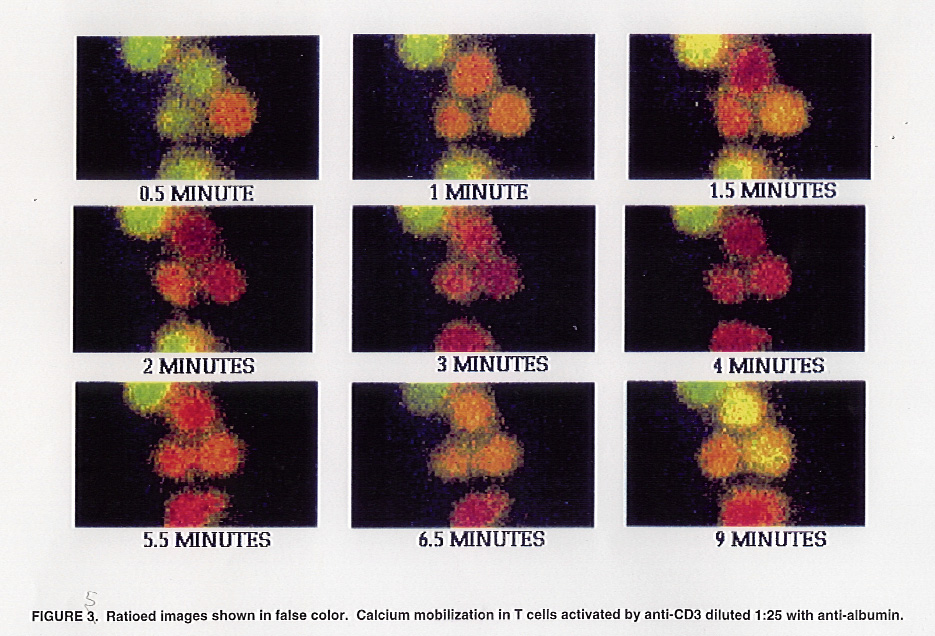
Figure 5. Ratioed images shown in false color. Calcium mobilization in activated T cells.
To monitor gene expression in I cells, a lacZ reporter system is used. In this system, a bacterial lacZ gene is tinder the control of a promoter containing three binding sites for NEAT (prop 37). When this reporter system is transfected into a T cell line, the lacZ gene is expressed upon binding of activated NEAT. The product of the lacZ gene is Bgalactosidase, which can be monitored at the single-cell level using the chromogenic substrate x-gal. lacZ(±) cells turn blue upon incubation with x-gal (Figure 6).
Figure 6. LacZ(+) T cells.
Preliminary studies were done using the ETA to investigate the critical anti-CD3 density for I cell activation (ref Sarah’s paper). Engagement of the ICR complex with a specific antibody can artificially stimulate I cells (prop 26), and is a valuable simplifying method for examining details of the I cell activation process. In Figure 7, the FIA is used to control the contact of T cells with surfaces of coated with different densities of anti-CD3. In Figure 7A,C, E, and G, the film was thinned to force the cells onto the ligand coated surface. Figure 7B, D, F, and H are the controls, where the cells were allowed to settle under the influence of gravity. Each thin line represents the calcium response of an individual I cell. The thick lines represent the averaged response of the cell population at each condition. Comparison of Figure 7A with its control (7B) illustrates that using the FTA to control cell contact synchronizes the calcium response of individual cells. From these experiments, the critical anti-CD3 density was found to lie between 35 and 70 anti-CD3 molecules/u2.
Figure 7. Calcium response of cells activated at different densities of anti-CD3. Click the image to see this image full size.
In Figure 7, some activation due to cells settling onto the antibodies under the influence of gravity was seen in the controls. By reducing the ionic strength of the medium, the repulsive electrostatic forces that exist between the cells and the antibody surface can be enhanced, allowing much greater control of receptor-ligand contact (Figure 8).
Figure 8. T cell activation in low ionic strength medium. Click the image to see this image full size.
In future experiments, the FTA will be used to produce a wide range of activating conditions for the T cells and the resulting gene transcription will be monitored along with calcium mobilization. Ultimately this apparatus will be modified to create a more realistic activating surface. APC cell surface molecules, for example, MHC peptide complexes, are being purified and will be added to the FTA within a planer lipid bilayer.