Hansen, J. et al. "Young People's Burden" Figures and Data (Some Updated)
.
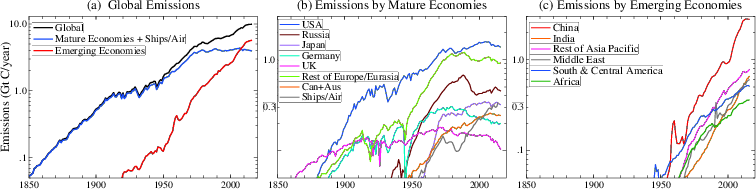
Fig. 1. PDF,
Data: (a), (b), (c) (1850-2014 CDIAC & 2015-2016 BP, 2017/07/28)
.
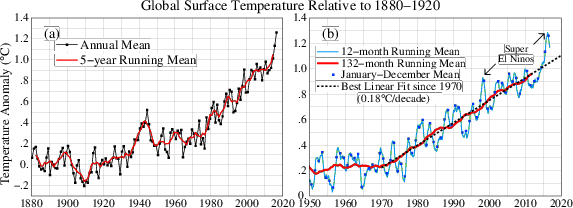
Fig. 2. PDF,
Data: (a), (b1), (b2) (Data through April 2017, last update 2017/05/19)
PDF for Video (Data through April 2017, last update 2017/06/03)
.
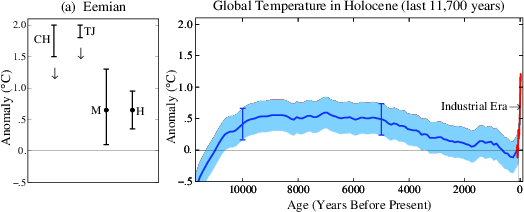
Fig. 3. PDF,
Data: (b)(20191107)
PDF for Video (last update 2017/06/02)
.
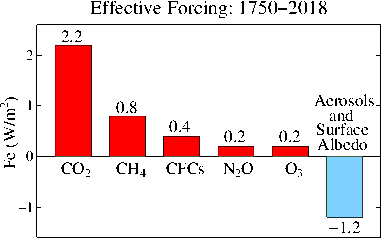
Fig. 4. PDF (last update 2019/11/05)
.
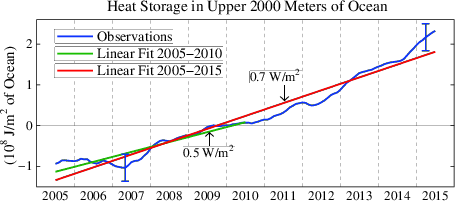
Fig. 5. PDF, Data (No change since 2016/09/20)
Fig. 6. See Greenhouse Gases page
Fig. 7. See Greenhouse Gases page
.
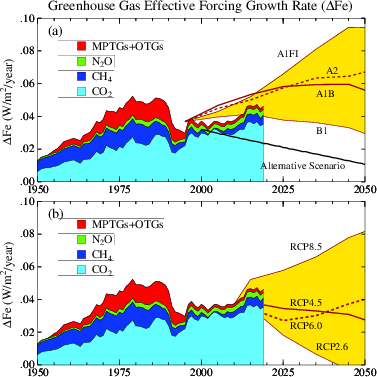
Fig. 8. PDF,
Data: Historical, Old IPCC, Alternative Scenario, IPCC RCPs (5-year mean data used but 2018 and 2019 data were replaced by the annual means, last update 2020/04/24)
More figures in PDF: historical part only (last update 2019/04/22), , PDF for COP23 (last update 2019/04/22)
.
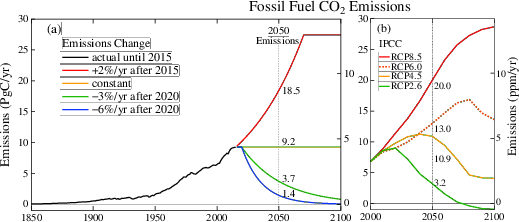
Fig. 9. PDF,
Data: Actual, (a), (b) (last update 2017/05/20)
.
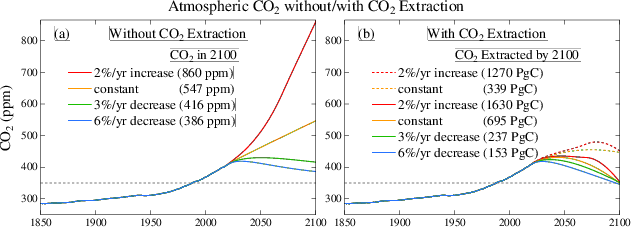
Fig. 10. PDF,
Data: Actual, (a), (b) (last update 2017/05/25)
.
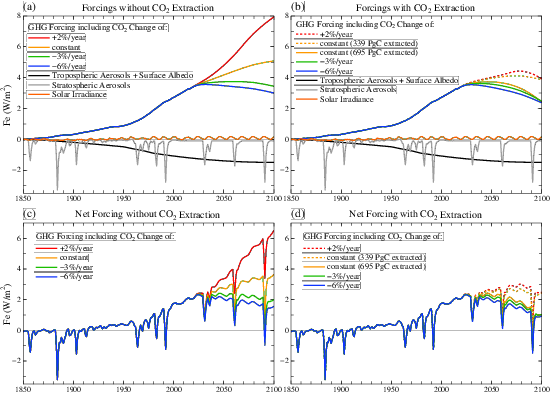
Fig. 11. PDF,
Data: GHGs in (a), GHGs in (b), Troposphere and surface, Stratospheric aerosols, Solar, (c), (d) (last update 2016/12/12)
.
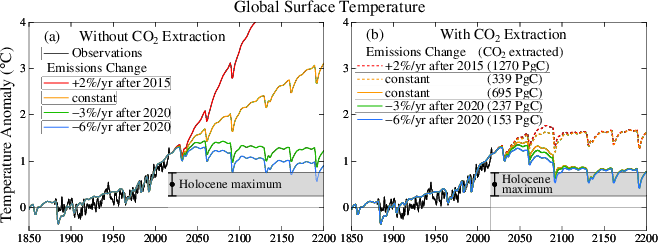
Fig. 12. PDF,
Data: Observations, (a), (b) (last update 2017/05/22)
.
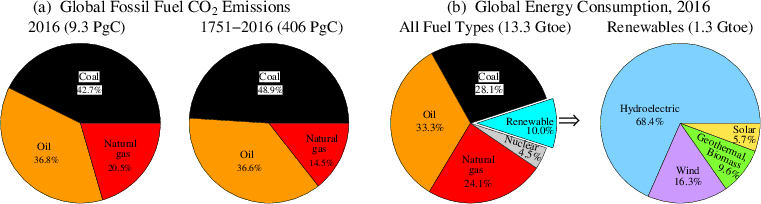
Fig. 13. PDF (1751-2014 CDIAC & 2015-2016 BP, last update 2017/07/15)
Note: The emission numbers above the pies in the paper included cement production and gas flaring. Here they are only the sums of coal, oil and gas.
.
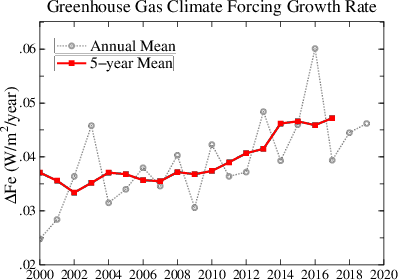
Fig. 14. PDF, Data (last update 2020/04/24) Fig.08 + Fig14 (2019/04/22)
.
<> <> <> <> <> Appendix <> <> <> <> <>
.
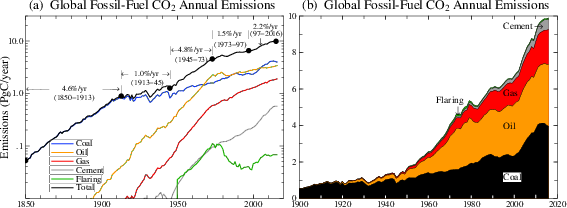
Fig. A1. PDF.
Data: (a), (b) (1850-2014 CDIAC & 2015-2016 BP, last update 2017/11/01 to divide at 1973)
.
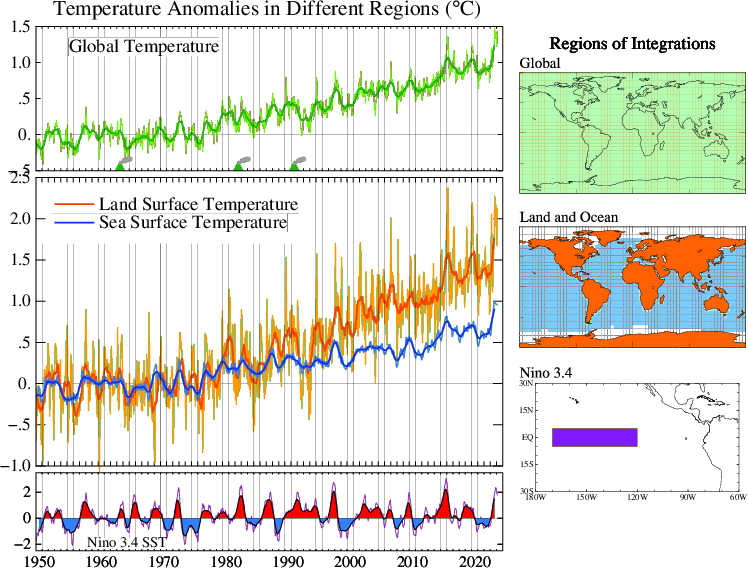
Fig. A2a. PDF, Data: Global, Land & SST, Nino 3.4 (Data through June 2017, last update 2017/07/14)
.
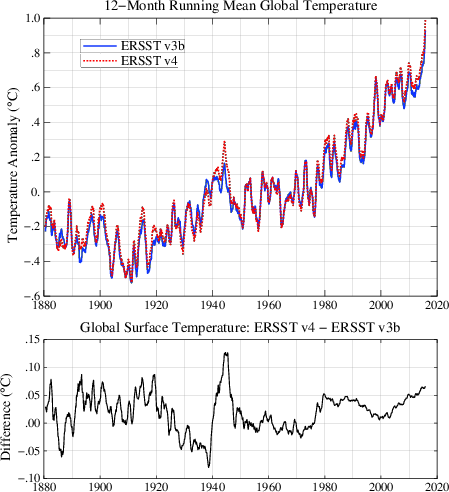
Fig. A2b. PDF, Data (Figure created on 2015/07/18, not published before)
.
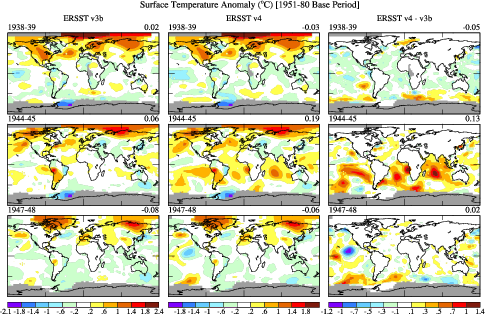
Fig. A2c. PDF. Data: 1938-39, v3b, 1938-39, v4, 1938-39, v4-v3b, 1944-45, v3b, 1944-45, v4, 1944-45.v4-v3b, 1947-48, v3b, 1947-48, v4, 1947-48, v4-v3b (Figure created on 2015/07/18, not published before)
.
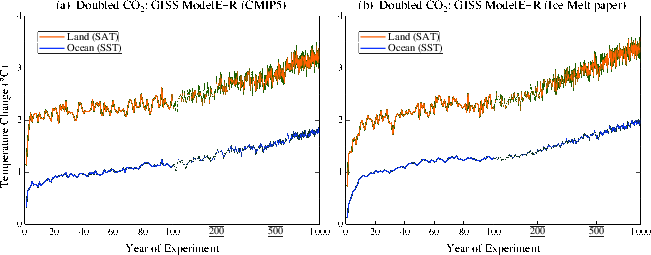
Fig. A3. PDF,
Data: (a), (b) (2017/04/26)
.
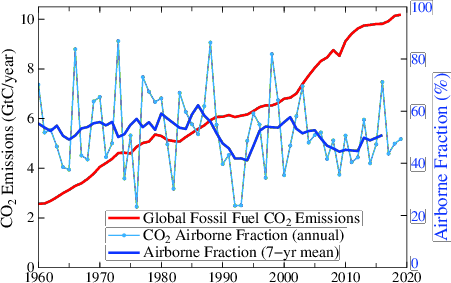
Fig. A4. PDF,
Data: CO2 emissions, Airborne fraction (last update 2020/06/24)
CO2 appearing in the air and disappearing: Figure in PDF (2018/10/14).
.
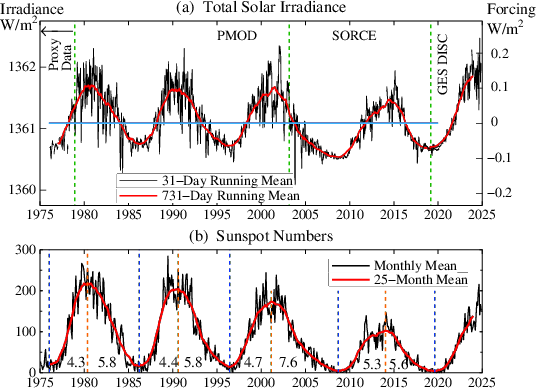
Fig. A5. PDF, Data: 31-day mean, 365-day mean, Sunspots Monthly, "Smoothed (Data through July 2017, last update 2017/08/01)
.

Fig. A6. PDF, Data (last update 2017/05/22)
.
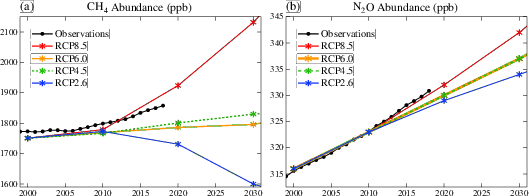
Fig. A7. PDF, Data: (a) Observations, (a) RCPs, (b) Observations, RCPs (last update 2019/04/22)