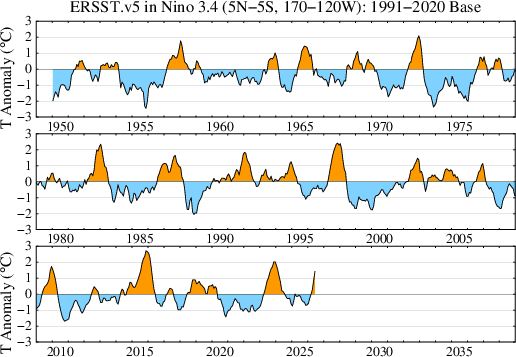
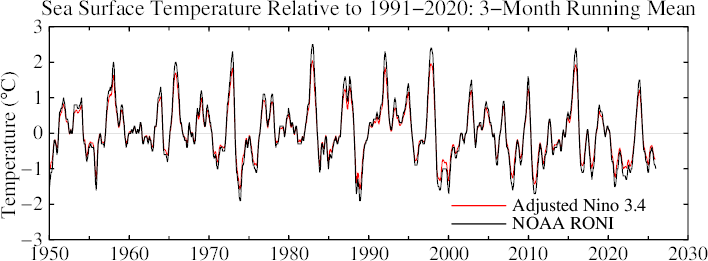
Nino 3.4 PDF (2026 comparison to 1997-1998), RONI PDF
.
Data through June 2026, last modified 2026/07/04.
Nino 3.4 data source:
NOAA Climate Prediction Center nino
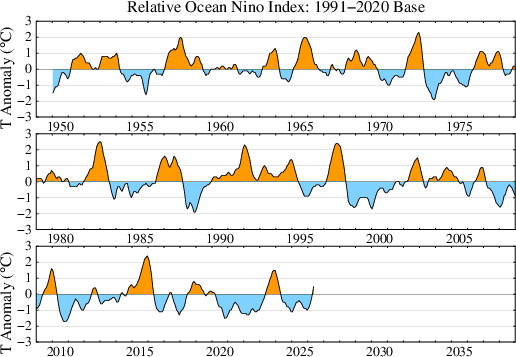
RONI data source:
NOAA Climate Prediction Center roni
.
PDF, data through December 2025.
last modified: 2026/01/23.
PDF, data through January 2026.
NOAA explains "The difference is then adjusted so the variance equals the original Nino 3.4 index", but I didn't normalize. The NOAA's multiplication factor is ~1.2.
last modified: 2026/02/03.
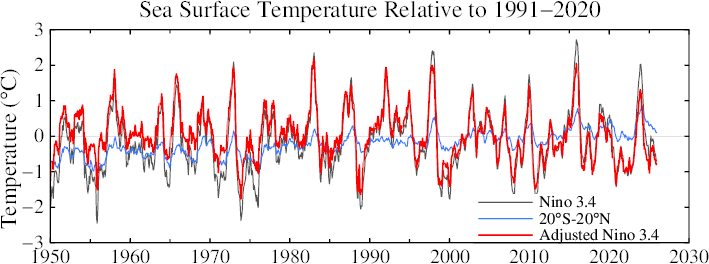
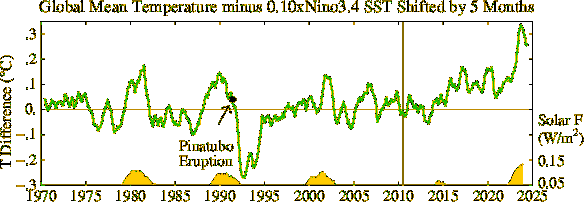
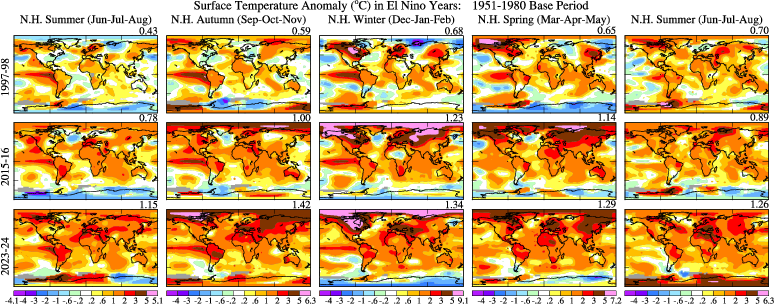
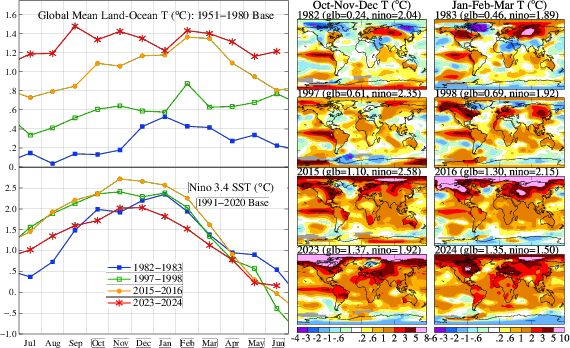
Comparison with Global Temperature
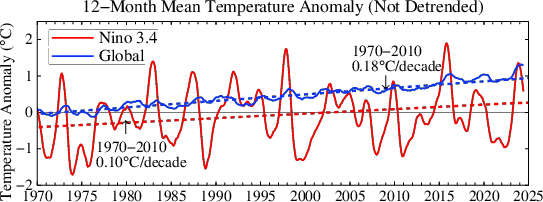
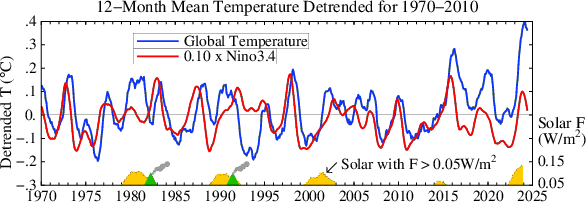
The factor 0.104 was determined to match the standard deviations for the global and Nino3.4 temperatures for 1970-2010.
PDF Data through November 2024 used. last modified: 2024/12/19.
PDF Data through November 2024 used. last modified: 2024/12/19.
(last modified 2024/10/05)
(last modified 2024/07/10)
Temperature anomaly in GISS analysis. The base periods are shifted. (last modified: 2013/05/06)
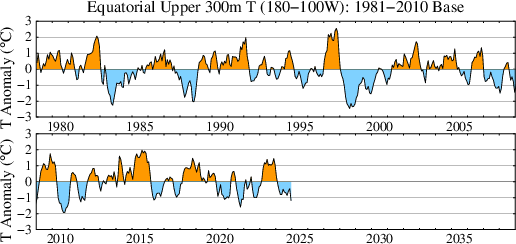
2-parts PDF, 1979-2026 PDF, and comparison of 1997-1998 and 2026-2027 El Ninos. Data through June 2026, data source:
NOAA Climate Prediction Center,
last modified: 2026/07/01.
Data through June 2026.
last modified: 2026/07/04.