In
PDF
(Last modified: 2023/09/20)
<><><><><><><><><><><><><><><><><><><><><><><><><><>
Updates of Figures Published in PNAS Plus On-Line
Now we use GHCN v4 and ERSST v5.
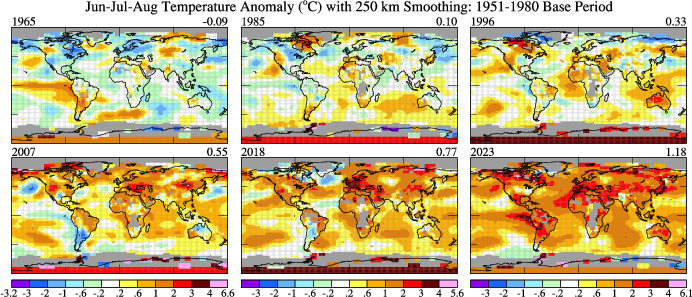
Figure 1.
Jun-Jul-Aug surface temperature anomalies relative to 1951-1980 mean. Number on upper right is the global mean (average over all area with data).
(Last modified: 2023/09/18)
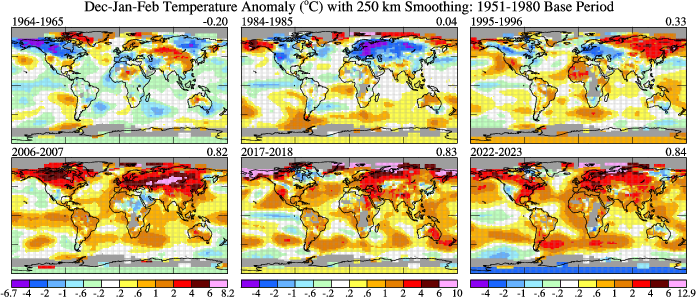
Figure 1 but Dec-Jan-Feb.
(Last modified: 2023/09/18)
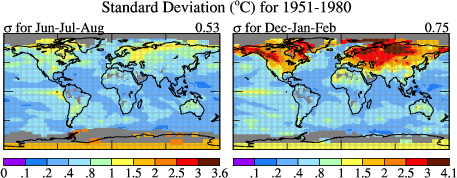
Figure 2 Simplified. Standard deviation of local Jun-Jul-Aug (left) and Dec-Jan-Feb (right) mean surface temperature for 30-year-period 1951-1980.
(Last modified: 2023/09/18)
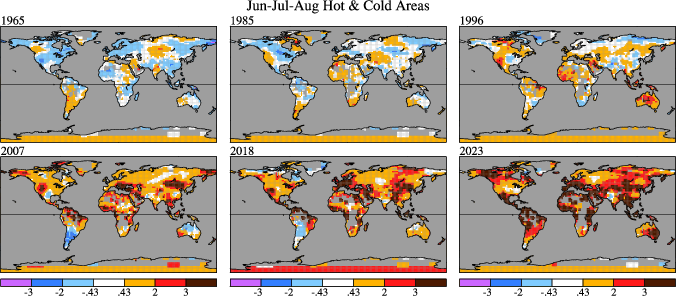
Figure 3/6. Jun-Jul-Aug surface temperature anomalies in units of the local 1951-1980 standard deviation.
Binary Data
(Last modified: 2023/09/18)
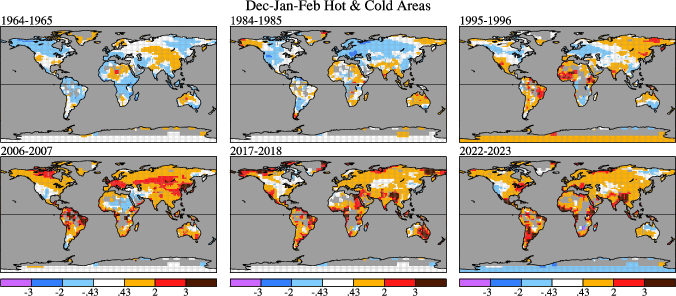
Figure 3/6. but for Dec-Jan-Feb.
(Last modified: 2023/09/18)
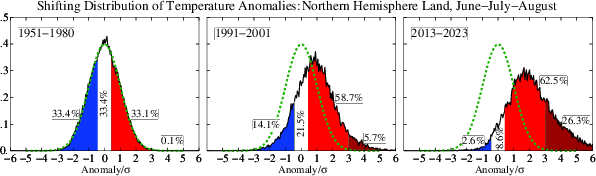
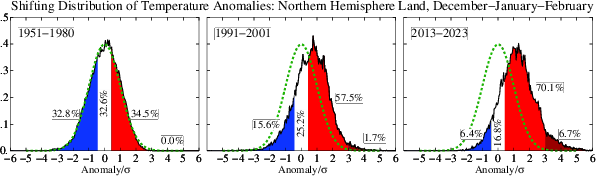
Shifting Dstribution of Temperature Anomalies
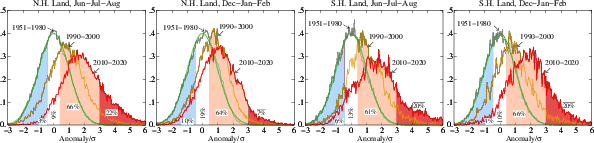
Figure 4. Frequency of occurence (y-axis) of local temperature anoma
lies (relative to 1951-1980 mean) divided by local standard deviations (x-axis) obtained by counting how many gridboxes have anomalies within each 0.05 interval over 11-year periods. Area under each curve is unity.
PDF (Last modified: 2020/10/02)
Figure 5. Area covered by temperature anomalies in the categories defined as hot (> 0.43σ), very hot (> 2σ), and extremely hot (> 3σ)
with analogous divisions for cold anomalies.
Anomalies are relative to 1951-1980 climatology, with σ also from 1951-1980 data.
(Last modified: 2017/01/24)
Figure 7. Same as Fig. 5, but for the United States.
(Last modified: 2017/01/24)
Figure 8. Jun-Jul-Aug and Dec-Jan-Feb temperature anomalies (°C) for area shown on the right.
(Last modified: 2011/10/18)
<><><><><><><><><><><><><><><><><><><><><><><><><><><><><><><><><>
Figures below will not be Updated
Figure 9. Frequency of occurrence (y-axis) of local temperature anomalies divided by local standard deviation (x-axis) obtained by binning all local results for 11-year periods into 0.05 frequency intervals. Area under each curve is unity. Standard deviations are for the indicated base periods.
(Last modified: 2012/01/19)
Figure S1. Jun-Jul-Aug surface temperature anomalies in 1931, 1934, 1936, 1941, 1947, 1953. Number on upper right is the global mean (average over all area with data).
(Last modified: 2012/03/26)
Figure S2. Jun-Jul-Aug surface temperature anomalies over land in 1931, 1934, 1936, 1941, 1947, 1953 relative to 1951-1980 mean temperature in unit of the local 1951-1980 standard deviation of temperature. Numbers above each map are the percent of surface area covered by each category in the color bar.
(Last modified: 2012/03/26)