


Fig. 3 in PDF [The base period added in the figure 2018/01/21.]

Fig. 4 in PDF [Irradiance data are through Dec. 25, 2017 and the sunspot data are through December 2017.]

Fig. 5 in PDF [El Nino data has the original NOAA base period 1981-2010 and the global temperature has 1951-1980. Here we are comparing the shapes and not the absolute values.]
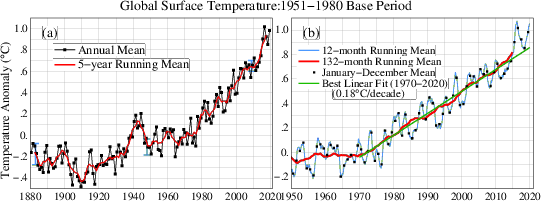
Fig. A1 in PDF
Above: with 1951-1980 base period as sent on 2018/01/18.
Below: an update of "Burden" Fig. 2 with 1880-1920 base period to be roughly compared with the preindustrial temperature.


Fig. A3 in PDF [Thers is no base period for the changes from one year to another.]