The figure in
PDF.
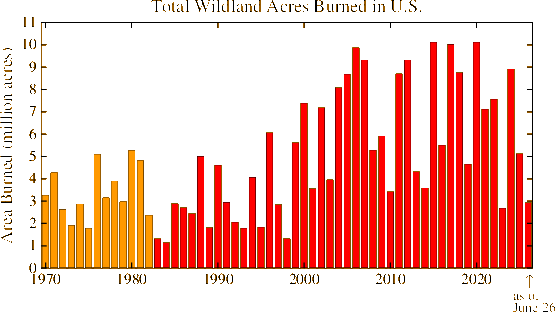
Last modified 2026/06/26
Data source: National Interagency Fire Center for 1983-2025 and for 2026. NIFC gives a note that "Prior to 1983, the federal wildland fire agencies did not track official wildfire data using current reporting processes. As a result, there is no official data prior to 1983 posted on this site." However, I show you 1970-1982 data obtained from the NIFC site in 2021 not to give some impression that the wildfires were very few before 1982.
Recent Notable Wildfires
- U.S. and Canada
- 2025 Greater Los Angeles Wildfires (0.058 million acres burned & 16.3 thousand structures distroyed as of 2025/02/01)
- 2024 Smokehouse Creek Fire in Texas (1.1 million acres)
- 2020 "2020 California Wildfires" (4.3 million acres, i.e. 4.2% of CA land area burned.)
- 2020 "2020 Oregon Wildfires" (1.0 million acres)
- 2020 August Complex Fire in California (1.0 million acres)
- 2023 Canadian Wildfires (45.7 million acres)
- 2018 "2018 British Columbia Wildfires" (3.3 million acres)
- 2017 "2017 British Columbia Wildfires" (3.0 million acres)
- 2014 "2014 Northwest Territories Fires" (8.4 million acres)
- Outside U.S. and Canada
- 2020 Russian Wildfires (35 million acres)
- 2019-20 Australian Bushfire Season (46 million acres)