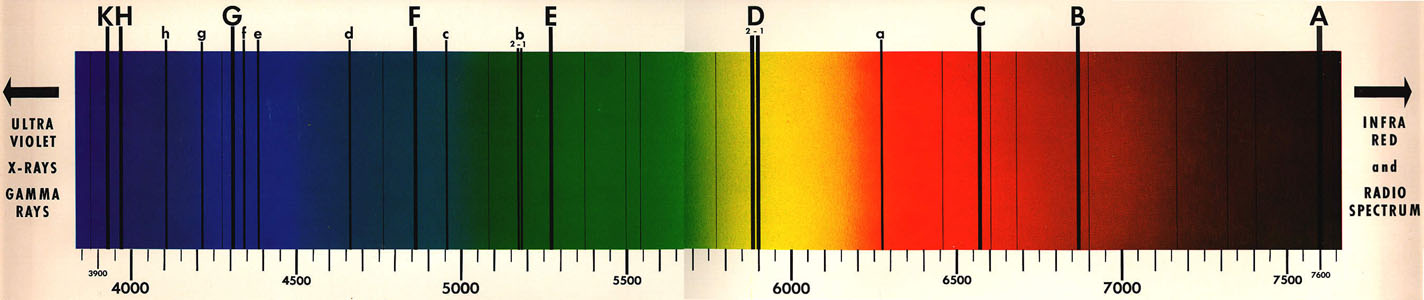
The figure above shows spectral lines in light from the sun. The wavelength scale is measured in Angstroms (1 mm = 10,000 Angstrom).
Modified from a lab from the University of Washington Dept. of Astronomy (original)
Adapted from Learning Astronomy by Doing Astronomy by Ana Larson
Summary
The student will identifies lines of the solar spectrum, using interpolation from "known" Fraunhofer lines.
Background and Theory
The brightest star in our sky is the Sun. Absorption lines in the solar spectrum were first noticed by an English astronomer in 1802, but it was a German physicist, Joseph von Fraunhofer, who first measured and cataloged over 600 of them about 10 years later. These lines are now known collectively as the "Fraunhofer lines." In the 1800's, scientists did not know that these lines were chemical in origin. Thus, the letters used by Fraunhofer to identify the lines have no relation to chemical symbols nor to the symbols used to designate the spectral types of stars. Today's astronomers use some of the designations simply for convenience and ease in identifying lines.
Now we know that each absorption line is caused by a transition of an electron between energy levels in an atom. Each element has a distinct pattern of absorption lines. Once the pattern of the lines of a particular element have been observed in the laboratory, it is possible to determine whether those elements exist elsewhere in the universe simply by pattern matching the absorption lines.
In this exercise, we work with the solar spectrum between approximately 390 and 660 nm (3900 - 6600 Angstroms) and identify some of the strongest Fraunhofer lines.
The figure above shows spectral lines in light from the sun. The wavelength scale is measured in Angstroms (1 mm = 10,000 Angstrom).
Table 1, below, lists some of the important and easily identified spectral lines. Note, the oxygen lines are for oxygen atoms in Earth's atmosphere.
| Table 1 -- "Known" Lines | ||
|---|---|---|
| Designation | Wavelength (Angstrom) | Origin |
| A | 7594 | terrestrial oxygen |
| B | 6867 | terrestrial oxygen |
| C | 6563 | hydrogen (Hα) |
| D1 | 5896 | neutral sodium (Na I) |
| D2 | 5890 | neutral sodium (Na I) |
| E | 5270 | neutral iron (Fe I) |
| F | 4861 | hydrogen (Hβ) |
| H | 3968 | ionized calcium (Ca II) |
| K | 3934 | ionized calcium (Ca II) |
- Identify (pick out) each of these "Known" spectral lines, A through K, on the figure above.
Table 2. More Spectral Lines. (Note: 1 nm equals 10 Angstrom)
| Wavelength (nm) | Line Width (nm) | Element | Wavelength (nm) | Line Width (nm) | Element | |
|---|---|---|---|---|---|---|
| 393.3682 | 2.0253 | Ca II | 440.4761 | 0.0898 | Fe I | |
| 394.4016 | 0.0488 | Al I | 441.5135 | 0.0417 | Fe I | |
| 396.1535 | 0.0621 | Al I | 452.8627 | 0.0275 | Fe I | |
| 396.8492 | 1.5467 | Ca II | 455.4036 | 0.0159 | Ba II | |
| 404.5825 | 0.1174 | Fe I | 470.3003 | 0.0326 | Mg I | |
| 406.3605 | 0.0787 | Fe I | 486.1342 | 0.3680 | H | |
| 407.1749 | 0.0723 | Fe I | 489.1502 | 0.0312 | Fe I | |
| 407.7724 | 0.0428 | Sr II | 492.0514 | 0.0471 | Fe I | |
| 410.1748 | 0.3133 | H | 495.7613 | 0.0696 | Fe I | |
| 413.2067 | 0.0404 | Fe I | 516.7327 | 0.0935 | Mg I | |
| 414.3878 | 0.0466 | Fe I | 517.2698 | 0.1259 | Mg I | |
| 416.7277 | 0.0200 | Mg I | 518.3619 | 0.1584 | Mg I | |
| 420.2040 | 0.0326 | Fe I | 525.0216 | 0.0062 | Fe I | |
| 422.6740 | 0.1476 | Ca I | 526.9550 | 0.0478 | Fe I | |
| 423.5949 | 0.0385 | Fe I | 532.8051 | 0.0375 | Fe I | |
| 425.0130 | 0.0342 | Fe I | 552.8418 | 0.0293 | Mg I | |
| 425.0797 | 0.0400 | Fe I | 588.9973 | 0.0752 | Na I (D2) | |
| 425.4346 | 0.0393 | Cr I | 589.5940 | 0.0564 | Na I (D1) | |
| 426.0486 | 0.0595 | Fe I | 610.2727 | 0.0135 | Ca I | |
| 427.1774 | 0.0756 | Fe I | 612.2226 | 0.0222 | Ca I | |
| 432.5775 | 0.0793 | Fe I | 616.2180 | 0.0222 | Ca O | |
| 434.0475 | 0.2855 | H | 630.2499 | 0.0083 | Fe I | |
| 438.3557 | 0.1008 | Fe I | 656.2808 | 0.1020 | H |
Using Table 2, identify the "Unknown" spectral lines labelled a through h in the figure of the solar spectrum above. Record your results.
Note: The wavelengths listed in the two tables have been determined in the laboratory here on Earth. Using these known spectral lines we can identify elements found in the sun and other extraterrestrial objects.