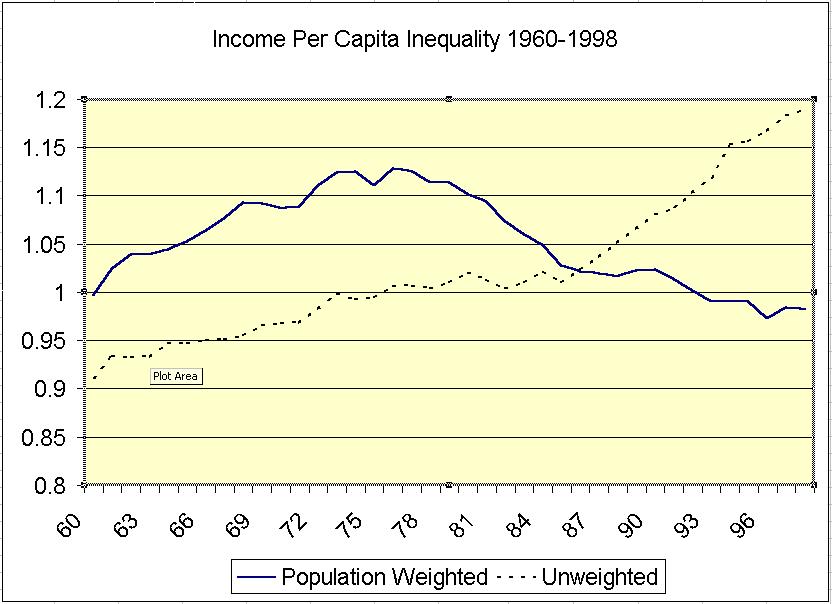
This picture shows income inequality across countries between 1960 and 1998. The dotted line shows inequality when each country has the same weight (that is, Lesotho is one point and so is China, even though China has a lot more people). This line could be labeled "inequality across countries"
The blue solid line is reflects inequality when we take into account the fact that China has more people than Lesotho. This line could be labeled "inequality across people".
We see that the unweighted inequality measure grows constantly. However, the population weighted inequality measure has been declining after 1975-1980. The main reason is that, during the 80s and 90s, two of the most populated countries in the world (India and China) have been growing a lot. This means that a large number of people (the citizens of these two countries) are benefiting a lot from the growth process: they are becoming "more equal" to US and European citizens, and this is why inequality across people falls even though inequality across countries does not.