The Demographic Success of the West Bank Settlements
December 2012
Technical Notes and Sources
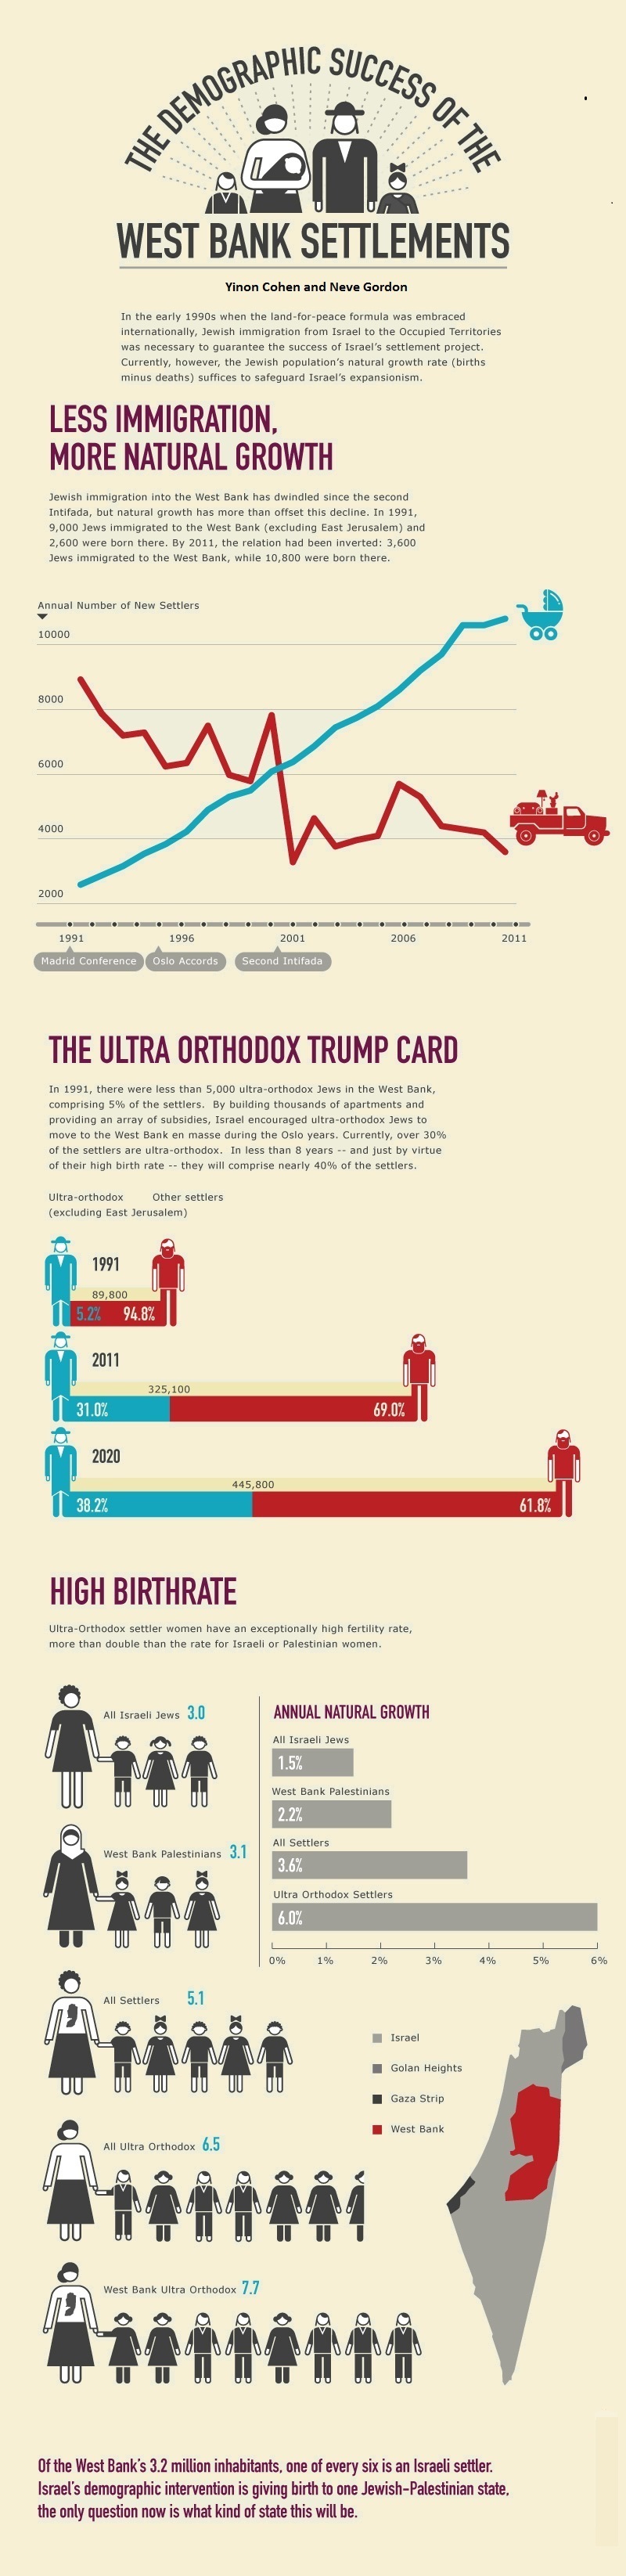
Figure 1: Less immigration, more natural growth
Source: Statistical Abstract of Israel, different years (1992-2012), Table 2.4, “Source of
population growth by district, population group and religion.” Settlers reside in the district of
Judah and Samaria. http://www.cbs.gov.il/reader/shnatonenew_site.htm
Figure 2: Ultra Orthodox Trump Card
Number of all settlers in 1991 and 2011: Statistical Abstract of Israel, different years (1992-
2012). Table 2.4.
Number of Ultra Orthodox Settlers is the number of people in Ultra Orthodox settlements (4,620
in 1991 and 100,880 in 2011). Source for population in Israeli communities:
http://www.cbs.gov.il/ishuvim/ishuvim_main.htm
Data Sources and estimation method for 2020:
All (445,782): Our calculations, assuming that the settler population in 2011 (325,100) will
increase by 3.57% per year until 2020. 3.57% is the average natural growth rate (births minus
deaths) in the district of Judah and Samaria during 2009, 2010 and 2011. Source for natural
growth of settler population: our calculations, based on information in Statistical Abstract of
Israel, 2010, 2011, 2012, Table 2.4.
Ultra Orthodox (170,435): Our calculation, assuming that the Ultra Orthodox settler population
in 2011 will increase by 6% per year until 2020. 6% is the latest estimate (2001) for the natural
growth rate of all Ultra Orthodox in Israel. Source: Gurovich, Norma and Eilat Cohen-Kastro.
2004. “Ultra-Orthodox Jews Geographic Distribution and Demographic, Social and Economic
Characteristics of the Ultra-Orthodox Jewish Population in Israel 1996–2001,” Working Papers
Series No. 5, Israel Central Bureau of Statistics. Page 54.
Other settlers (275,348): All settlers minus Ultra orthodox settlers.
Figure 3: High Birthrate and Natural Growth Rates
a. Natural Growth Rates
All Israeli Jews and all Settlers: Our calculation of average natural growth (births minus deaths)
for 2010, 2011, and 2012 for all Israeli Jews (1.48%), and for the district of Judah and Samaria
(3.57%).
Source: Statistical Abstract of Israel, 2010, 2011, 2012, Table 2.4.
Ultra Orthodox Settlers. Gurovich and Cohen-Kastro 2004 above.
Palestinians: Our calculations of average growth in 2008, 2009, and 2010. Source: International
Data Base, US Census http://www.census.gov/population/international/data/idb/region.php
b. Number of Children:
Palestinians: Total Fertility Rate (TFR) for 2010. Source: same as above.
All Jews and all settlers: Statistical Abstract of Israel 2012, Table 3.11. Data are for TFR in 2011.
All Ultra Orthodox: Hleihel, Ahmad. 2011. “Fertility among Jewish and Muslim women in Israel,
by level of religiosity, 1979-2009.” Working paper number 60, June 2011. Page 32.
Ultra Orthodox Settlers: The TFR (7.7) is the average for TFR in Betar Ilit (7.5) and Modiyin Ilit
(8.2), where the vast majority of Ultra Orthodox settlers reside, adjusted for a slight estimated
decline between 2007 and 2011. Source: Central Bureau of Statistics, Press release, Patterns of
Fertility in 2007. Number 231/20082007, page 5 (in Hebrew).