Stock Recommendation Website (Python Based)

Data Analytics Course Project


What does it looks like:

Check this Video!

Note: Because we run this website on Flask and python, but Columbia Server do not support this, so we can only show you this video:(


What does it looks like:

Front Page
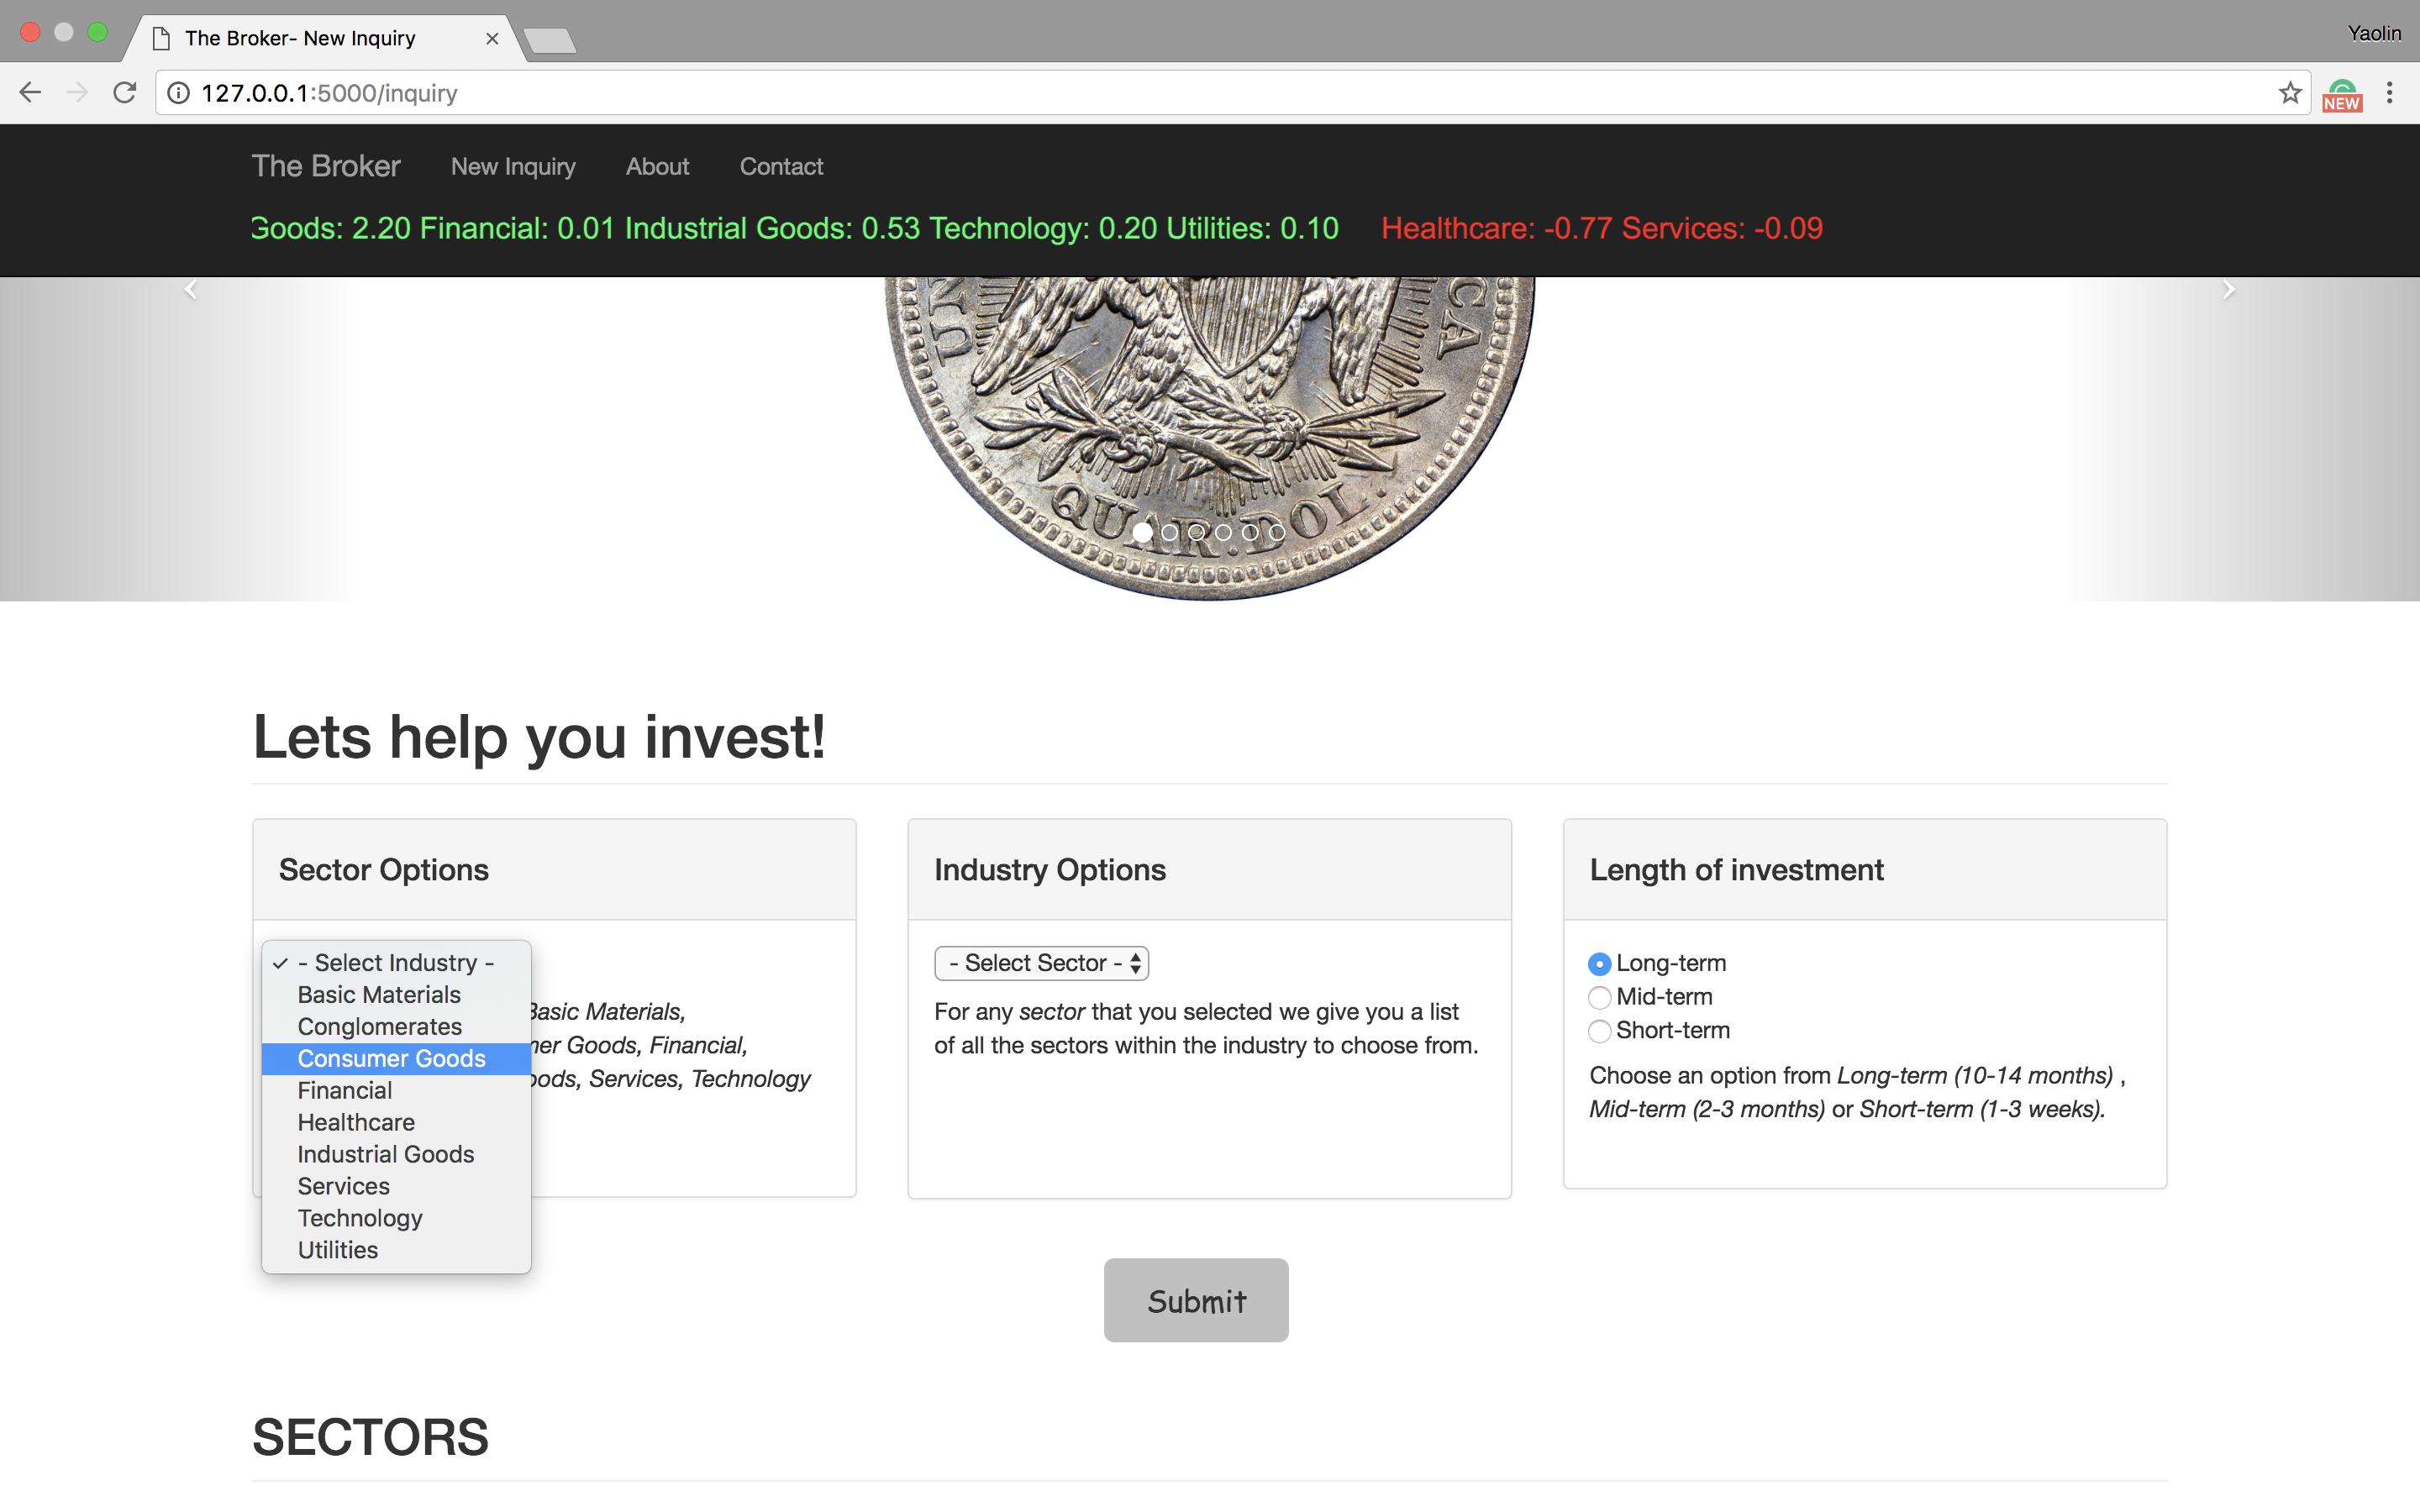
-This is our Data Analytics course Project. We used Python package Flask to be our website server.
-Our users can choose sector, industry they want to invest and their investment style. Accoring to these inputs, we would recommend 5 companies in this industry.

Result Page

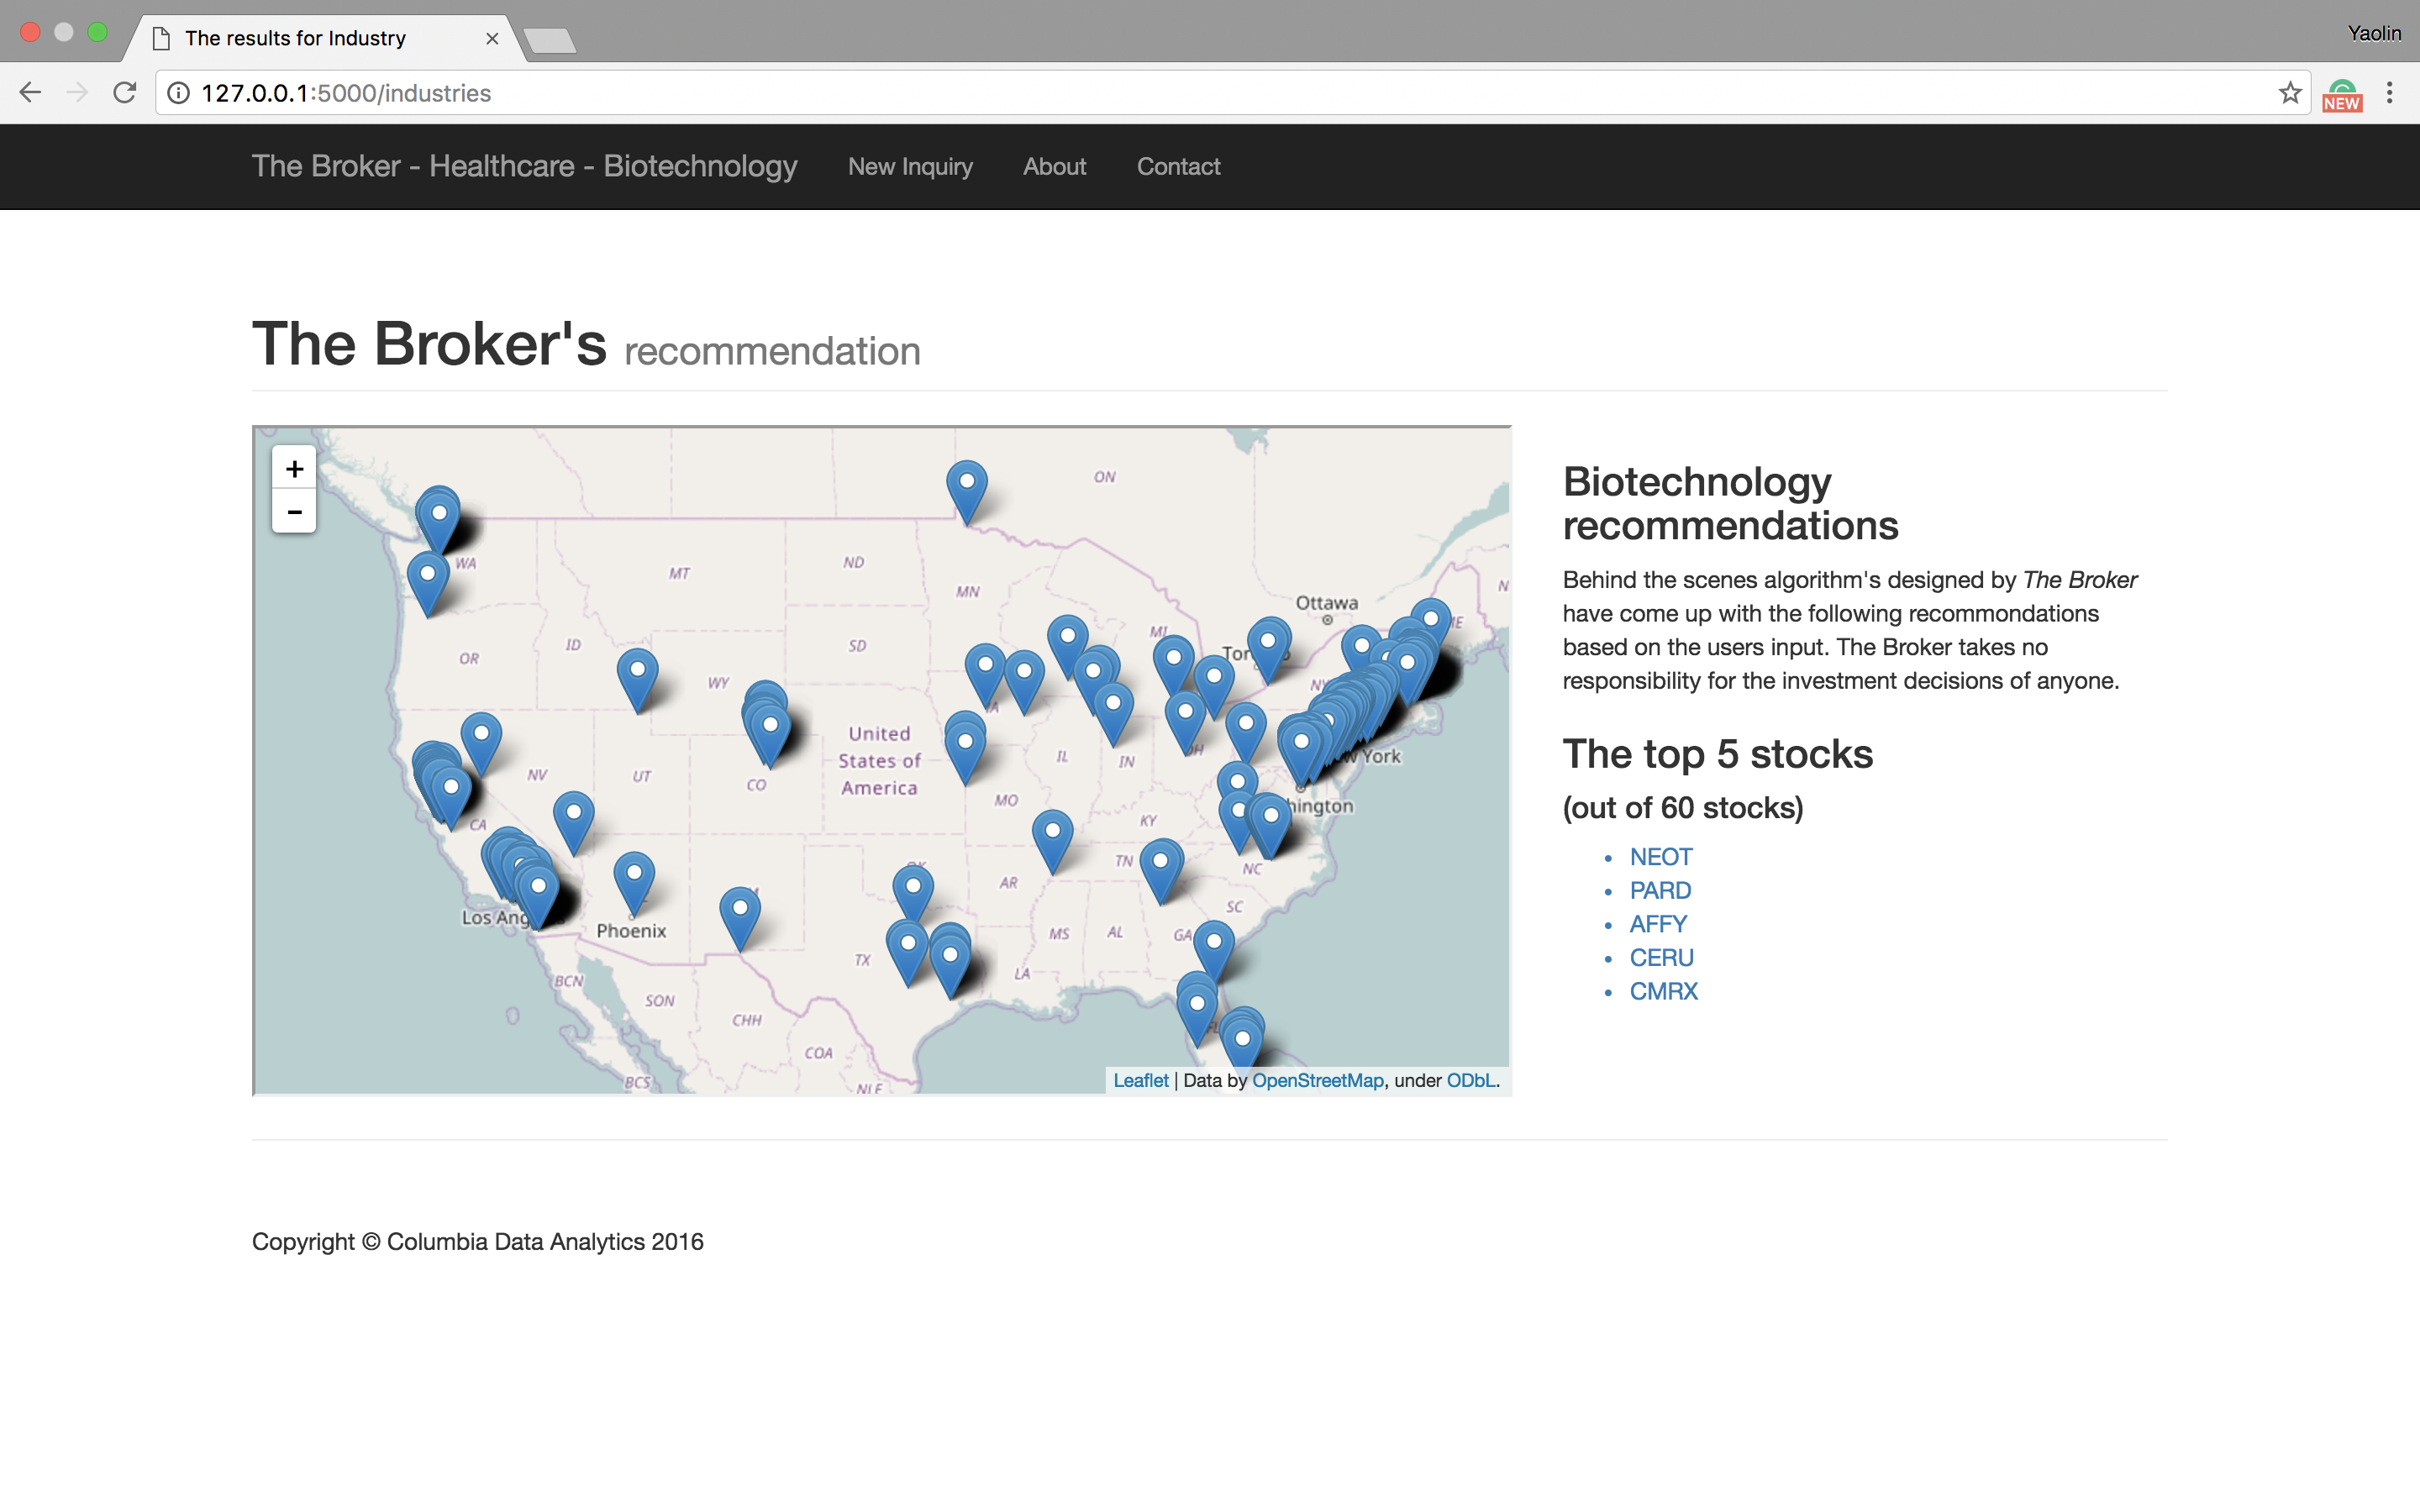
-On the right of this page, we give 5 companies we would recommend based on users' preference.
-We get all companies' geo-location in the same industry from Google Maps API and draw in the map shown on the left. We use Python Folium to draw this map.
-From this map we can see how this industry geo-distribution. It can easy tell from the map Biotechnology companies located in east and west coast.


Single company analysis

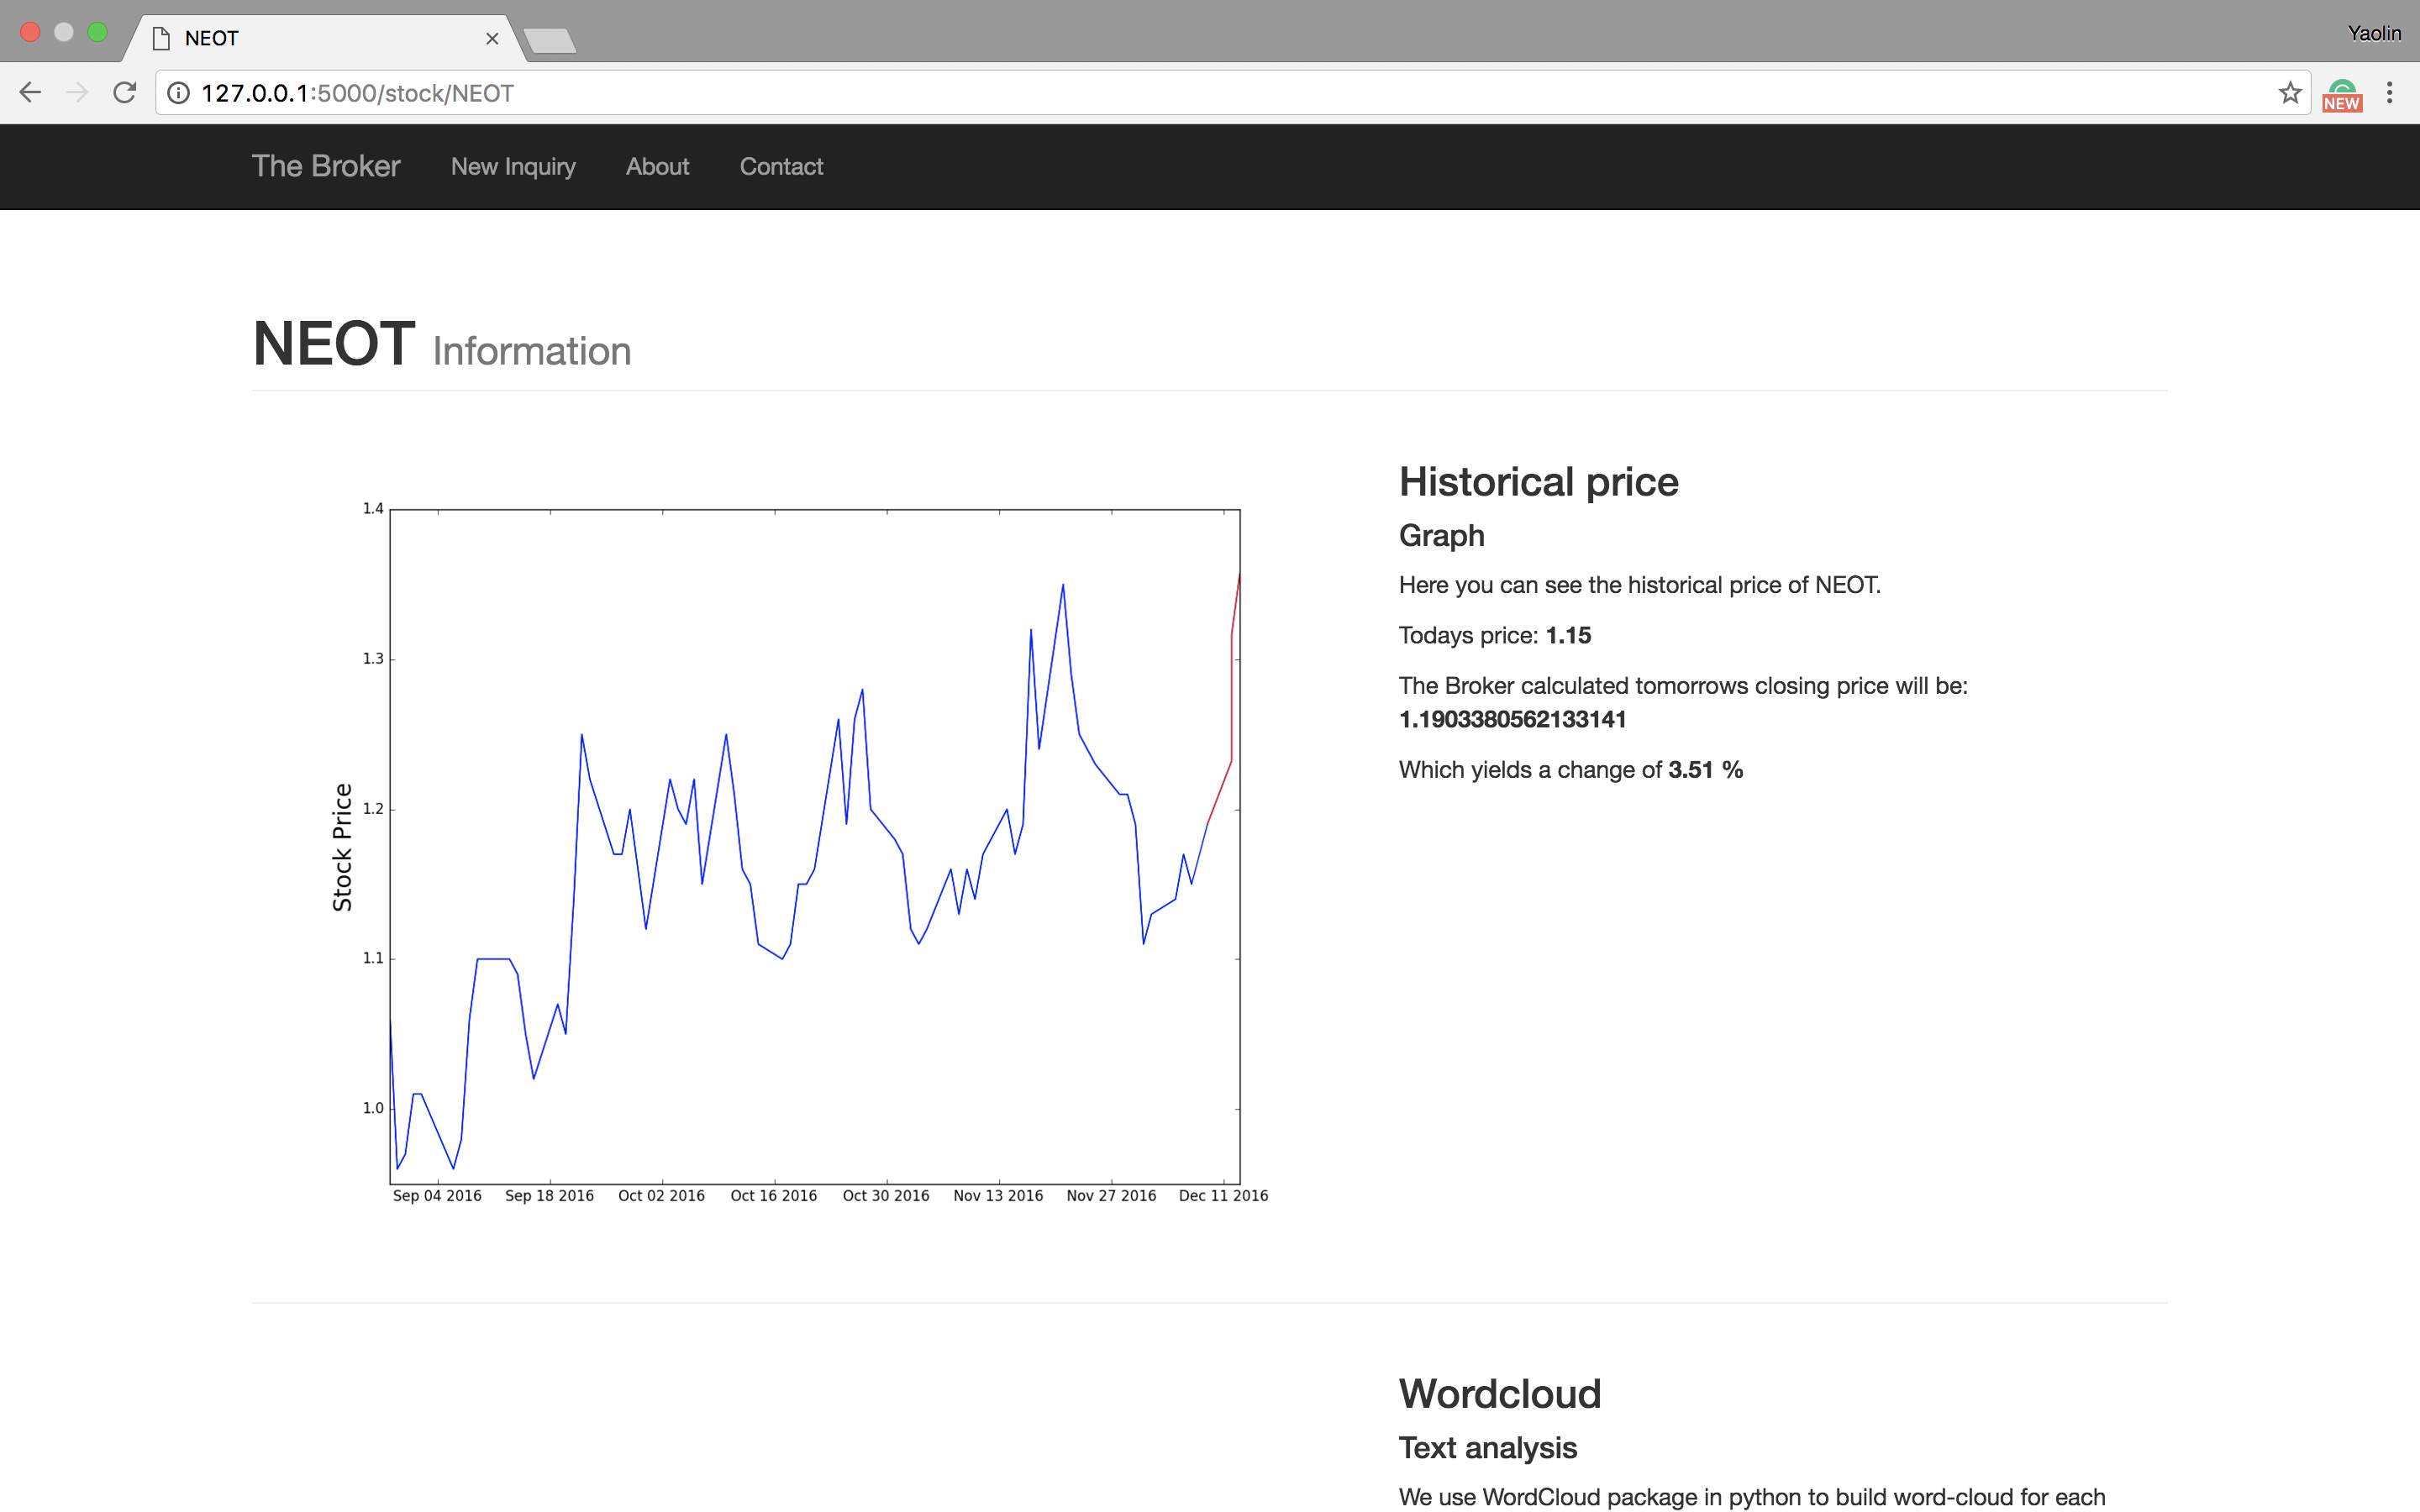
-We use ARIMA model to predict company stock price shown on the graph. Red line is predicted stock price.
- We stored historical data for each stock on MongoDB, and each time we run our model, we check for latest stock price and update our database accordingly.


Word-Cloud

-Word-Cloud can give us a quick glance of what's in the news! We used Python WordCloud package.
-We web scrapped this 30 latest news of this company from Google Finance News and draw a Word-Cloud for this company.


Sentiment Analysis

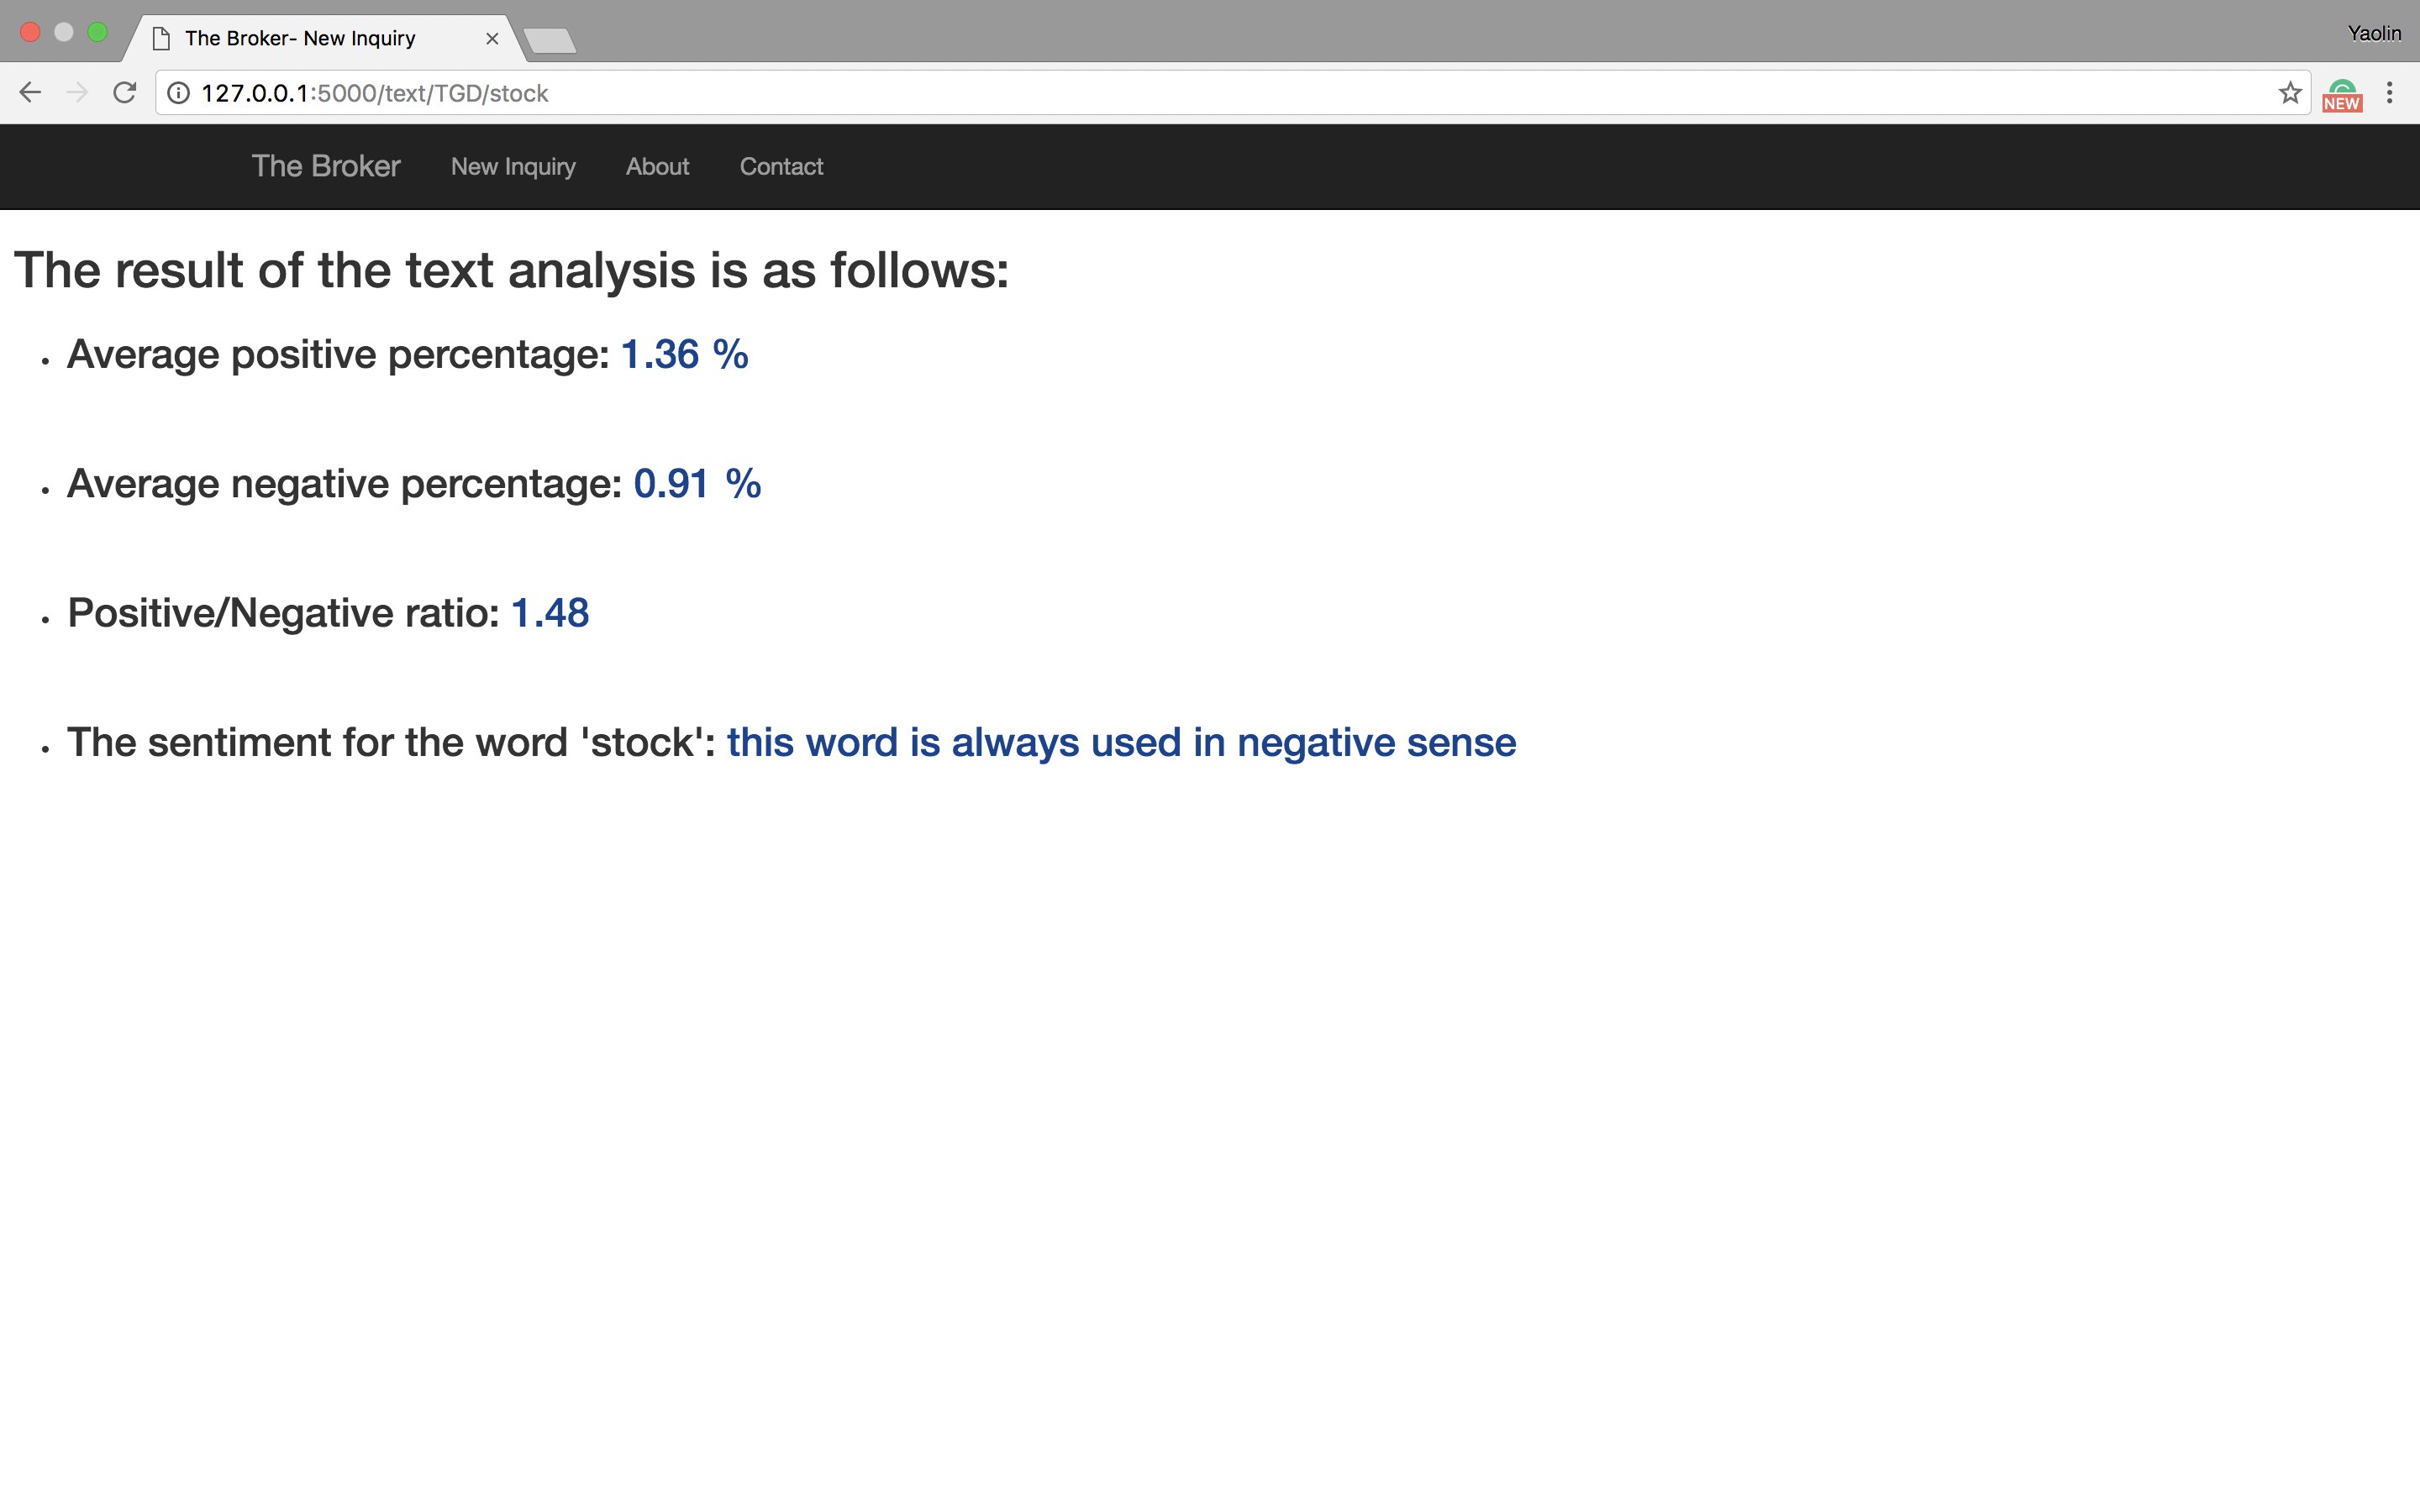
-We use Python NLTK(Natural Language Toolkit) to analysis company news.
-We analysis ratio of Positive and Negative words around entity(usually company name). Our positive and negative words libraries are from here(Positive) (Negative).
-Company has high sentiment analysis ratio means news are prone to praise this company.


NetWork Analysis

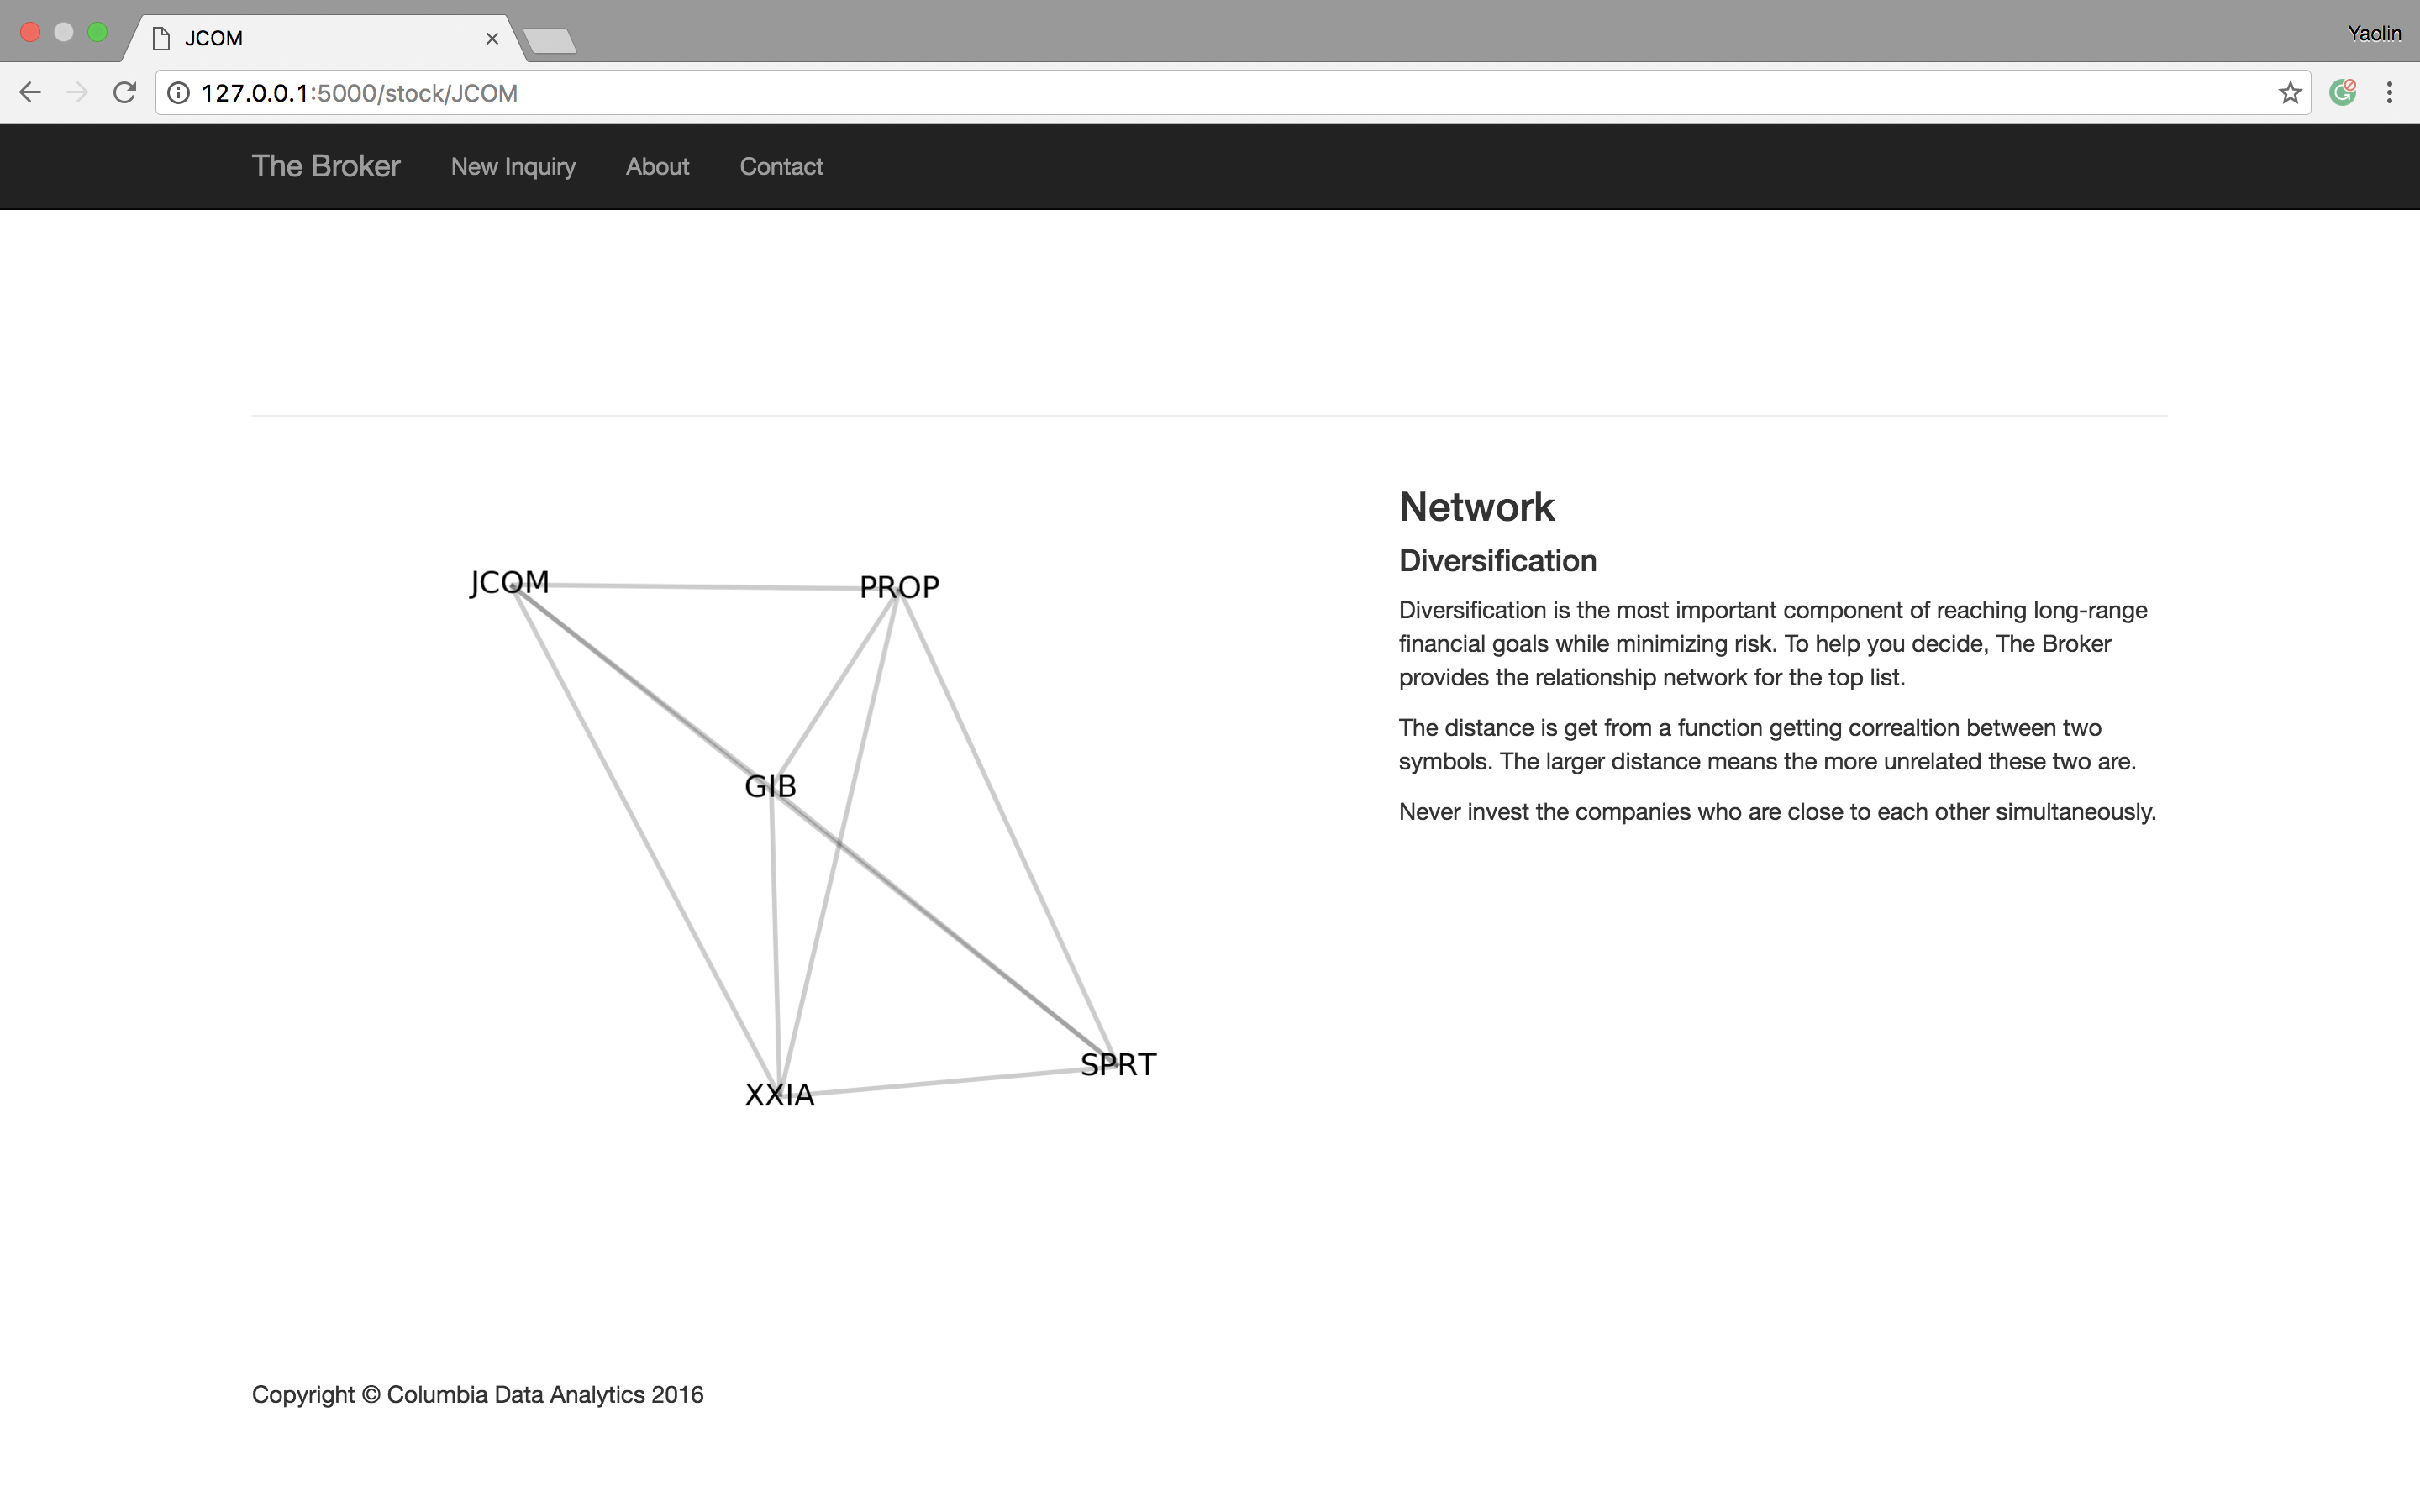
-We use Python Networkx to conduct network analysis.
-We use company historical stock return to conduct correlation analysis, based on this we give weights to length of each edge in network graph.
-Company in the center of this network graph is the most representative company in these companies.


Thank you

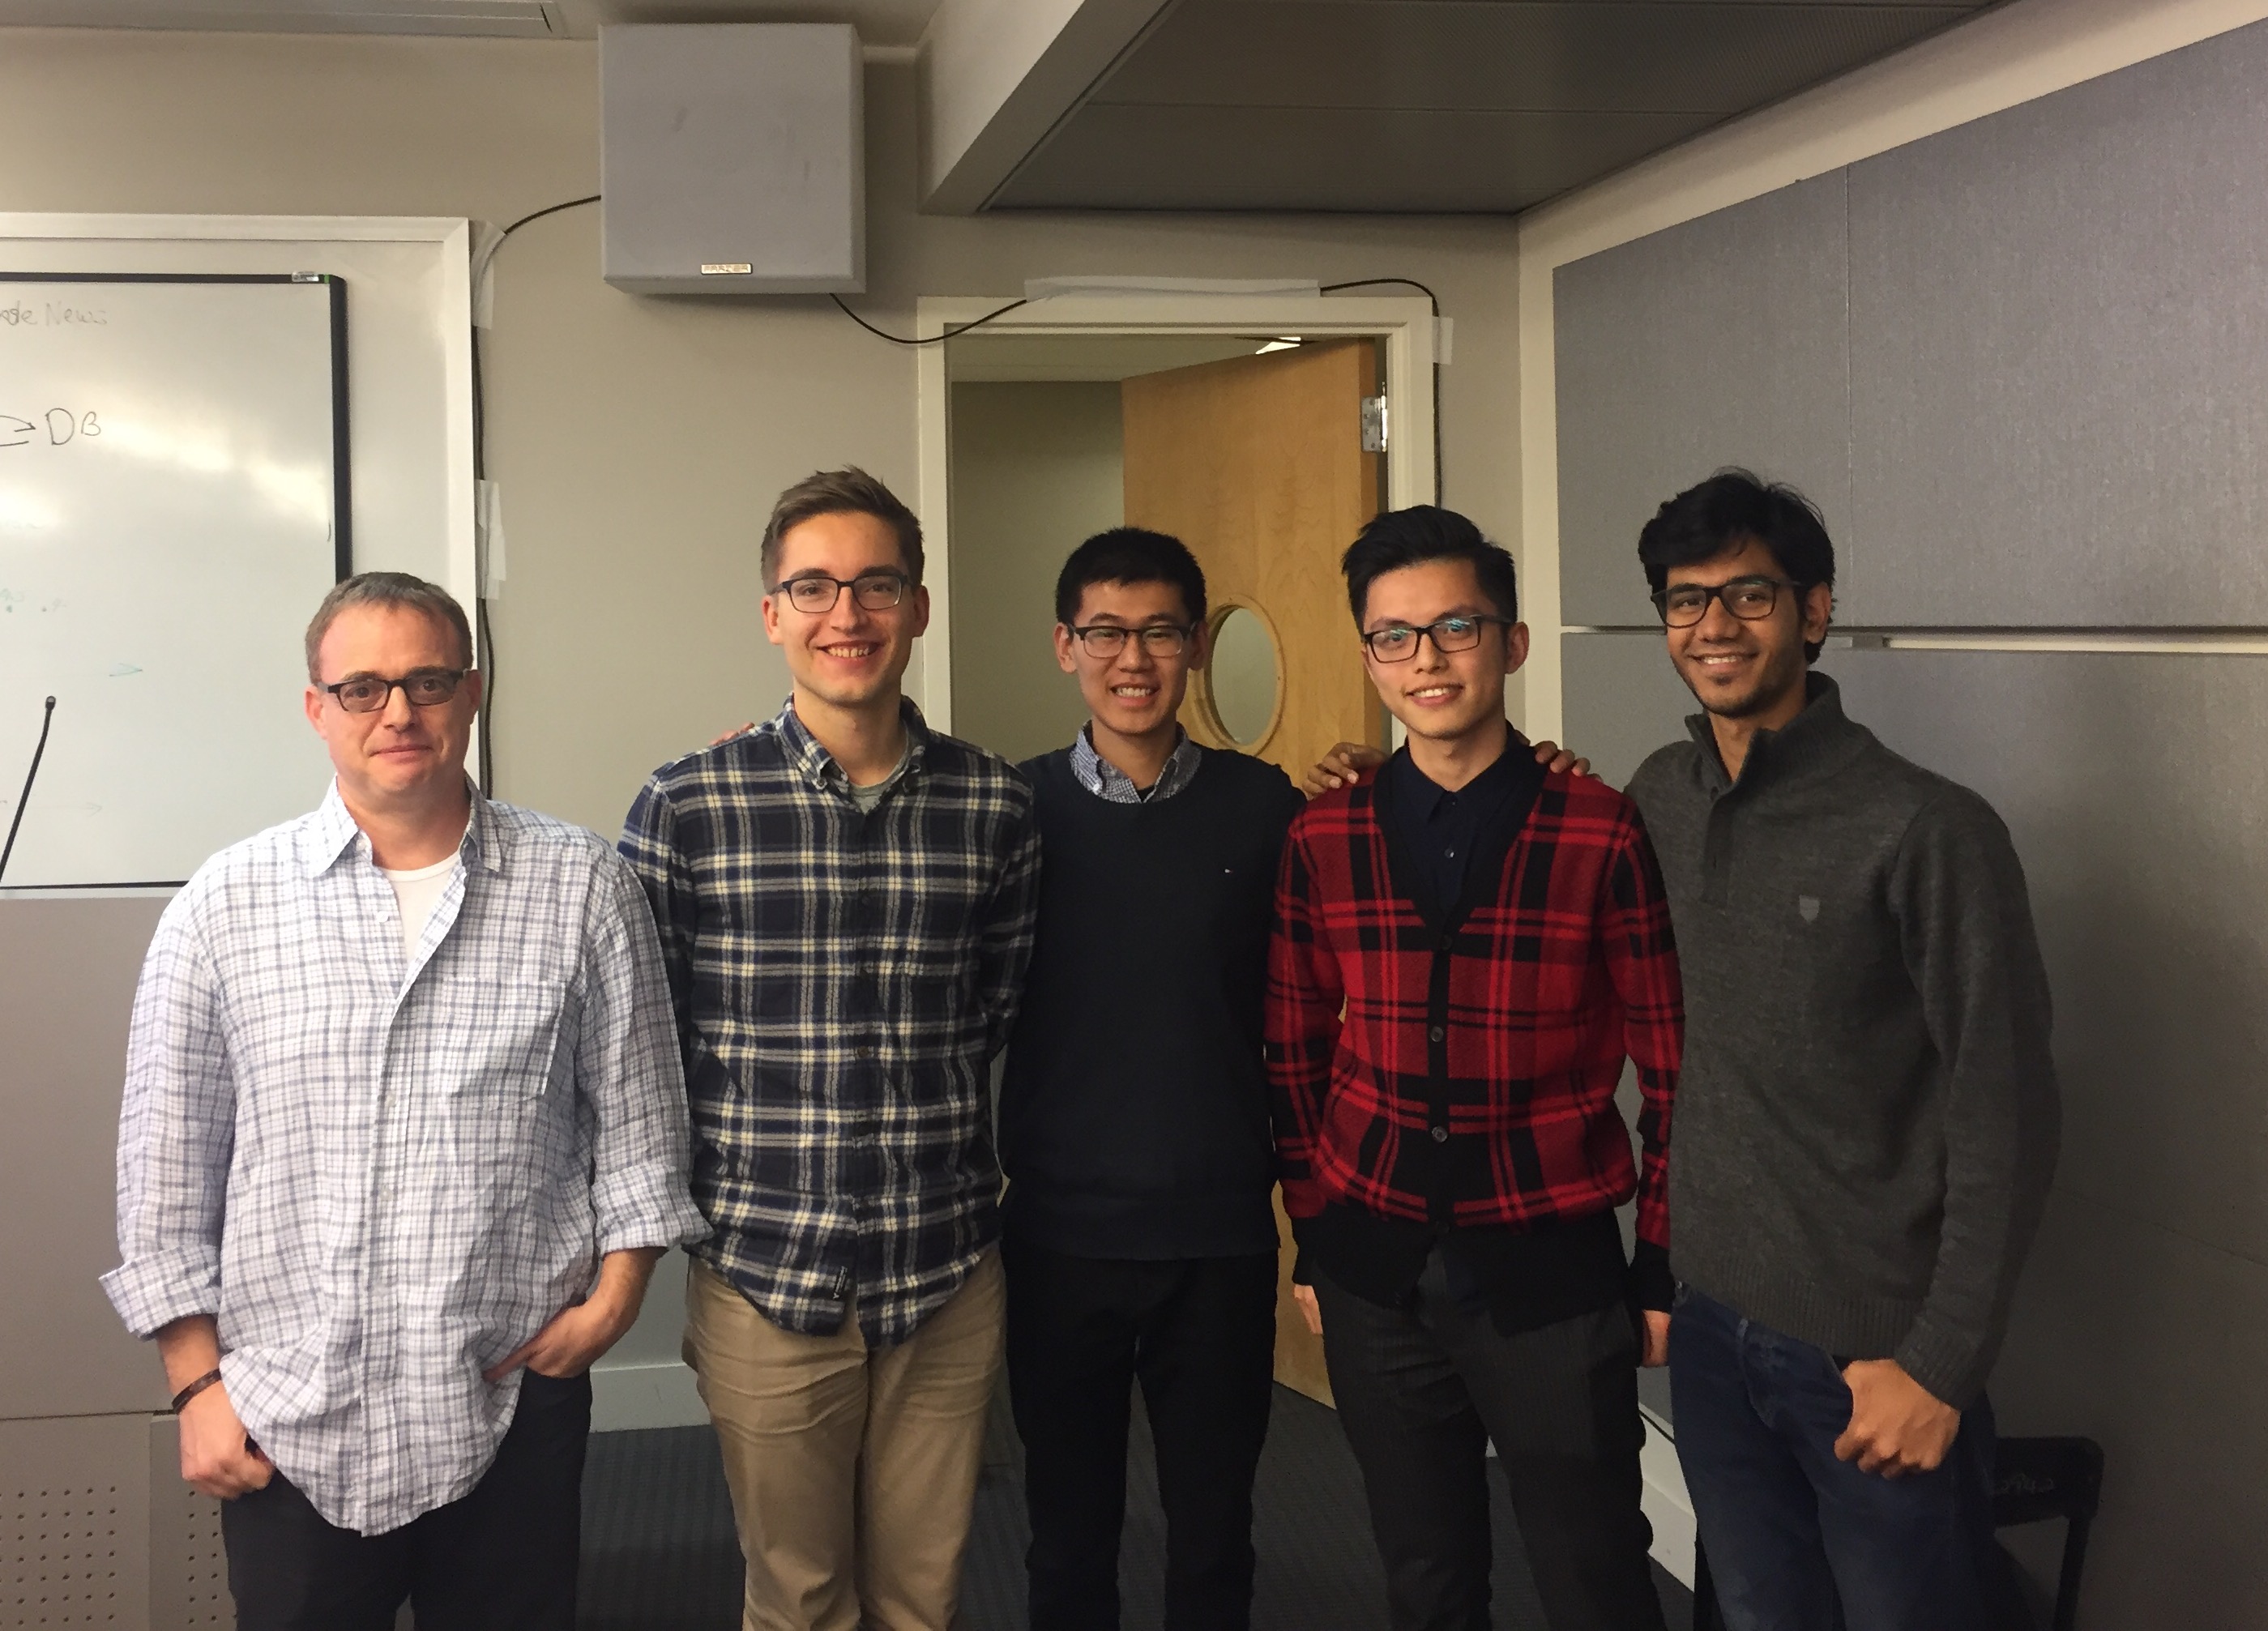
-Thanks to Professor Yair Avgar for his guidance and instructions.
-Thanks to all my teammates' great work and cooperation!