|
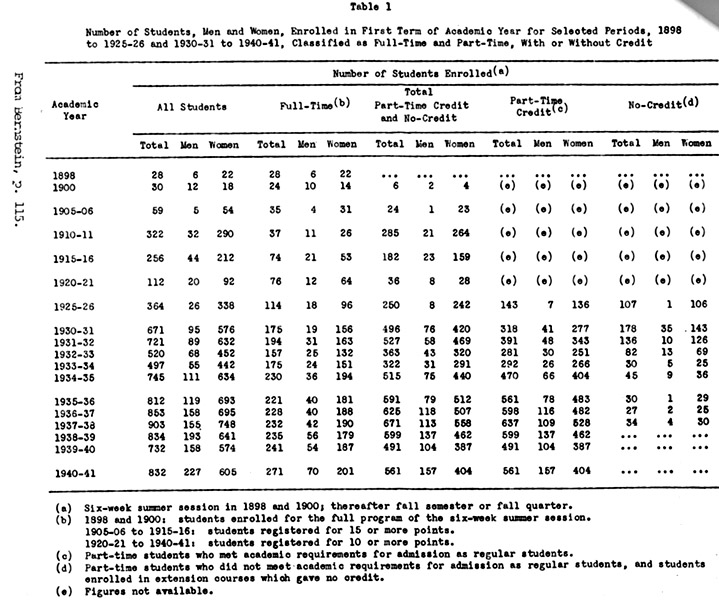
APPENDIX C NUMBERS, GENDER, AND BACKGROUND INFORMATION An oral presentation is not the occasion for complex tables or many numbers. Moreover, short of a major research investment and for lack of essential archives, it is not possible to convert fragmentary data from different periods into fully coherent ti me series. Yet some numbers are essential for the story and even limited numbers may raise questions, suggest trends, and sum up developments. Deans, Names, and Buildings By way of orientation we list the School’s directors (to 1940), deans, and acting dean, 1898-1998: Philip V. Ayres, 1898-1904 Edward T. Devine, 1904-1907; 1912-1917 Samuel McCune Lindsay, 1907-1912 Porter R. Lee, 1917-1939 Walter Pettit, 1939-1947 Margaret Leal - Acting Dean, 1947-1949 Kenneth Johnson, 1949-1958 Clara Kaiser - Acting Dean, 1958-1960 Fred Delliquardi, 1960-1967 Sidney Berengarten - Acting Dean, 1967-1971 Mitchell Ginsberg, 1971-1980 George Brager, 1980-1986 Ronald Feldman, 1986- The Summer School in Philanthropic Work (1898-1903), soon called the New York School of Philanthropy (1904-1919) and the New York School of Social Work (1919) was operated as a department of the New York Charity Organization Society (COS) in its buildi ng at 105 East 22nd Street, still the home of the successor organization, The Community Service Society, and other social agencies. In 1931, The New York School moved across the street to 122 East 22nd Street, into a tower of the Russell Sage Foundation b uilding constructed for it. It shared what may have been the country’s best (or one of the best) social welfare library. It also interacted with the many departments of the Foundation which helped shape many major studies and initiatives in industria l relations, social surveys, health, and charity organization. In 1949 the School moved, rent-free, into the Carnegie Mansion at 91st Street and Fifth Avenue and remained there until 1969 when the Foundation felt it had outgrown the building. The Miller House on the grounds had been the location of an active resea rch center from 1956. From the time of its academic affiliation with Columbia in 1940 it had been known as The New York School of Social Work of Columbia University. In 1951 it ended its formal COS connection and received its own New York State Charter. I n 1959, it entered to the Columbia corporation. By 1962-63 it was known as the Columbia University School of Social Work. The Carnegie Mansion’s horizontal floor plan, its spacious classrooms and seminar rooms, the wide corridors, the original Carnegie library, a large basement cafeteria which became a daily faculty-student gathering place, the lovely garden combined to provide the School with an environment still fondly referred to by those who experienced it. It is sorely missed. In 1970 (after an interim year on 110th Street) the School moved "temporarily" into McVickar Hall, then being vacated by the School of In ternational Affairs. A first draft of a plan for a new School building had been prepared by the distinguished architect, Edward Durrell Stone. There was a tentative site. But the politics of Columbia’s relationship to its neighbors-community from the late 1960s and the lack of adequate funding pushed planning aside. Available funds were assigned to McVickar renovations (and a further major investment was made in McVickar in the summer of 1996). With good spirit, students, faculty, staff have settled in, made the building serviceable and some of its newest features most attractive, and all have learned to compromise with an essentially inadequate vertical space. One doubts that this has affect ed the School’s basic mission. The question of a new building is again high on the agenda, however. Students and Faculty We begin, as they say, with the bottom line. The School has graduated about 16,000 men and women and has a worldwide alumni mailing list of 11,000, about 60 percent of whom are in the New York area. The School has provided more than its statistical share of deans, leading scholars and teachers, leaders of the social work profession – but it would require a comparative research project to document and to specify this in full detail. Plans had been made for 15 students for the 1898 summer class but 28 were admitted out of 40 applicants. Some were beginners but among them were some agency executives and academics. By the second summer, there were two sections: those with advanced ex perience or who had participated in the first class were separated from the beginners. As will be noted in Table I from Bernstein (1942) the total doubled to 59 by 1905-06 for the one-year program and jumped to 322 with the two yea r program in 1910-11, falling back in a major way during the War and immediate post-War years. These numbers do not tell the full story. Some students, while fully qualified, could not manage or were not sure they wanted or needed a full-time program. There were so few social work diplomas (or, later, degrees) that it was not a job requirement i n many places, although it apparently had advantages. Some took part-time courses on the basis of job experience but did not meet full-time admission requirements (a college degree or specified experience). Nonetheless, education and the supply of graduates created its own demand. Then came the private and (newer) public responses to the depression. The enrolled student total, much of it part-time and no-credit (Bernstein, Table I) soared to 671 in 1930-31, 812 in 1935-36, and remained at 832 for the start of the M.S. degree, in 1940-41. From a long-term perspective, the key numbers to observe is the full-time enrollment, for the two-year diploma until 1940 and the M.S. degree thereafter, or the graduation totals. The part-time and no-credit students were practitioners being upg raded and/or preparing to enter the diploma/M.S. program. The full-timers became the School’s major contribution to social work professionalization. Here the School built its pace slowly, rising above 100 only in the mid-1920s, to 194 in 1933 and 230 in 1935-36. The pace, apparently, could have been faster. Applications outstripped space, faculty resources, field work opportunities from the mid-1920s to the early 1930s, according to the directors’ periodic reports. A first solution was to increa se classroom space at 105 East 22nd Street. A second was the 1931 move to the Russell Sage building. Ceilings were put on full-time enrollment (under a Quarter plan). About half the applicants were being rejected in the 1930s. To keep the School nationall y representative it was decided to limit New Yorkers to one-third of the acceptance pool. This apparently proved difficult. New York City students made up the following proportions of the full-time student body in the seven years from 1934 to 1940: 16.8, 27.4, 29.6, 37.5, 39.7, 43.7, 48.3. The February 1936 graduating class had a New York City representation of 42.5 percent and additional state representation of 10.4 percent. By 1941 the New York City proportion was 49.4 percent and the additional N.Y. St ate portion 9.3 percent. As had been the case from the beginning, the remainder were well distributed for the rest of the country. The foreign contingent was barely visible in the pre-World War II years. While the Bernstein statistical series extends only to 1940, it is clear from the Deans’ arrival reports, which usually reported enrollment or graduations, that the post-World War II period saw serious growth – and it was managed. Looking onl y at full-time numbers, the total reached 571 in the 1948-49 academic year (also 1,035 part-time students) under a deliberate policy of keeping under 375 full-timers per quarter. After the School shifted away from its quarter plan (1923-51) to a semester plan (Jan. 1951) the full-timers remained in the 300-400 range throughout the 1950s. A graduating class, typically, was 150-158. The growth of new schools, especially in the New York metropolitan area, absorption of the post-War expansion, lower tuition i n public schools, and the demographic realities had changed the picture. Then, after some anxiety about applications, the 1960s saw an application increase that was again substantial. The School grew as it could, tried to be more selective and began a transition once again to an application procedure which did not require p ersonal interviews. The full-time enrollment was 449 (24 were doctorate) in 1965-67. Since then, declines in federal social work fellowships, demographic fluctuations (college graduate totals), the status of social work in career planning, and the attract iveness of – or a fear of – New York City have created new fluctuation. (See Appendix C, figure 1). One notes what became an anxiety-provoking application fall between 1976 and 1982 from approximately 1,300 to approximately 400 and then modest s teady growth to the 600 level. In the face of this, without visible decline in student body quality, the enrollment declined (full-time) from 400 to 300 to 275 in 1989. As seen in Table III, the graduation totals in the mid to la te 80s fluctuated in the low and mid-200s to the 300s, then rose to the high 300s and have settled in the 400s. The application pressure is once again severe. New York, Columbia, CUSSW are in a period of high popularity and circumstances produce a high-qu ality, multi-ethnic, international student body. Demography, the shifting attractiveness of social work, and cost factors seem to determine the flow. The administrative and faculty continue to protect the quality of the student body and the educational ex perience offered and to be cautious about future growth. In all of this, enrollment trends for CUSSW from the mid-1950s to the present generally follow those for graduate social work schools nationally as compiled by the Council on Social Work Education: growth from the 1950s to 1978, a serious fall 1975-86 and a bottoming out to a 15 year low, followed by steady growth since 1986 and new highs in recent years as undergraduate colleges produced larger cohorts. During this century of enrollment the U.S. has gone from 1 to 4 to 122 graduate social work programs. The New York Metropolitan area went from 1 school to 8. There are no minority data for the earlier years under earlier "color blind" policies, but clearly African-Americans and Hispanics were under-represented among students and faculty. The African-American/Hispanic subgroups in the student population grew significantly as a result of special recruitment efforts and some minority scholarships in the 1960s. The CSWE administered one such federal (NIMH) fellowship program as well. It would require a special data collection and analytic effort to allocate the growth among the changing applicant and recruitment pools, special efforts within the School – which were constant, special programs such as the Title XX minority training program which brought welfare department people in for degree training – and other factors. In any case, the minority subgroup in the student body reached a steady 15-20 percent by the 70s and has since maintained that level and grown. While categories have tended to be sub-divided as the diversity of minority and foreign stu dents increased, a relatively coherent picture can be drawn for the past two decades. (In what follows we combine with Hispanics Puerto Rican "islanders" and "mainlanders" and we classify as Asian those students not identified specifically as on student v isas from Asian countries). With some fluctuations and declines, the combined African-American and Hispanic "minority" totals have been in the range of 11.3 percent to 20.8 in the period 1983 to 1997, with the average at about 17 percent. During the earli er years, the African-American proportion was almost double the Hispanic, reflected the size of the eligible cohort. The gap clearly is narrowing. Students of Asian background were very few at first, then matched and sometimes exceeded the Hispanic group. As of 1997 they were a visible presence among minority students (African Americans, 13.5 percent; Hispanics, 7.3 percent; Asians, 12.2 percent; Whites, 66.5 percent). White students had been 80-85 percent of the total from 1983-90, were between 75 and 80 percent to 1997 and, most recently, fell below 70 percent. We do not know whether the trend will be sustained. We do know (CSWE) that nationally that minority enrollments have been in the 20-25 percent range, but the particular minority groups vary with the region and the sub-classifications by university. The proportion of "white" students at Columbia tend to be within 5% of the CWSE pattern. Gender The student body has been dominated by women from the start and the proportions have not changed much over the years. In 1925, 1930, 1935 males constituted, respectively, 16, 10, 18 percent of the classes. They ranged from the low 20s to the low 30 s in the 1940s and 1950s except for an immediate post-World War II "G.I. Bill veteran" spurt which quickly faded (46.1 percent in 1946). Males were 22.6 percent of a 1956 graduate census although they constituted a third of the 1961 class. Whether one cou nts enrollees or graduates they were 25-29 percent of the classes in the 1970s and 1980s, then reverted to the 1920s proportions in the 1990s – typically 15-16 percent of graduates; occasionally fewer (14.3 percent in 1994). CSWE data show similar tr ends for the country: males 17.2 percent in 1991, 17.5 percent in 1995 and 16.5 percent in 1996.) Throughout there have been gender differences in career lines. Of the 1941 graduates 50 percent of the men and 62.9 percent of the women had concentrated in casework, 12.8 percent of the men and 2.5 percent of the women in community organization. The m en were also more likely to have been in group work (6.9 percent) and research (2.3 percent) than the women, for whom the corresponding proportions were 1.6 percent and 0.5 percent. A 1956 survey of graduates found the men more heavily represented in executive and subexecutive posts than women graduates (56 vs. 27 percent). The survey of 1989-1995 graduates did not report career lines by gender. The academics who came from John Hopkins and other universities to teach in the new social work programs were all males but by the time the School had a full-time faculty and taught the practical work, women were included. By the 1920s women had a nume rical edge and have continued to outnumber men, but not in proportions that match the student body. Indeed the percentages have been close in some years or reversed. (Nationally, female graduate faculty have tended to outnumber male by a slightly higher ( 5-10%) margin than at CUSSW). However, all the directors/deans have been males. There have been several very influential female associate directors/deans from Margaret Leal (1937) to Grace White (1951), Gordon Hamilton (1952), Clara Kaiser (1958) and now, Peg Hess. Leal and Kaiser also served as acting deans, as seen above. When the School had its own Board, all the Board chairs from the beginning were male, until the fifth, Mrs. George Brewer, elected in 1955. By then there was seven female trustees on a board of 20, an increase from 3 in 1948, 2 in 1951, and 6 in 1950. The Board became an Advisory Council when the School joined the Columbia corporation in 1959 and the female representation grew substantially. The School began with a national and international student body and prided itself in the fact. Through the forties bulletin covers often highlighted geographic representation on marked maps. Nonetheless, the majority of students derived from the Northe ast. As the years went by and schools developed in other regions, the Northeaster proportion grew. Applications far outstripped space and we have mentioned the apparently not fully successful effort to limit New York students in the 1930s so as to remain "national". With the Depression and FERA, government funds lent support for founding or expansion of undergraduate and some graduate programs in the midwest in what had been the land/grant colleges. This affected the flow to existing schools. There was further exp ansion in every decade and every region thereafter as all universities considered social work and – in the 1930s and thereafter – most M.S. program considered doctorates. While still more nationally representative than most, Columbia currently d raws most of its students from the tri-state area: New York (57.1%), New Jersey (8.1%), Connecticut (8.1%) – according to a survey of 1989-95 graduates by Prof. Ada Mui and Samuel Cotton (unpublished). California follows on the list, as it has for so me time. The other students are from scattered locations around the country or from foreign countries. Foreign students were mentioned in annual reports from the beginning. In its second year as a full-year School, New York drew students from England and Canada as well as fifteen states. By 1908-09 Cuba, Japan, Italy, Canada and England were represented in the student body as well as 21 states. The post-World War II foreign build up was reflected in a special "foreign student" program in 1952 and accelerated by the important by short-lived Joseph Hirschorn foreign fellowship program which financed 14 of that year’s 40 foreign students. By the time of the 1956 graduate census all states in the continental U.S. were represented among the 4,000 graduate respondents with concentration along the Atlantic Coast, in the mid-west and in 26 foreign countrie s, the latter counting only non-U.S. citizens. As Europe developed its own social work education, largely undergraduates in the U.S. sense, the flow to the U.S. for basic social work professional education slowed considerably. A few Asian countries and Israel became major foreign student sources. T he entire picture changed in the 1980s and now Southeast Asia is the major foreign origin for the substantial foreign student group (as it is in the rest of the University). We lack the basis for a precise analysis in the present context because Universit y statistics have not consistently separated Asian-American and immigrant Asians from Asian student on student visas.
Career Lines and Curriculum Choices Of recent graduates who responded to a mail survey (Mui and Cotton, 1995) half had come to CUSSW as part of a career change, 8-12 years after earning a B.A. Those at the McVickar building averaged 31.5 years of age, those at Purchase 32.5. Their M.S. concentrations had been as follows:
They had chosen the following field of practice concentrations when in school:
They were working in:
In the following settings:
Half of the pre-1956 graduates had been supervisors or executives. Only one-third were in public employment, despite the depression-era program developments. However, the biggest shift, seen in a 1994 graduate survey, showed 11.7 percent in private "for profit" employment. The 1989-95 survey offers more detail: 3.4 percent in full-time private practice or consultation and 12.2 percent in part-time practice or consultation. Tables for Appendix C: |
||||||||||||||||||||||||||||||||||||||||||||||||||