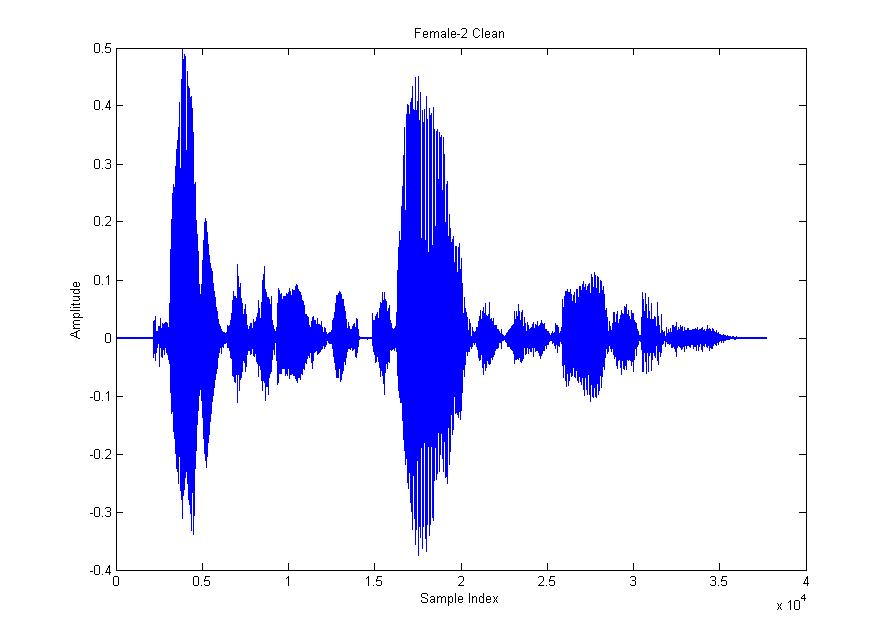
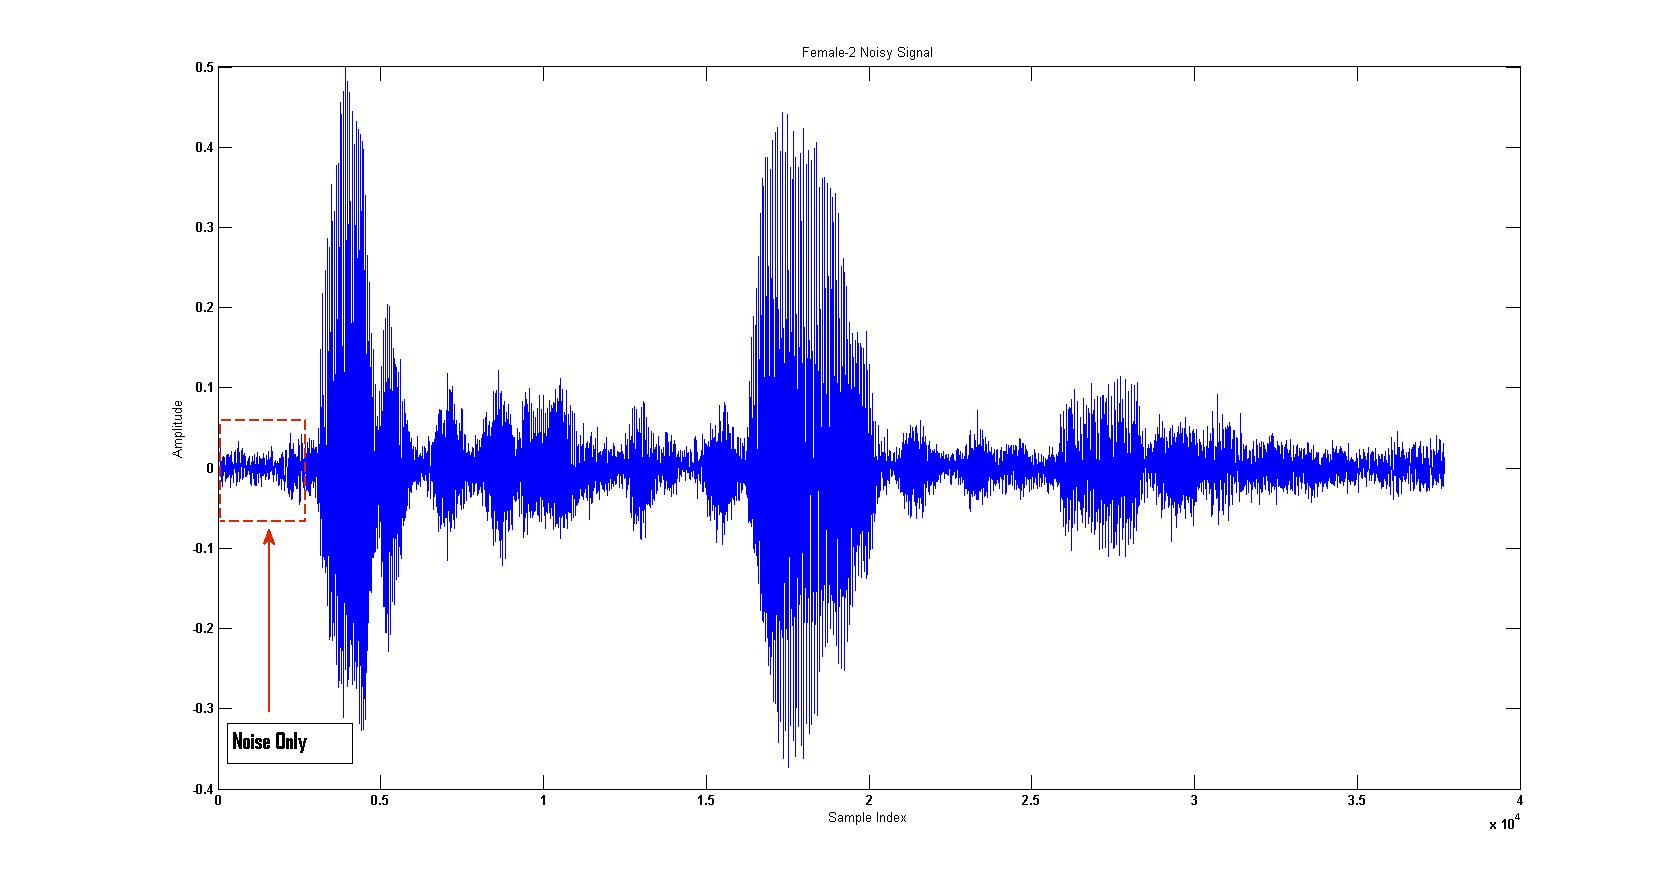
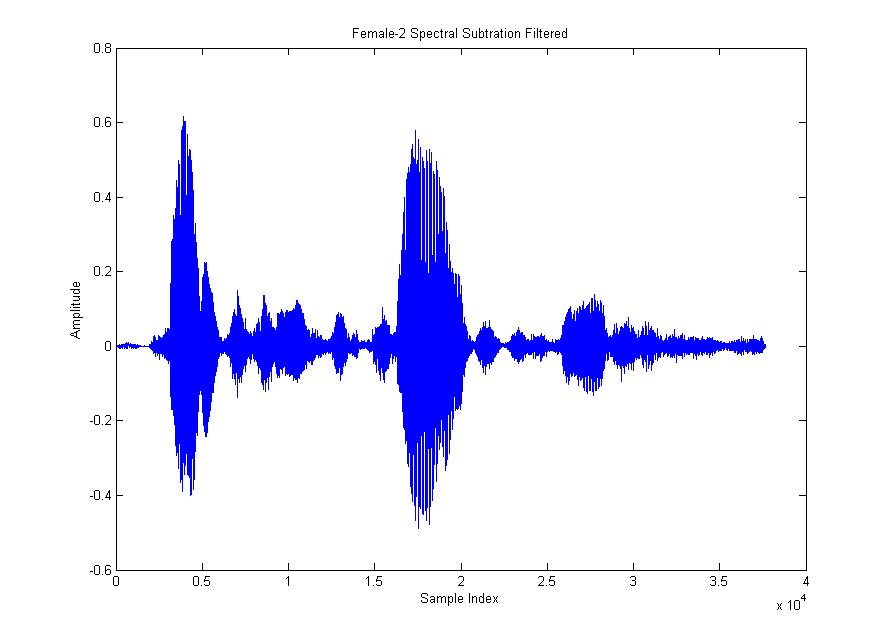
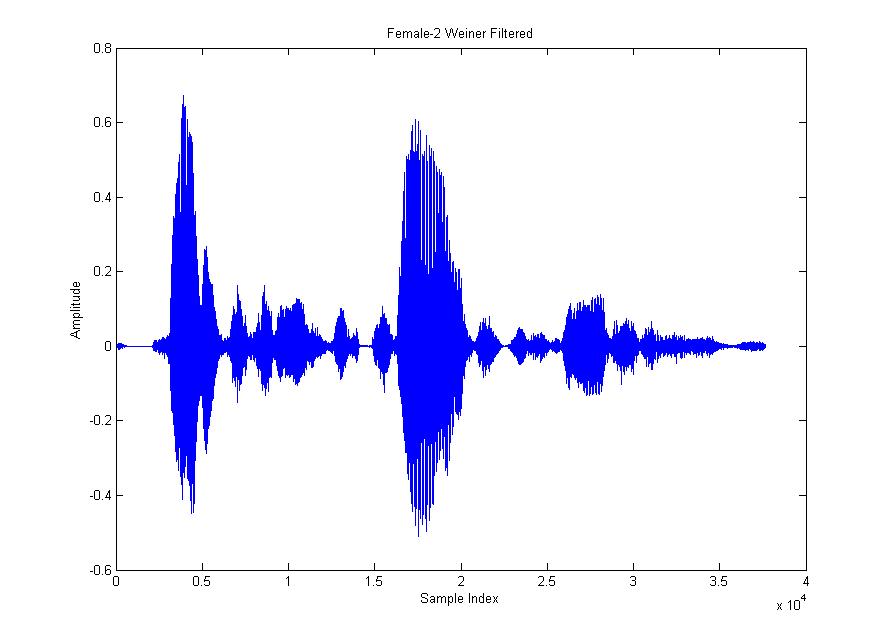
A total of 36 noisy signals were filtered using the two methods. The filtered signals were then compared against the 6 base signals that were clean. A sample set is presented below. The signal was about 2.4 seconds long, which at a sampling rate of 16000Hz translated to about 38000 samples. Shown below are the clean, noisy and filtered signals in the time domain for a particular signal:
| Images | |
|
|
|
|
As can be seen the noisy signal is more �jittery� than the clean signal, thus representing the noise. The noise is more or less low level since even in the noisy signal; the general shape of the clean signal is maintained. The initial period of 0 amplitude in the clean signal is the part of the noisy signal, highlighted by the red box, that is used to characterize the noise in the noisy signal since this part only contained noise. Both filtering processes, match the profile of the clean signal with Wiener filter having a more closely matched profile upon close inspection. However such close inspection is not quantitative and hence the usefulness of the correlation values makes itself evident.