Introduction to python 2018
In this tutorial, I'll go over the basic steps to install python anaconda. This steps will be crucial and can save you some time.
To do this homework, you need to download python anaconda 2.7 using the following link https://www.continuum.io/downloads . Installing this process may take some time.
Once this process is completed you'll be looking for the program spyder in your computer. Although this process might be different for Mac a quick search for anaconda navigator or spyder should bring up to the following prompt.
Changing Working Directory
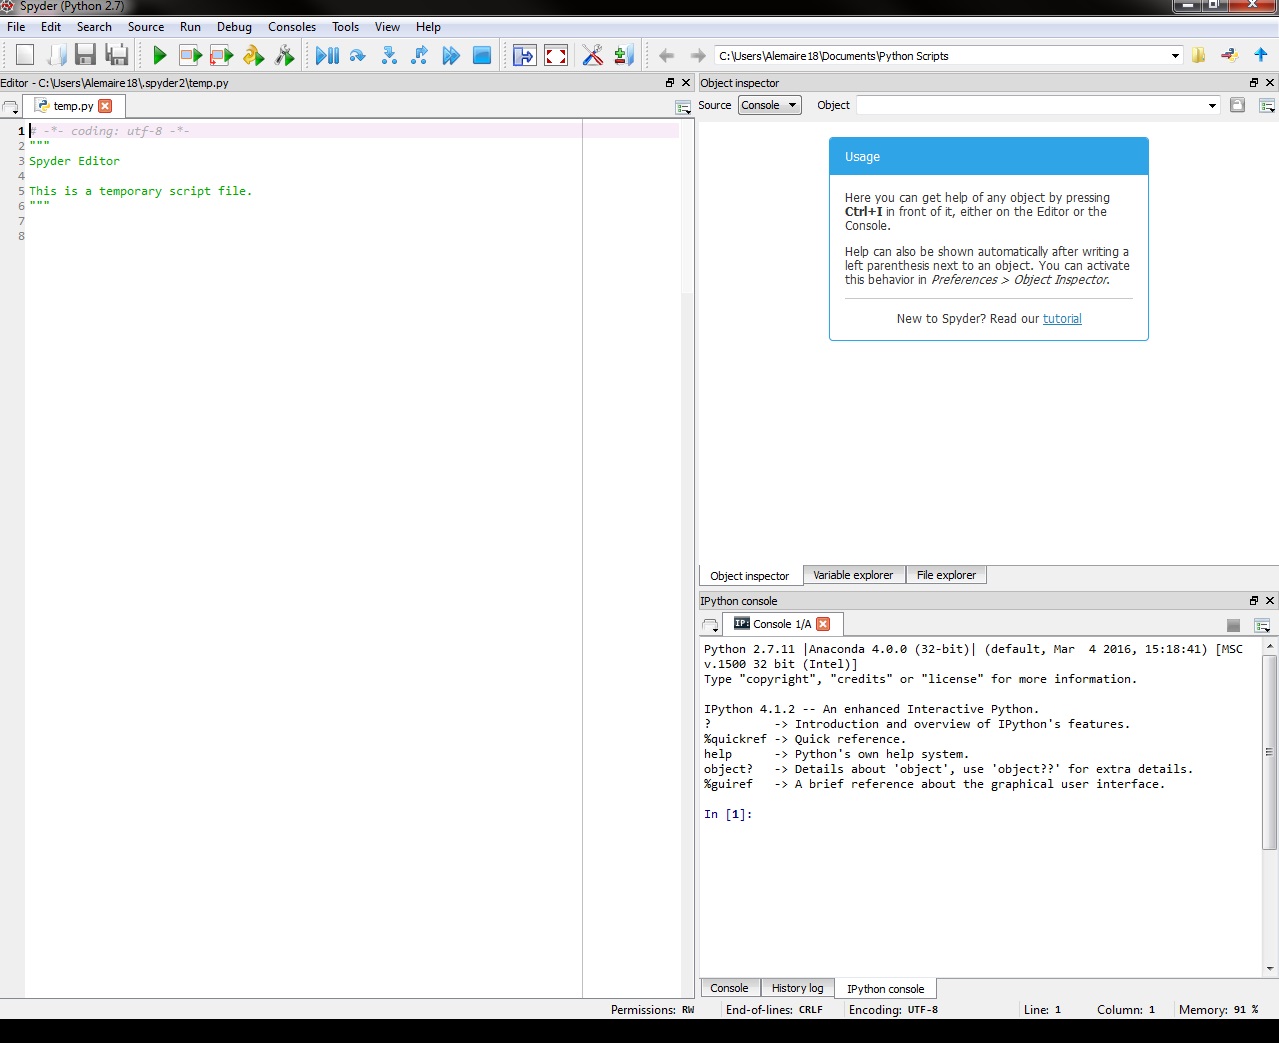
In order to read the files for the homework, you'll need to save all the files given to you(yelp.stop, yelp_homework.csv, etc.) in a directory. To change your working directory you need to change the address bar in the top right of your page by clicking on the "yellow folder" and go to the location you saved all the files provided. you are looking at the green arrow

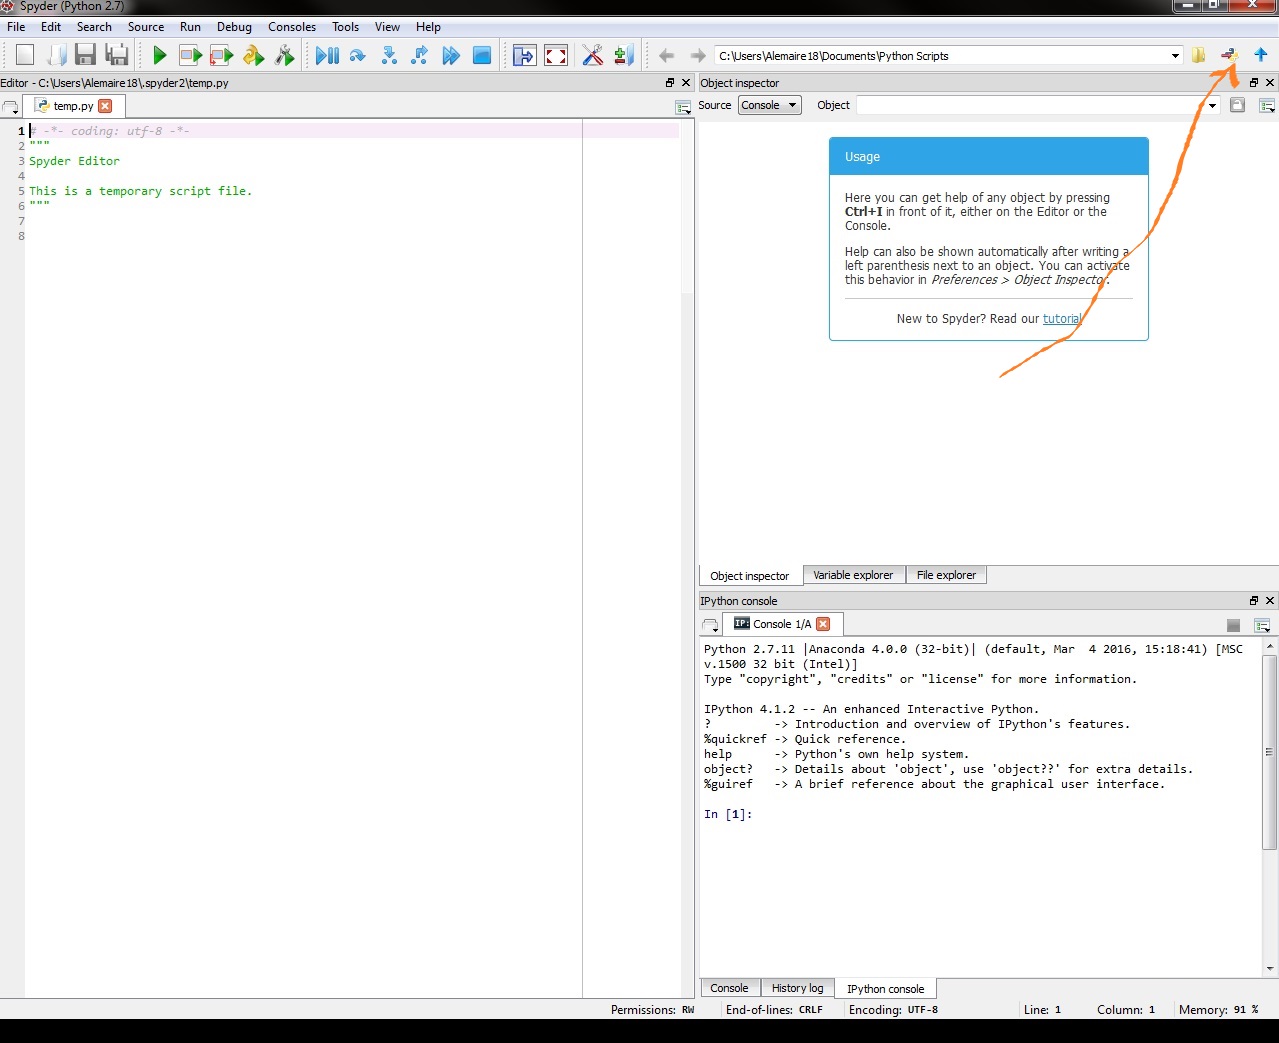
Once you have found the folder where you put all your files, you'll need to set it as your current directory to do so you'll need to now click in the python icon (the blue and yellow icon) next to the yellow folder. See the orange arrow.
Success?
To confirm that you have succeeded, then click on the "File Explorer" to the right of the screen. If you see the files that are in your directory then you can proceed.
Getting Started with Python Spyder
Python spyder should be similar to R-studio at this point. The console should be at the bottom right of the screen with the text editor to the right.
Installing stopwords
Before trying all the codes in the text_analysis.html supplement you need to download the nltk stopwords corpus. This corpora, body of text, contains all off-the-shell stopwords that you need to go over the supplement. Without this you'll get an error when you input the command stopwords.words("english").
To install the stopwords, got to the console and type the commands
nltk.download()

You should see a new prompt (see picture above). click in the collections tab and at this point, you have 2 options either select all or all-corpora and then hit the download command.
I would suggest downloading the all options as you'll not have to this step ever again. But if memory is a issue for your computer then by all means go with all-corpora.
- Disclaimer:This might take a while!
To go over all the material in the class supplement, one can simply copy and paste all the commands and update the file name etc and one should be good.
Python Basics
In order to help you spend the least amount of time possible going over coding issues. I will give you some basic commands that might be useful for the homework. This commands will go from most basics to intermediate.
a = 1 # variable decleration
a = 'b' ## setting a to a string
1+1, 2-1, 2**3, ## basic math operation in python add, substract exponent
2/3 ## Division...this is bad because it returns
To remedy this issue and return decimal value one of the elements have to be a fraction
2/3.0
2.0/3 # good!
Reading the stop words
In python there are multiple ways to read the data, but for this homework I suggest using the pandas, read_csv commands.
Now i'll read the yelp.stop files, I will name the only column in the file as "word" and return all of this as a list. which is similar to the R vector data structure.
import pandas as pd
stop = pd.read_csv("yelp.stop", names =["words"])
stop
Although this is nice, we NEED the stopwords to be in a list format. Thus to convert the pandas dataframe to list, enter the following commands.
stop['words'].values.tolist()
for-Loop in python
In python, in order to do a for loop of increment i, one only need the range function to iterate over the number. The syntax for range is range(beginning,end, increment). Example
for number in range(0,10,3):
    print number
another example this time squaring the output and over a longer range
for number in range(5,25,5):
    print number**2
Always Remember to indent everything that is in the for loop
data = pd.DataFrame()
data["X-axis"] =range(-10,10,1)
data["Y-axis"]= data['X-axis']**2
data
Since now we have our data, We will need to import our plotting package in python this is called matplotlib. NOTES the line matplotlib inline was used only to insert the picture in this document.
from matplotlib import pyplot as plt
import matplotlib
%matplotlib inline
matplotlib.style.use('ggplot') # use ggplot format
data.plot(x= "X-axis", y ="Y-axis", color = 'b')

what if you wanted a scatter plot??
data.plot(kind ='scatter', x="X-axis", y= "Y-axis", color = 'r')

What about bar plot??
data.plot(kind ='bar', x = 'X-axis', y = 'Y-axis', color = 'g')

Nice huh?.. When doing this in spyder it is IMPORTANT to call plt.show() to display the graph after running the command above.
Conclusion
I hope this tutorial is helpful and will reduce the barrier to entry to python for you.