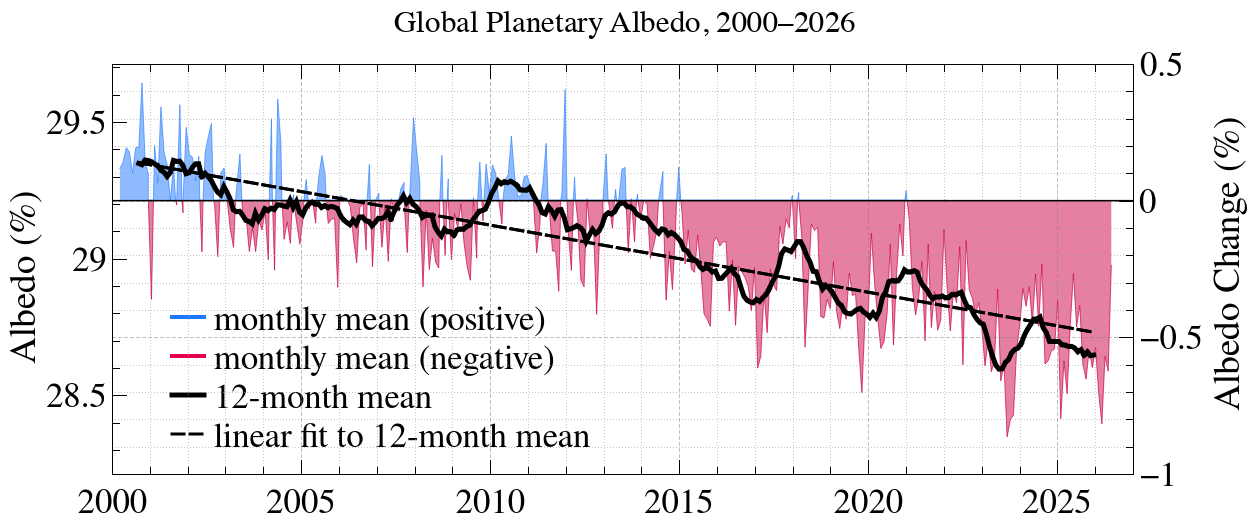
NASA CERES-based measures of Earth's radiation balance at the top of the atmosphere, including absorbed solar radiation (ASR), emitted thermal radiation (LWout), and Earth's energy imbalance (EEI).
Fig. 1. Seasonally adjusted planetary albedo (Earth's reflectivity as seen from space), calculated as the ratio of outgoing (reflected) shortwave radiation divided by incoming solar radiation, both of which are measured by satellites. Albedo change (right side vertical axis) is relative to the first 10 years of data (Mar 2000 - Feb 2010). Monthly data range from March 2000 to May 2026; negative values lead to planetary warming. Data source: ref [1].
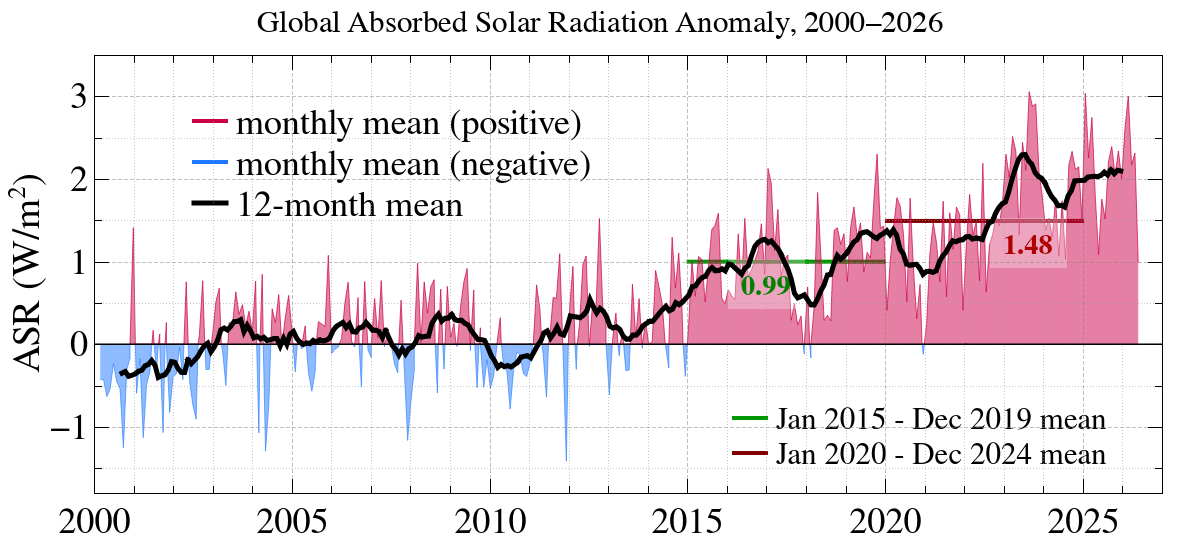
Fig. 2. Absorbed solar radiation anomaly, calculated as the difference between incoming solar radiation and outgoing (reflected) shortwave radiation, relative to base period Mar 2000 - Feb 2010. Positive values lead to planetary warming. Data through May 2026. Data source: ref [1].
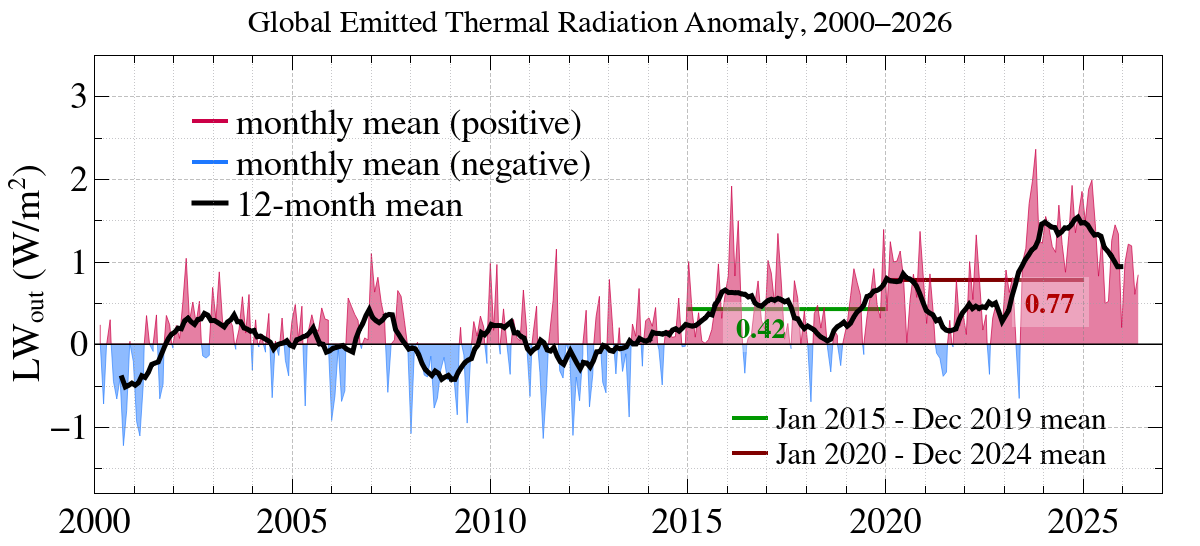
Fig. 3. Change in longwave (thermal) radiation emitted by Earth to space (LWout) as measured by satellites, relative to base period Mar 2000 - Feb 2010. Positive values are caused by planetary warming, as LWout is proportional to global temperature. Data through May 2026. Data source: ref [1].
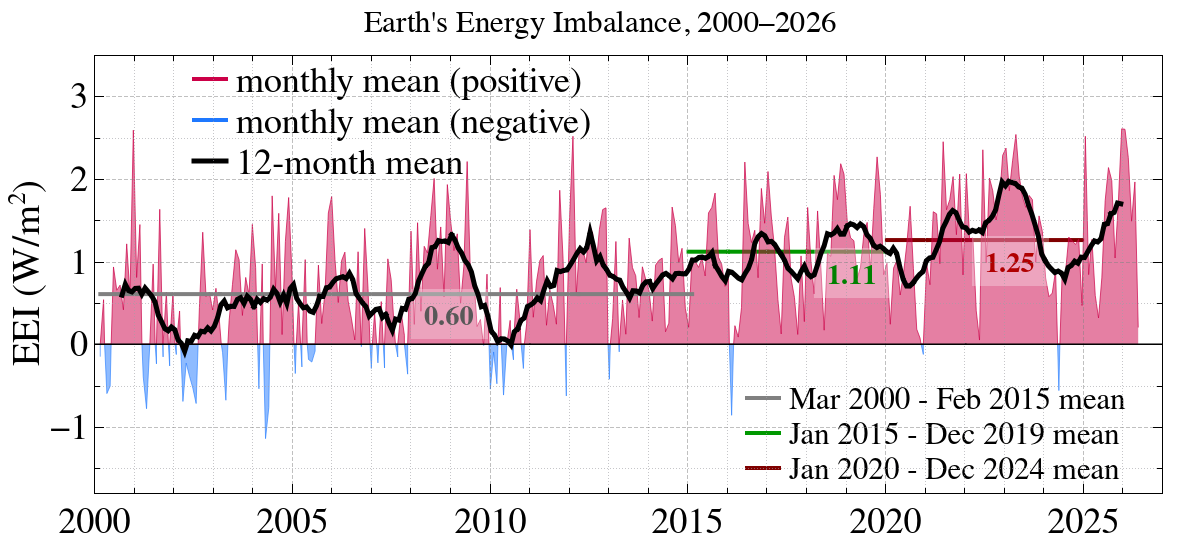
Fig. 4. Change in Earth's energy imbalance (EEI) measured at the top of Earth's atmosphere (TOA; taken to be 20 km by the CERES project), relative to base period Jul 2005 - Jun 2015. Data in this base period are calibrated by the NASA CERES project to match in situ ocean heat content data measured by the Argo project, yielding a mean of +0.71 W/m2. Positive values cause planetary warming.* Data through May 2026. Data source: ref [1].
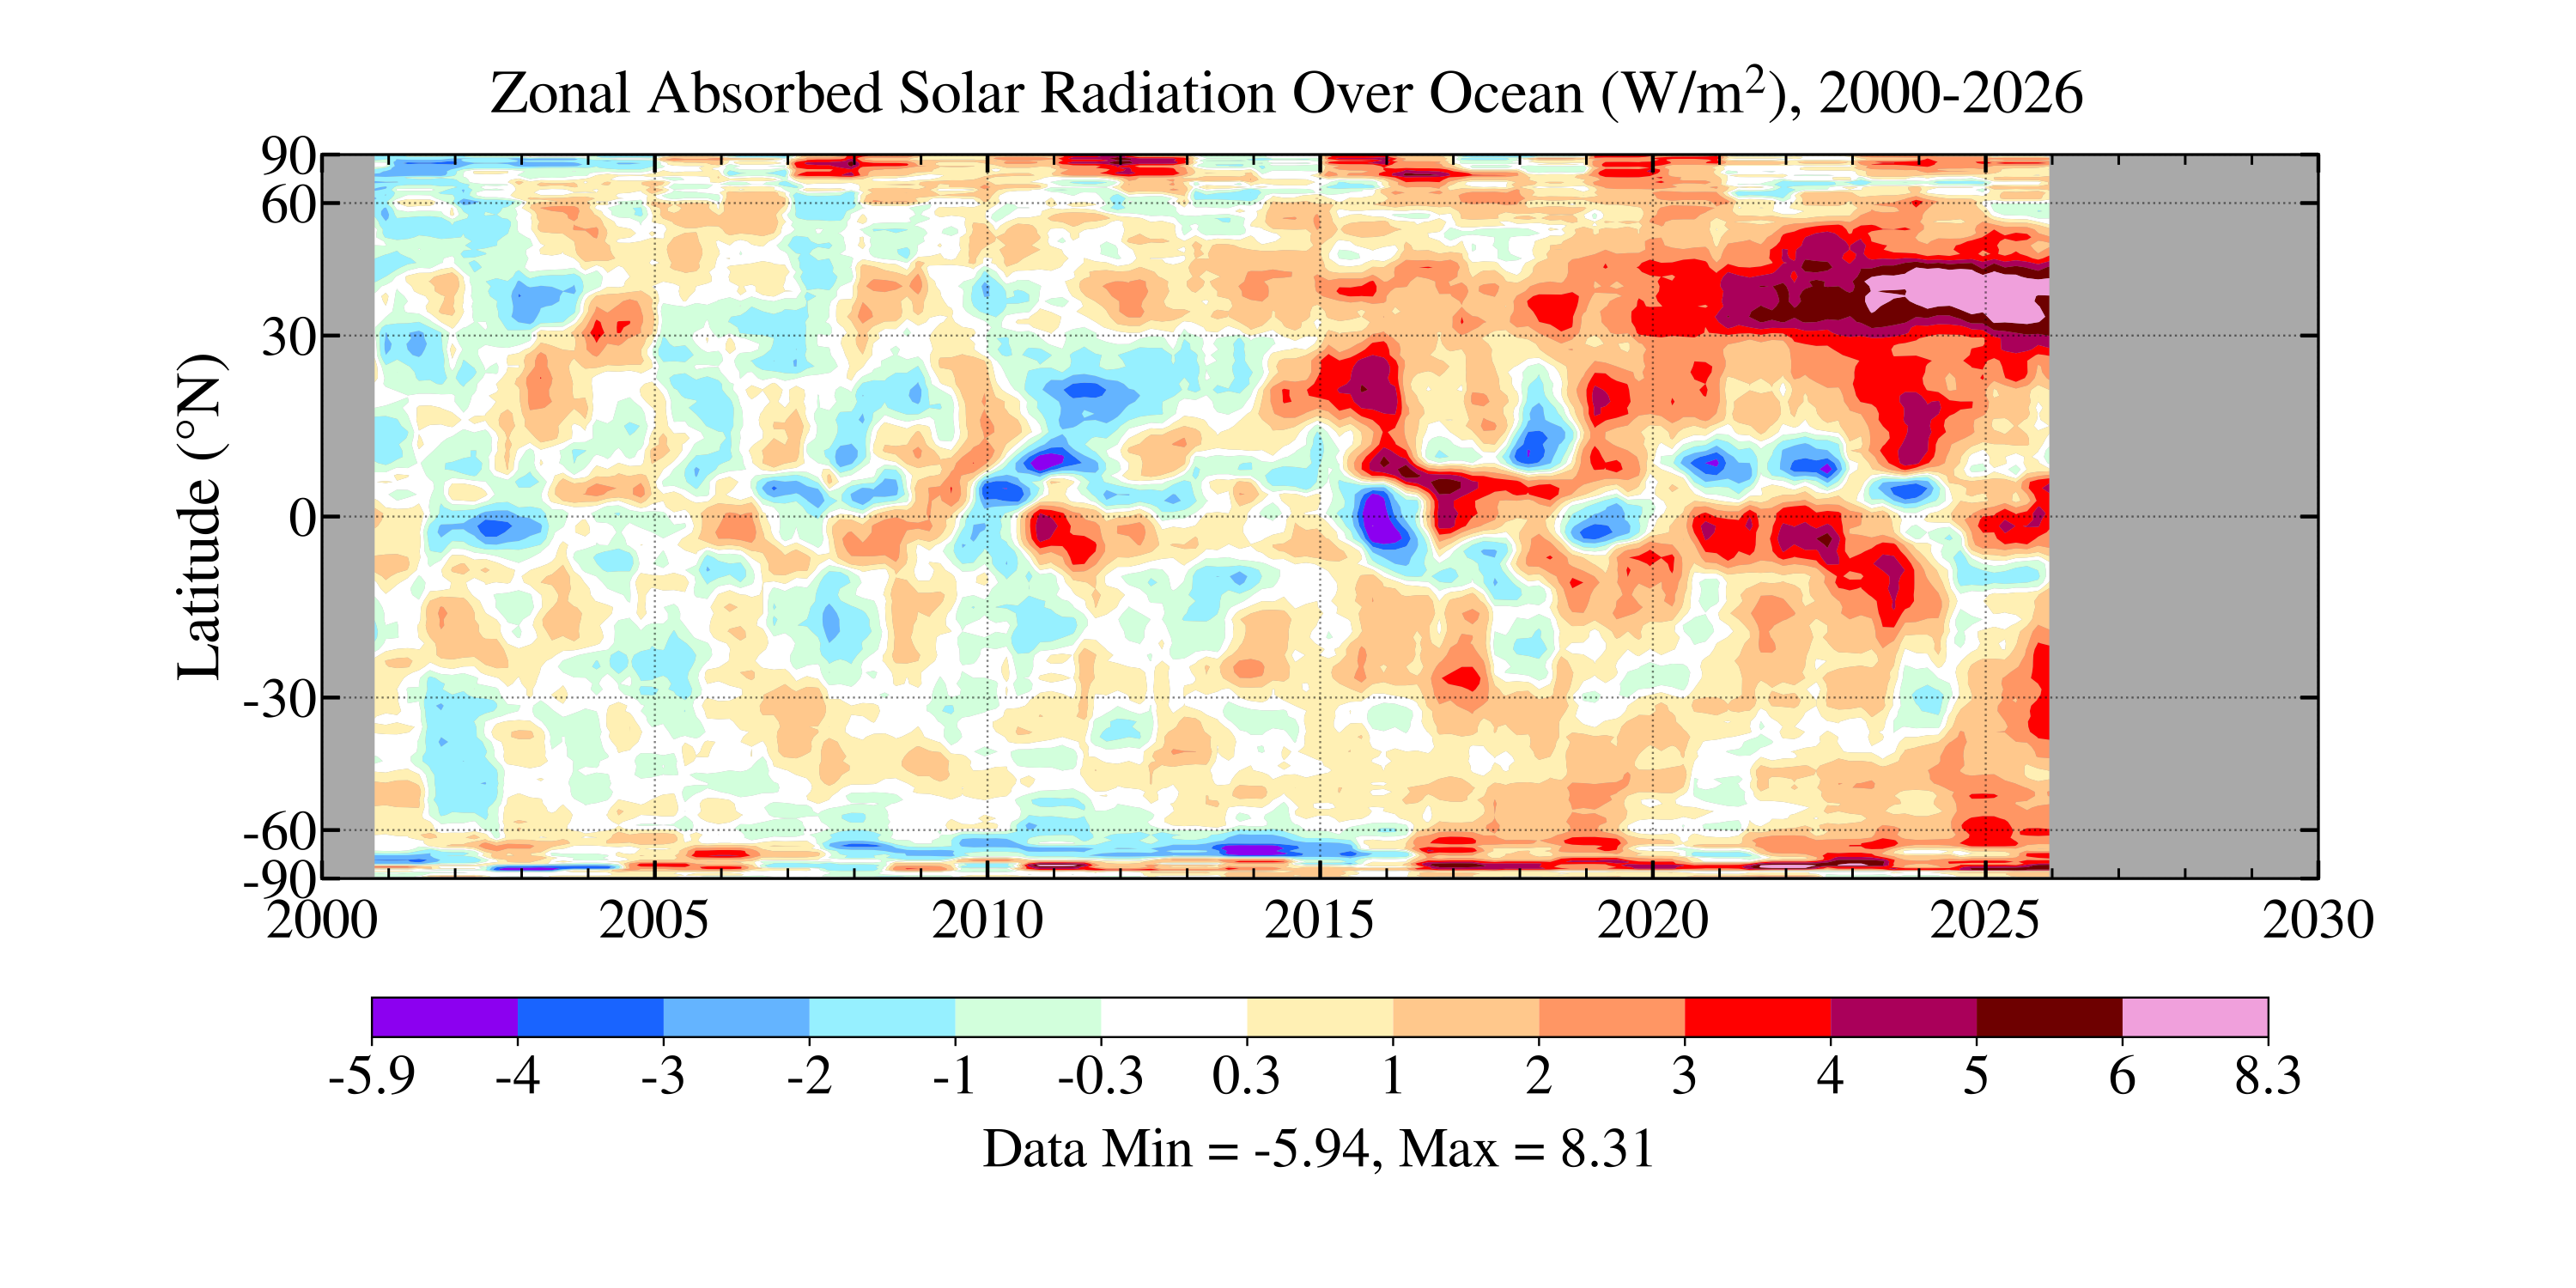
Fig. 5. Zonal absorbed solar radiation anomaly over ocean, relative to base period Mar 2000 - Feb 2010 (see Fig. 2 above for ASR calculation). 12-month running means shown here; underlying monthly data go through May 2026.
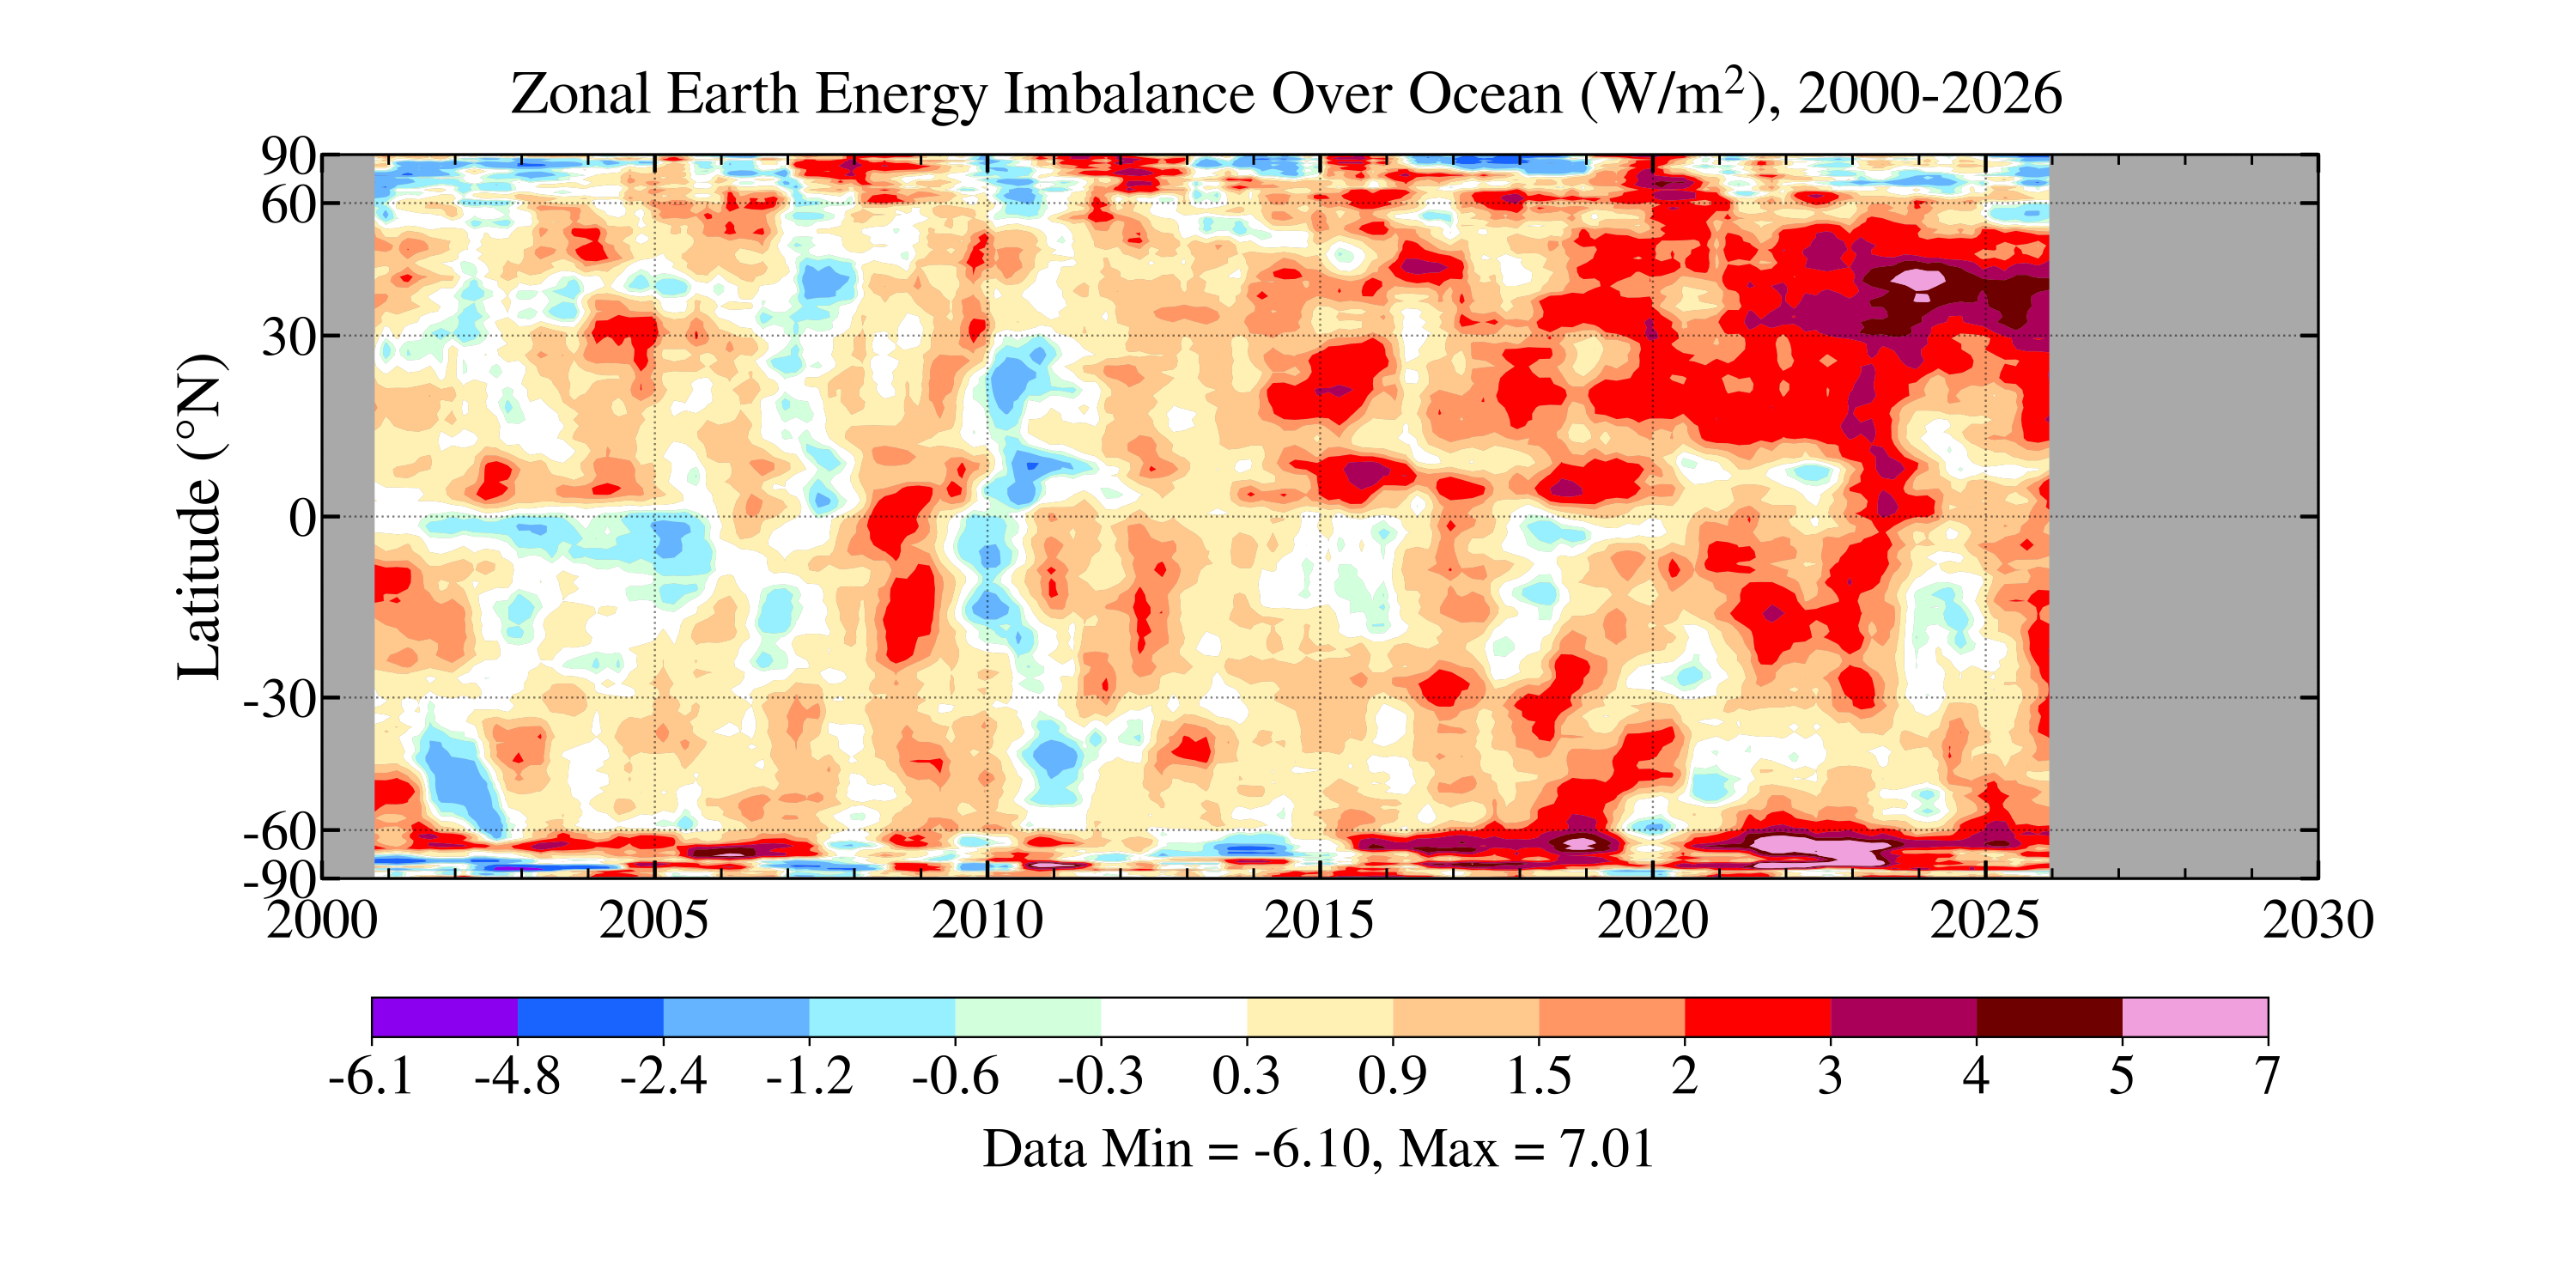
Fig. 6. Zonal Earth's energy imbalance anomaly over ocean, relative to base period Jul 2005 - Jun 2015 (see Fig. 4 above for EEI calculation). 12-month running means shown here; underlying monthly data go through May 2026.
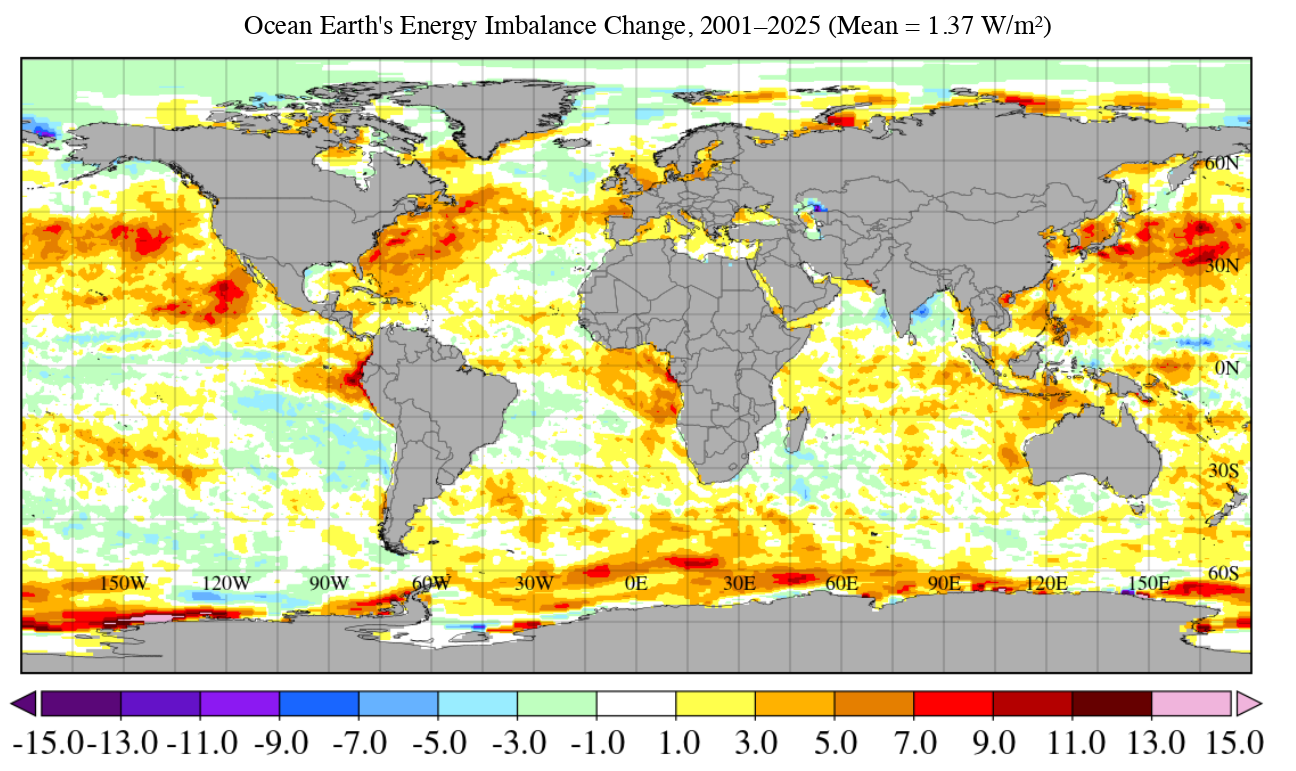
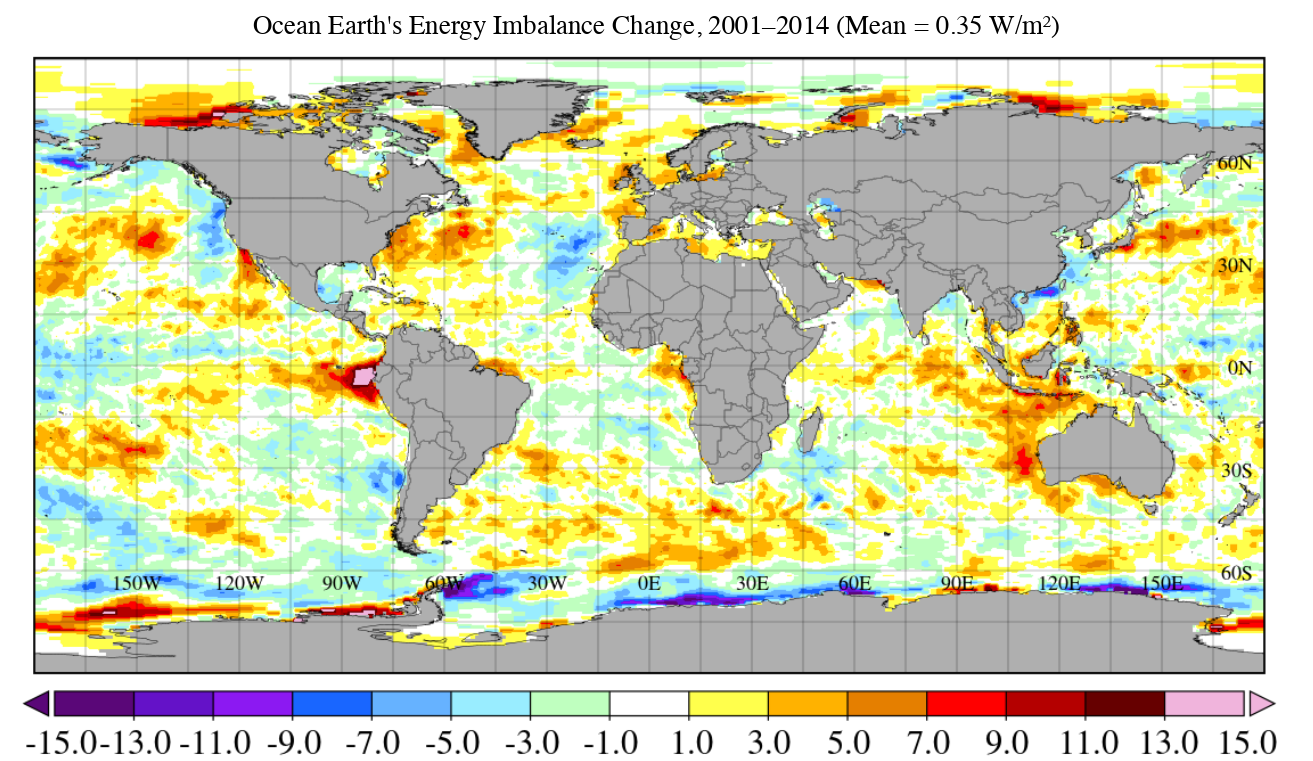
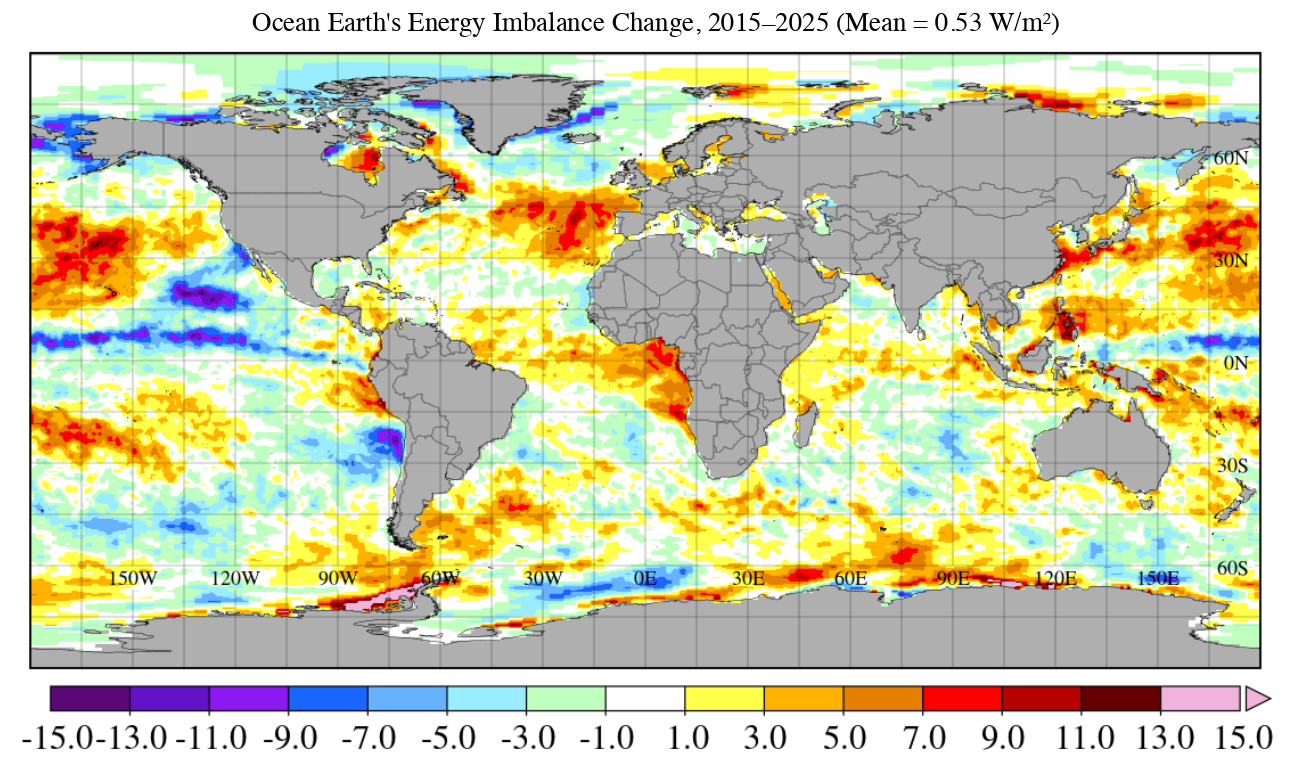
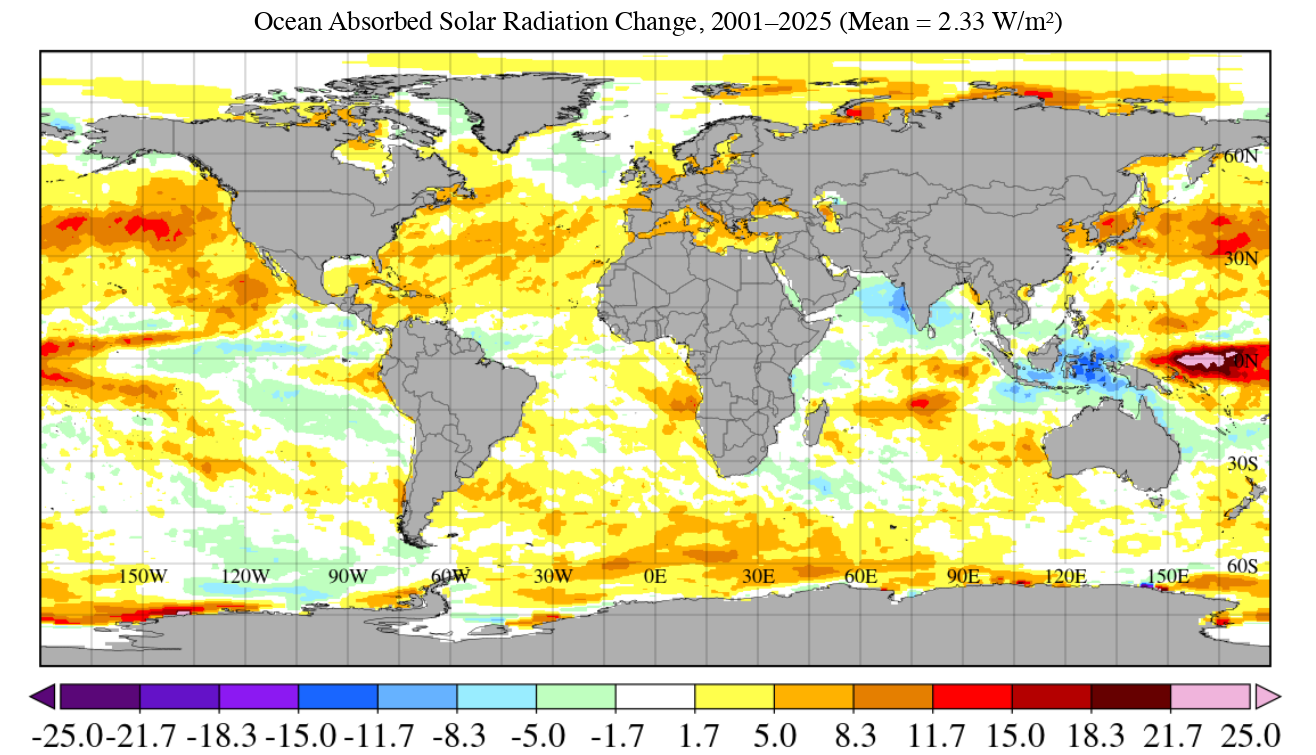
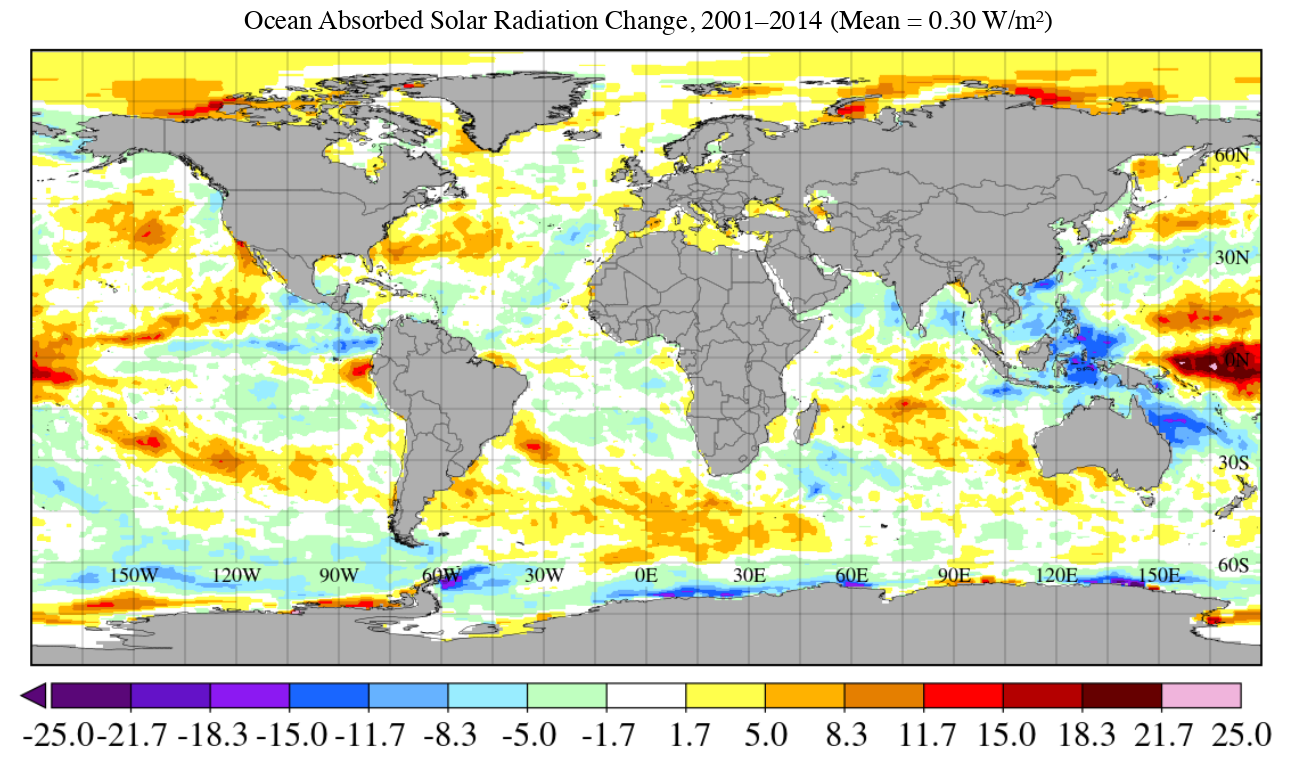
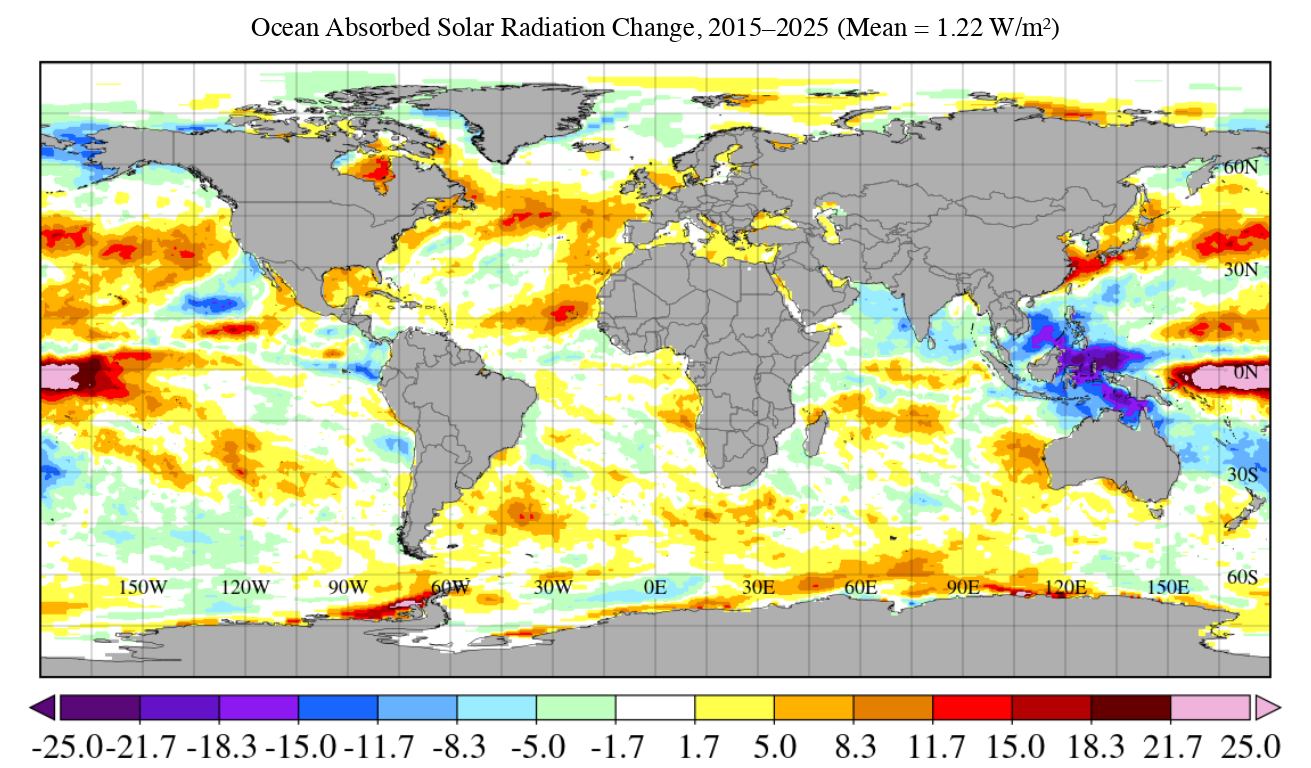
Maps show changes based on local linear trends for selected periods.
|
|
|
|
Fig. 7. Earth's energy imbalance change over ocean for 3 different time periods, based on local linear trends. Data source: ref [1].
|
|
|
|
Fig. 8. Absorbed solar radiation change over ocean for 3 different time periods, based on local linear trends. Data source: ref [1].
*An imbalance of 1 W/m2 converts to about 16,000 exajoules per year (EJ/yr) or 4470 petawatt-hours per year (PWh/yr). By comparison, total world energy and electricity use are currently about 600 EJ/yr and 32 PWh/yr, respectively (see Energy Institute data). The energy released by the Hiroshima nuclear bomb used by the US in Aug 1945 was 67 terajoules (see here and here). Thus, the most recent 5-year mean EEI shown here (+1.25 W/m2 for Jan 2020 - Dec 2024) is 33 times higher than annual world energy use and 173 times higher than annual world electricity use, and is equivalent to 300 million Hiroshima bombs per year (820,000 bombs per day!!).
References:
[1] NASA LaRC, Clouds and the Earth's Radiant Energy System (CERES) project. Data available at https://ceres-tool.larc.nasa.gov/ord-tool/jsp/EBAFTOA421Selection.jsp.