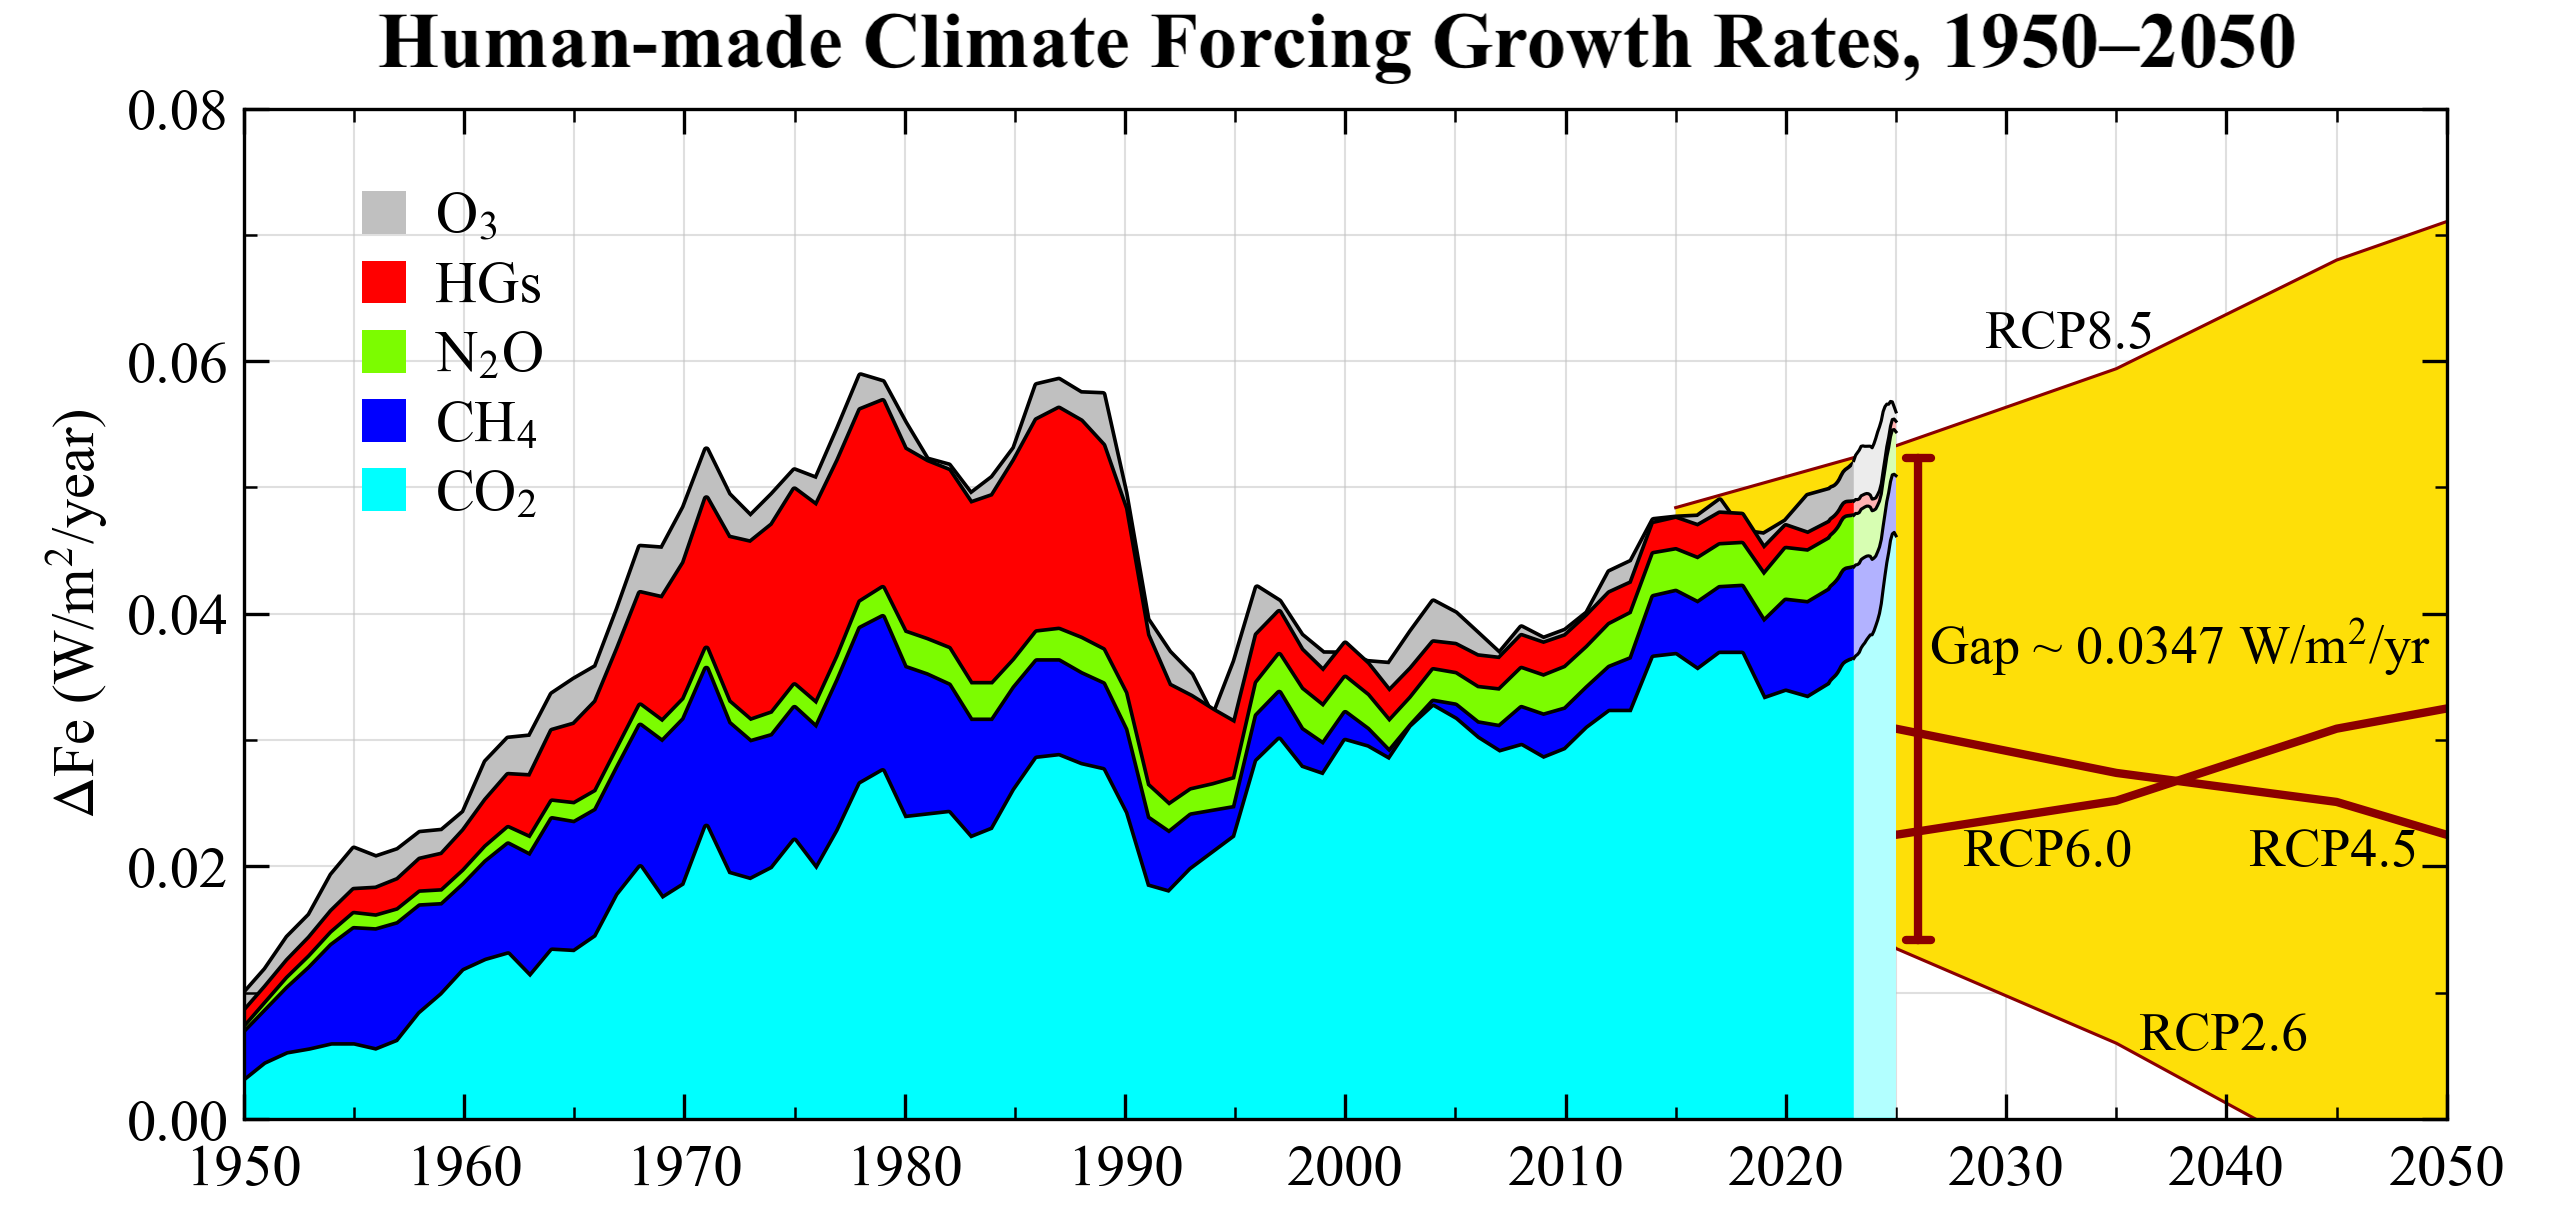
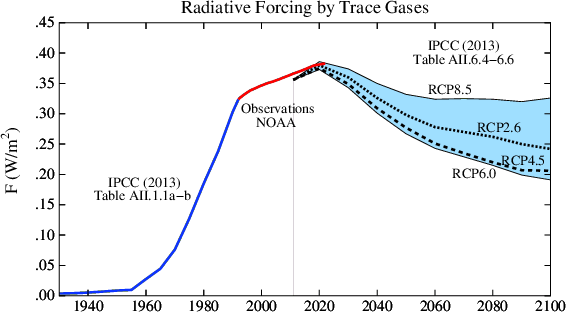
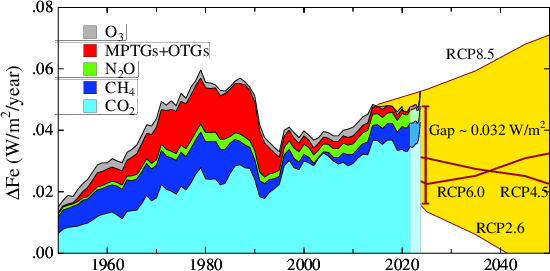
Greenhouse gas forcing, 1850–2025.
Human-made greenhouse gas forcing from carbon dioxide (CO
2),
methane (CH
4), nitrous oxide (N
2O),
halogenated gases (HGs), and ozone (O
3), compared with
future forcing scenarios (RCPs). Darker shading reflects 5-year or
60-month running means, and lighter shading reflects progressively
shorter n-month running means, where n = 60, 58, 56, ..., 12.
Figure available as
PDF.
Figure updated 1 May 2026. Data sources and calculation methods:
CO
2 [1],
CH
4 [2],
N
2O
[3],
HGs
[4],
O
3 radiative forcing
[5],
and forcing calculations
[6].
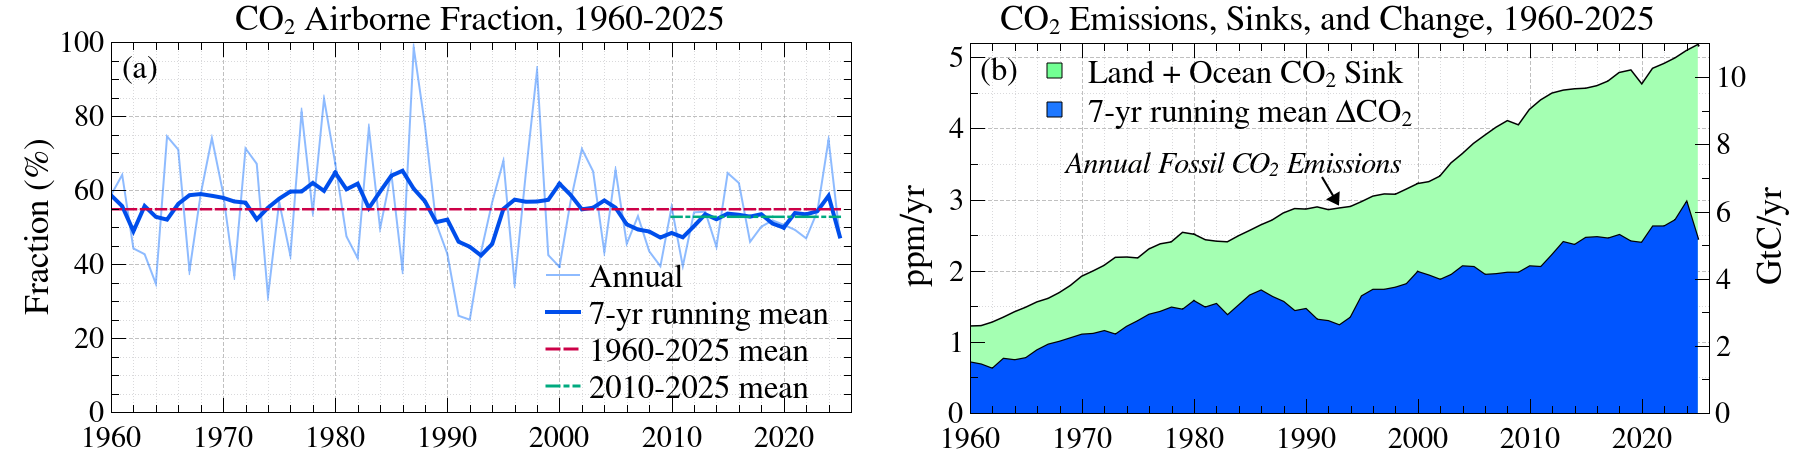
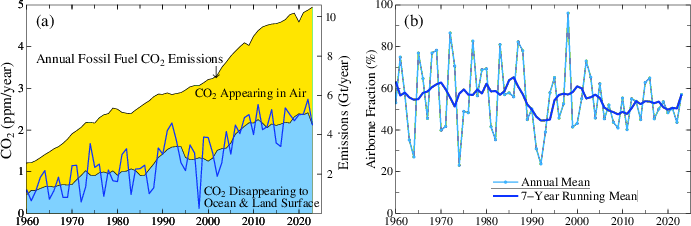
CO2 airborne fraction, emissions, sinks, and atmospheric change, 1960–2025.
Seven-year running mean values are extended for the first and last 3 years by using 1-year,
3-year, and 5-year means. Emissions are extrapolated through 2025 using
energy consumption data.
Figure available as
PDF.
Figure updated 1 May 2026. Data sources:
[1] for atmospheric CO
2,
[7] for emissions, and
[8] for
energy consumption.
Legacy Figures
Carbon Dioxide (CO2)
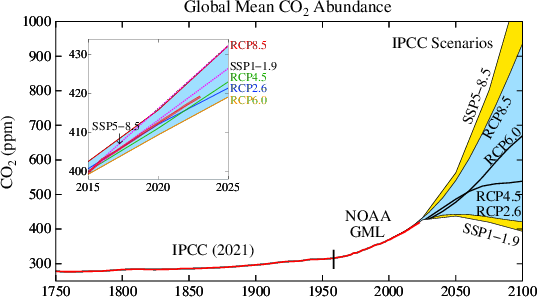
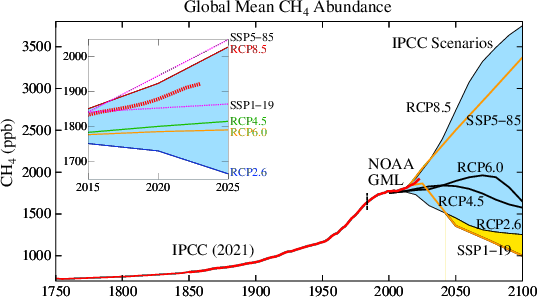
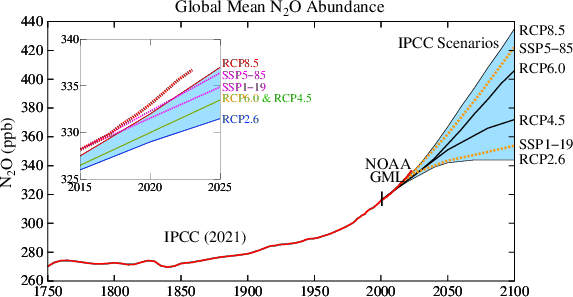
Long-Term Annual Means with IPCC Scenarios
Figure in
PDF.
Data:
CO2
(data through 2023, last updated 2024/08/15).
Also comparison of A1B, etc. and RCPs from IPCC (2013) in
PDF.
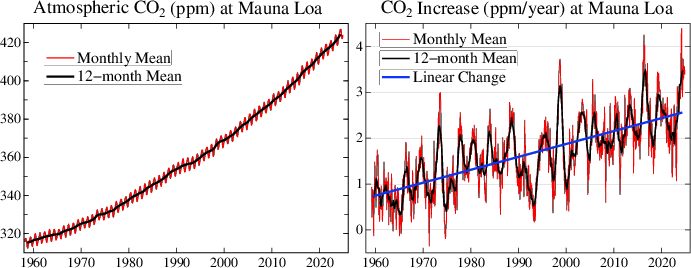
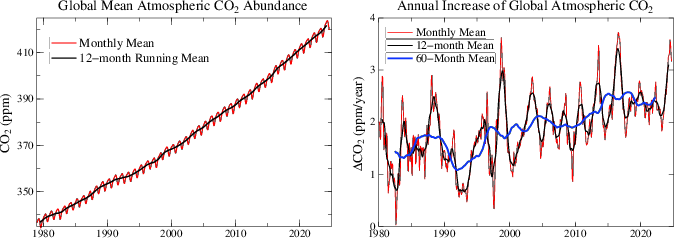
Figure in
PDF.
Data through November 2024. Last updated 2024/12/05.
Figure in
PDF.
Data through September 2024. Last updated 2024/12/05.
CO2 Emissions and Airborne Fraction
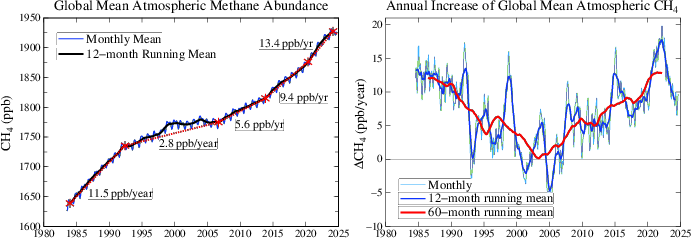
Methane (CH4)
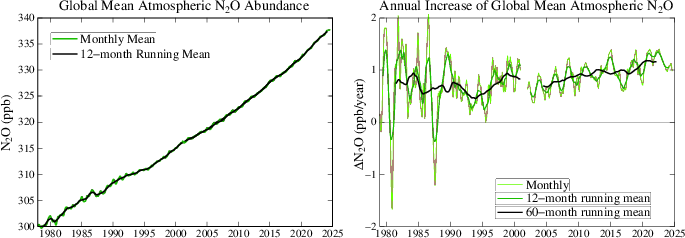
Nitrous Oxide (N2O)
Other Trace Gases
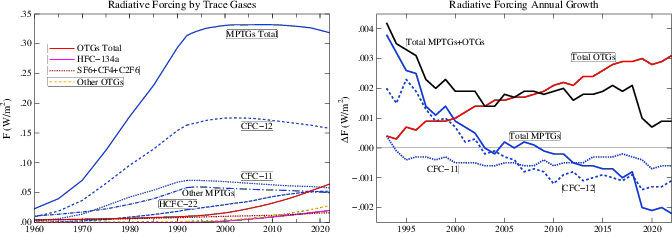
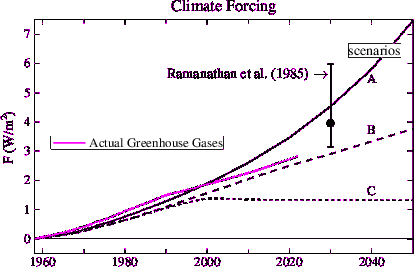
Greenhouse Gas Forcing Compared with Future Scenarios
Greenhouse Gas Forcing Growth Rates