1a. Global mean surface temperature, 1880–present
This page summarizes global surface temperature change, zonal patterns, and spatial trends derived from NASA GISS data.
Recent analyses and updates
Beware Media Hype. It's Not the El Nino!
(Last modified 27 July 2026)
2026 On Track for Warmest Year
(30 April 2026)
Super-Duper El Nino.
(15 April 2026)
Super El Nino? Super Warming is the Main Issue.
(20 March 2026)
Another El Nino? What Can We Learn From It?
(6 February 2026)
Temperature data tables
Updated temperature tables are available in plain-text format:
Land-ocean temperature table:
view |
download
Land-only temperature table:
view |
download
Ocean-only temperature table:
view |
download
Figures on this page
Global
1a. Global mean surface temperature
1b. Global temperature and ENSO projections
1c. Land and global temperature; land:global ratio
1d. Land and ocean temperature and land:ocean ratio
1e. Daily sea surface temperature, world
1f. Seasonal mean global temperature
1g. Monthly global temperature anomalies
Zonal
2a. Zonal mean surface temperature
2b. Zonal mean sea surface temperature
2c. Global and regional ocean temperature
Maps
3a. Global temperature change based on local linear trends
3b. Annual mean anomaly maps (2016–2025)
Additional figures are on the More Figures page.
Running-mean and seasonal curves end earlier than the final monthly datum.
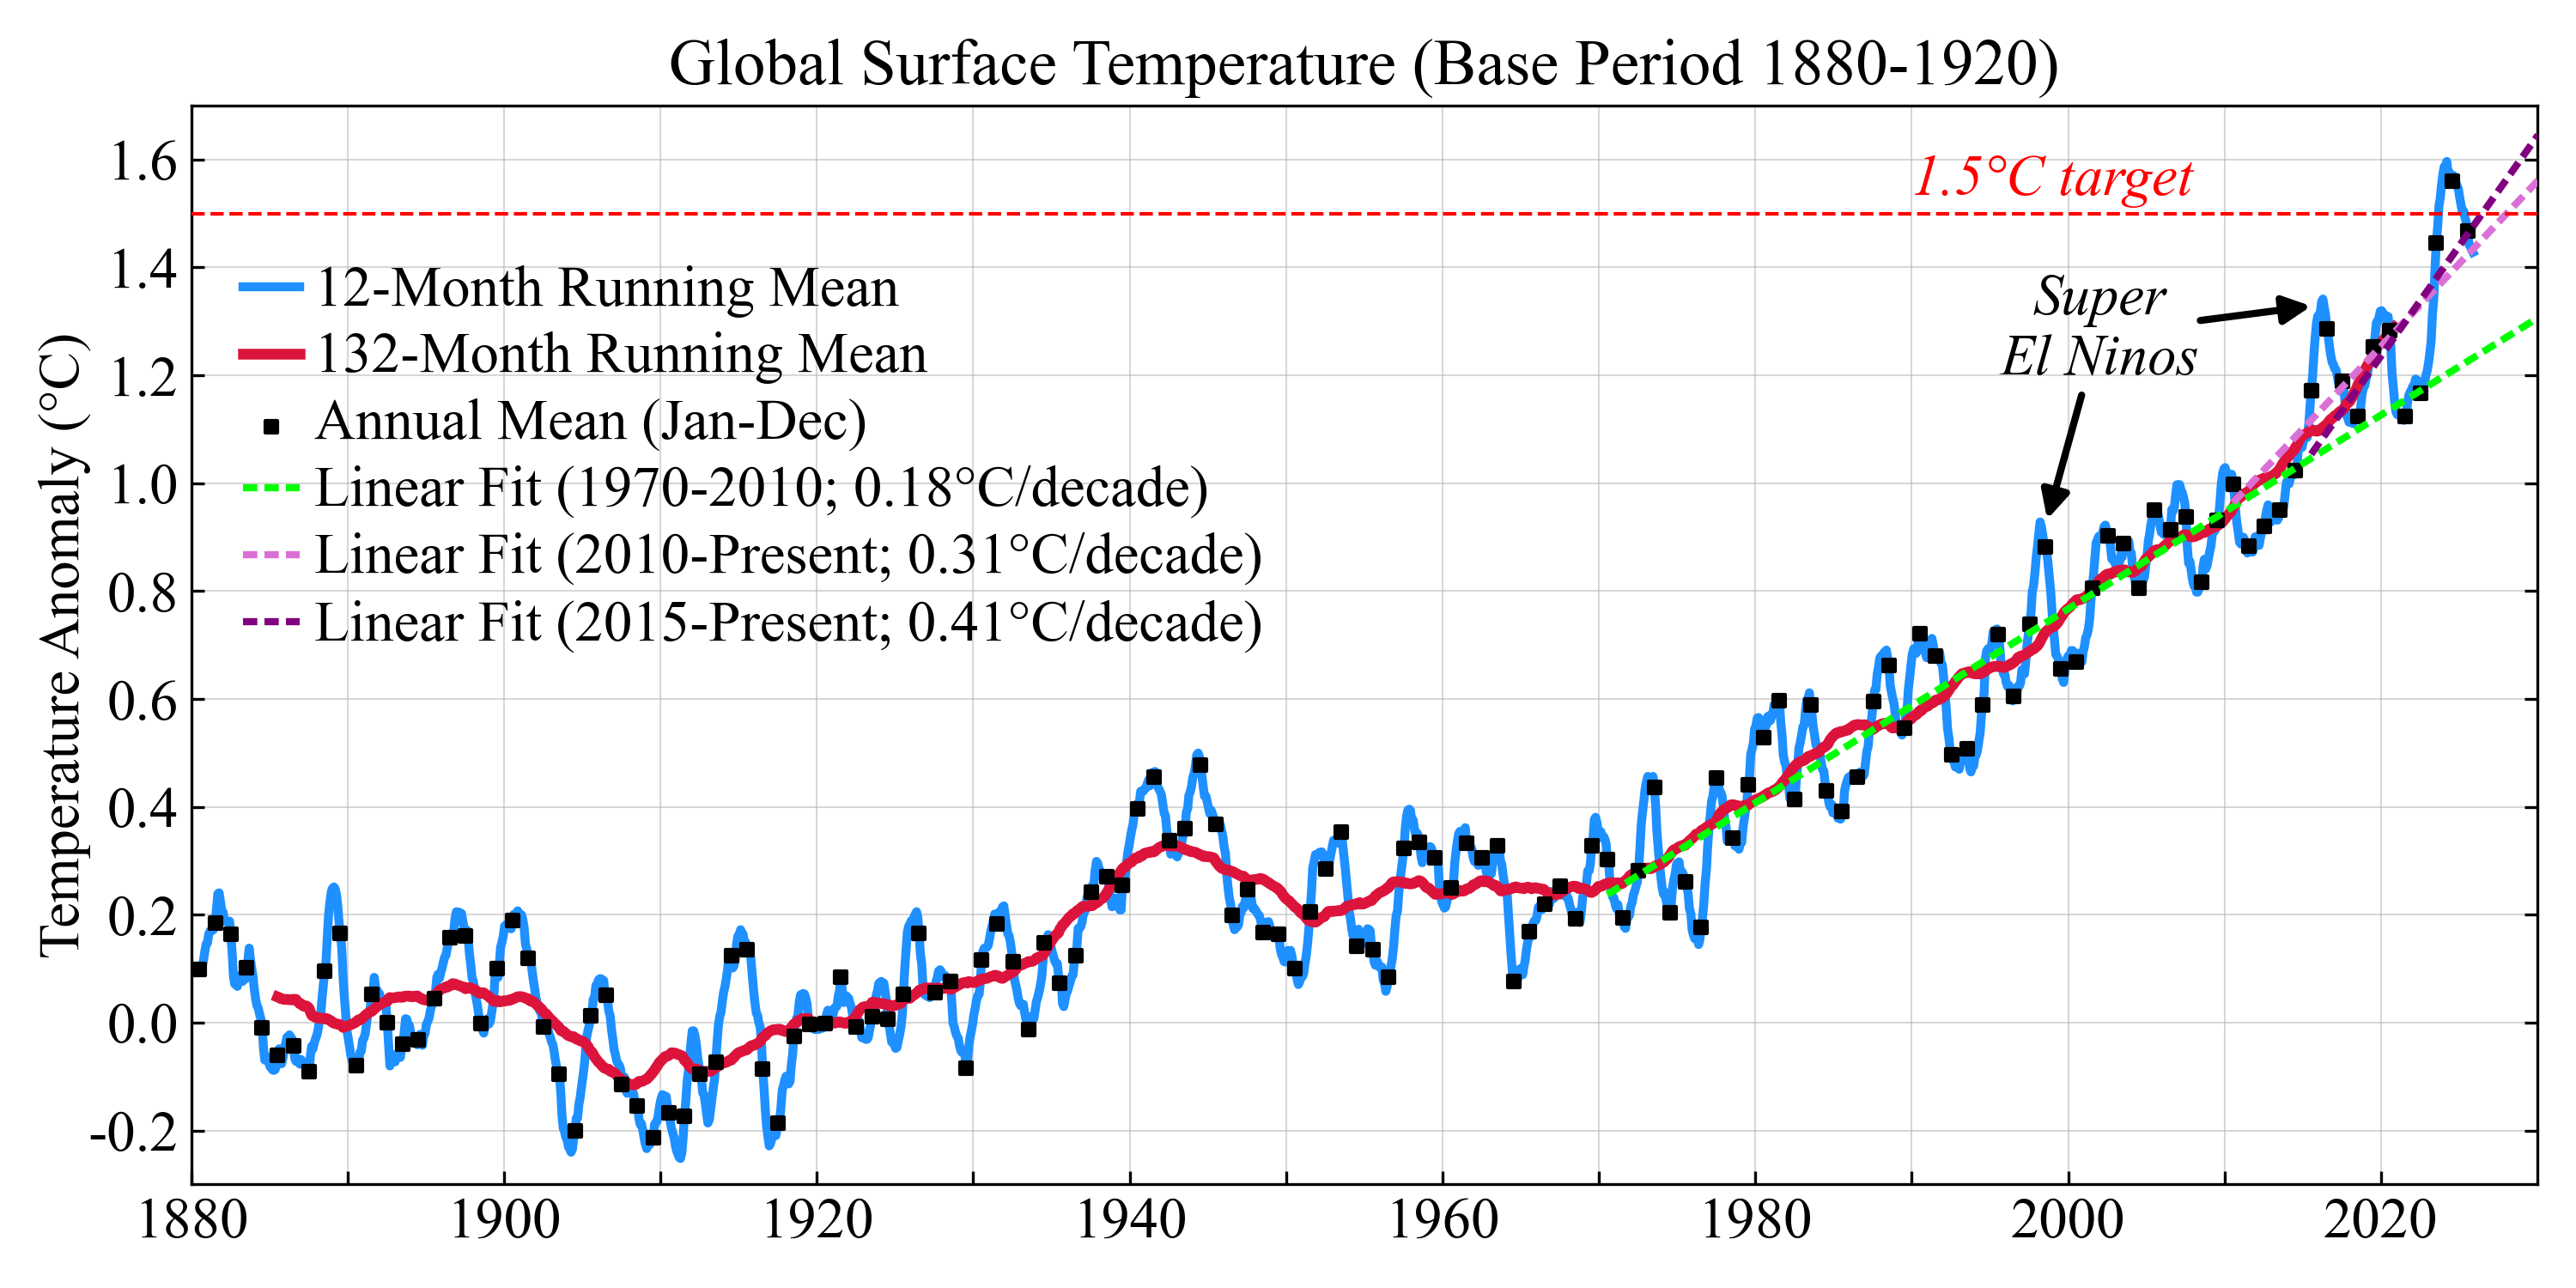
1a. Global mean surface temperature, 1880–present
Global mean surface temperature anomaly relative to the 1880–1920 mean. Curves show the 12-month running mean, 132-month running mean, and annual (Jan–Dec) means. Linear trends are shown for 1970–2010, 2010–present, and 2015–present. For discussion of the choice of base period, see “A Better Graph”.
Data through June 2026. Data source: ref. [1].
Figure available as
PDF.
1b. Global temperature and ENSO projections, 1950–2040
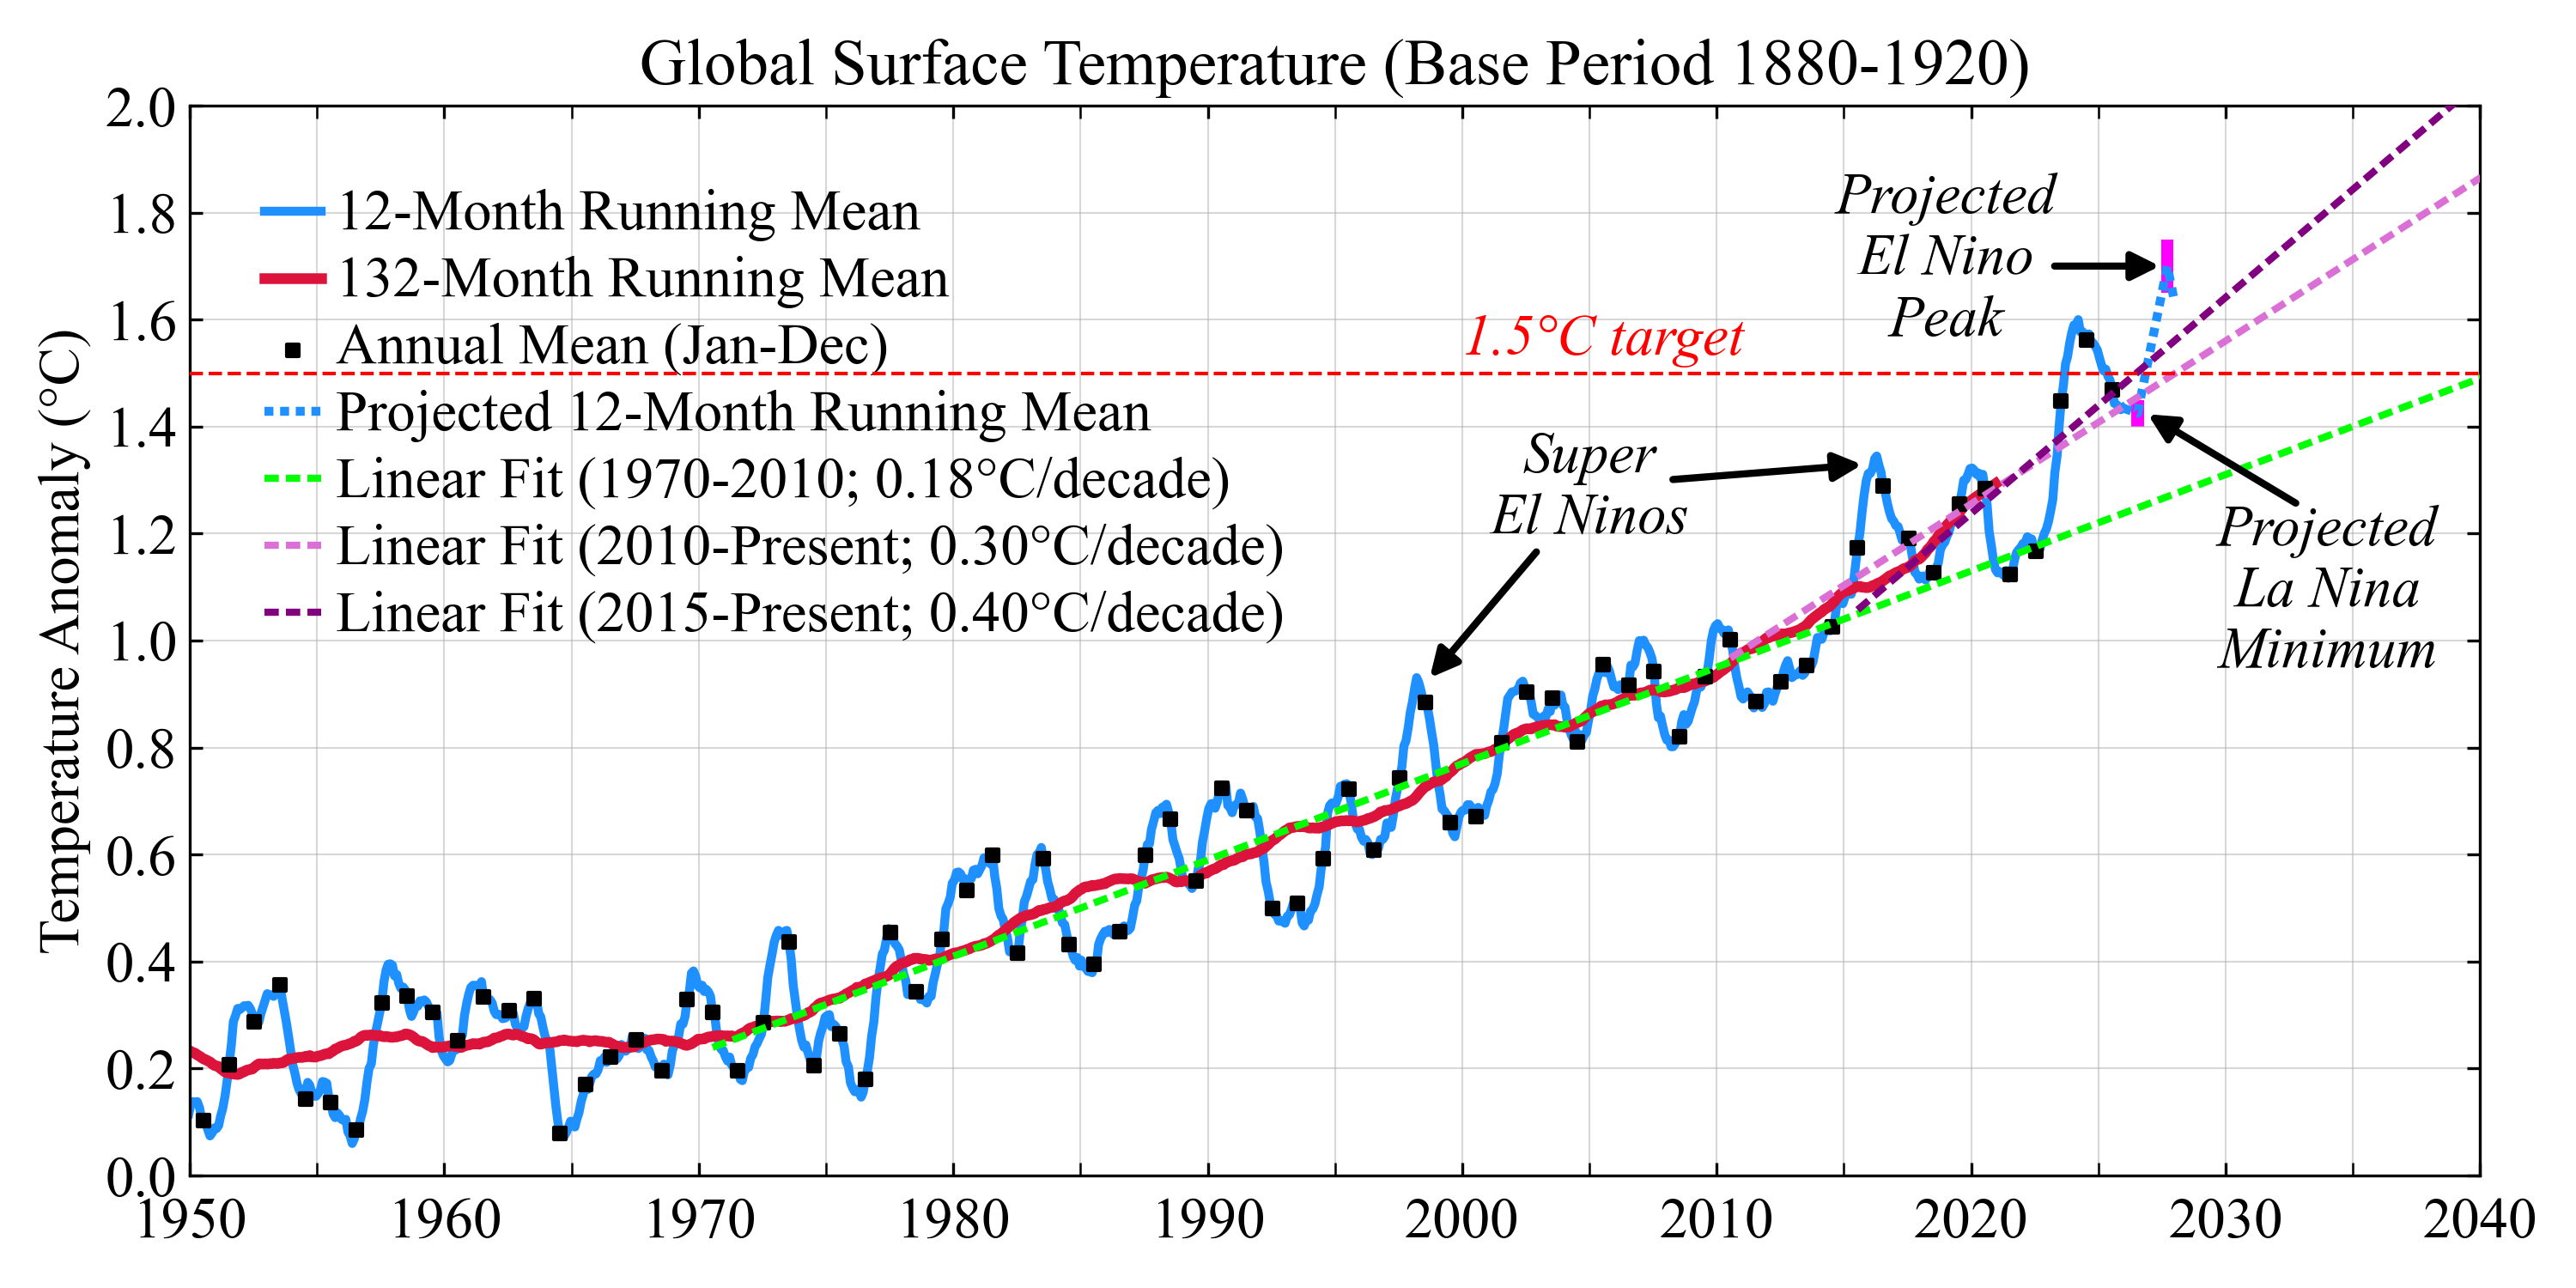
Global mean surface temperature anomaly relative to 1880–1920, 1950–2040. The plot shows observed annual means, 12-month running mean, and 132-month running mean, together with a projected 12-month running mean extending from the 2026 La Nina minimum to a projected El Nino peak in the first half of 2027. Projections are based on the historical relationship between global temperature and the Nino3.4 index (NOAA Climate Prediction Center).
Data through June 2026. Data source: ref. [1].
Figure available as
PDF.
Related discussion: Super El Nino? Super Warming is the Main Issue (20 March 2026), on the developing El Nino and the broader context of accelerated ocean-surface warming.
1c. Land and global mean temperature and land:global ratio, 1950–present
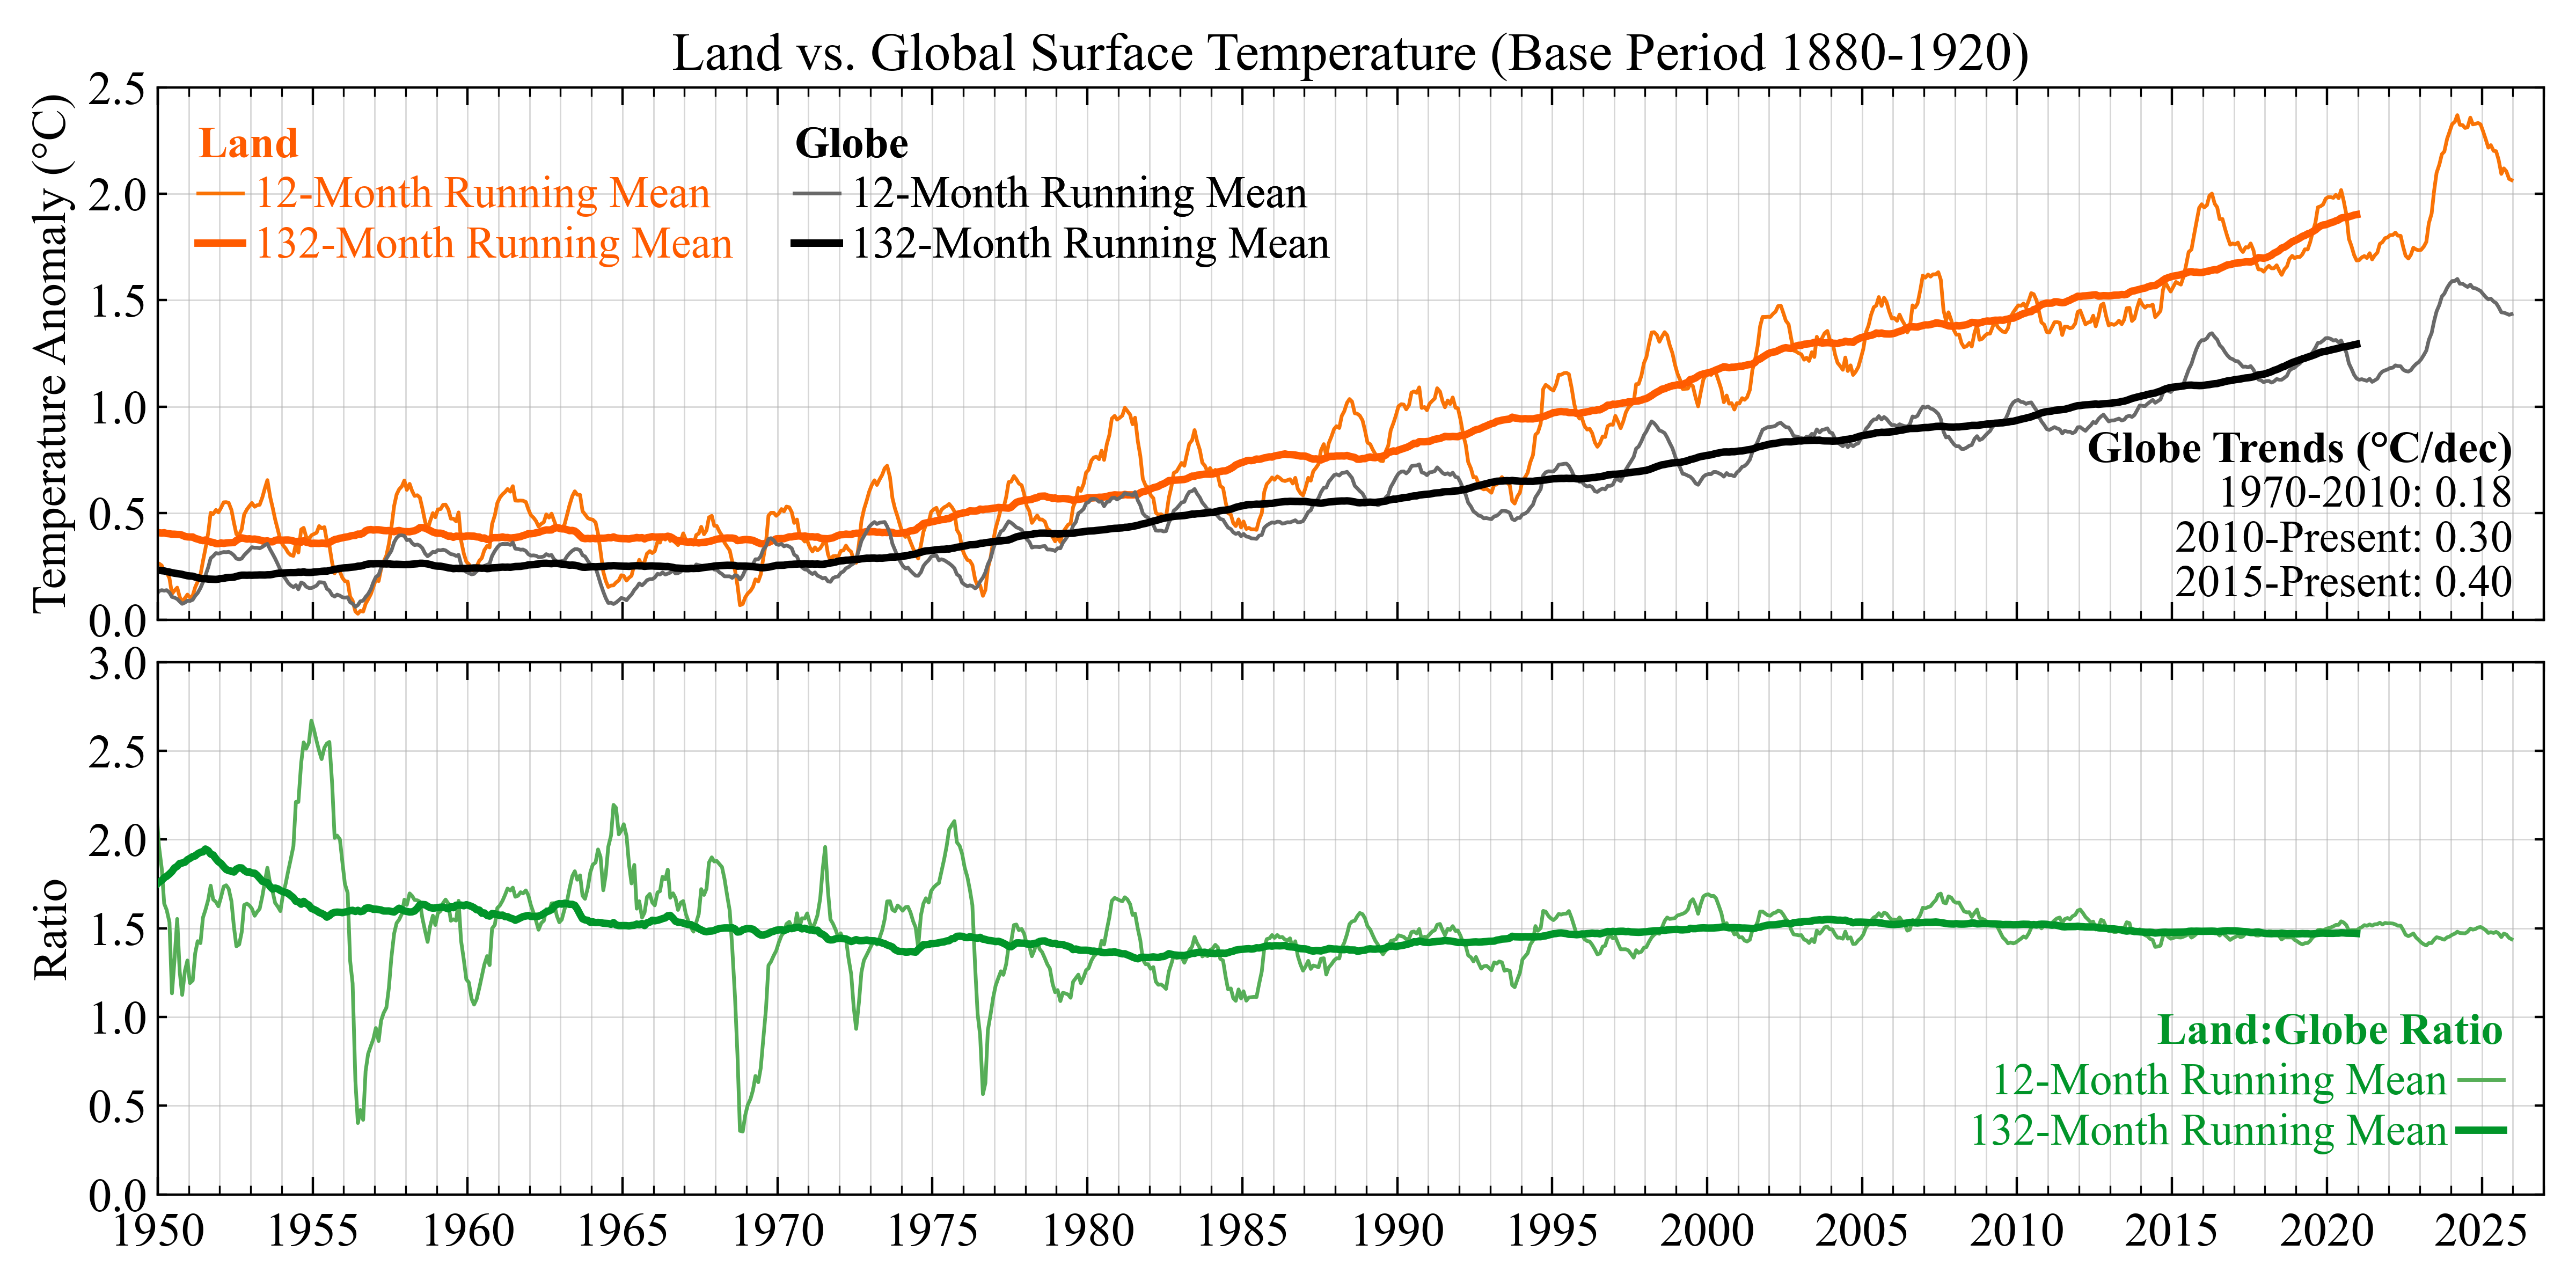
Global land-only and overall mean surface temperature anomalies relative to 1880–1920, with 12-month and 132-month running-mean curves for land and globe. The lower panel shows the land:globe ratio for the same running means, illustrating how land warms faster than the global mean as the forced warming signal emerges from interannual variability.
Data through June 2026. Data source: ref. [1].
Figure available as
PDF.
1d. Land and ocean mean temperature and land:ocean ratio, 1950–present
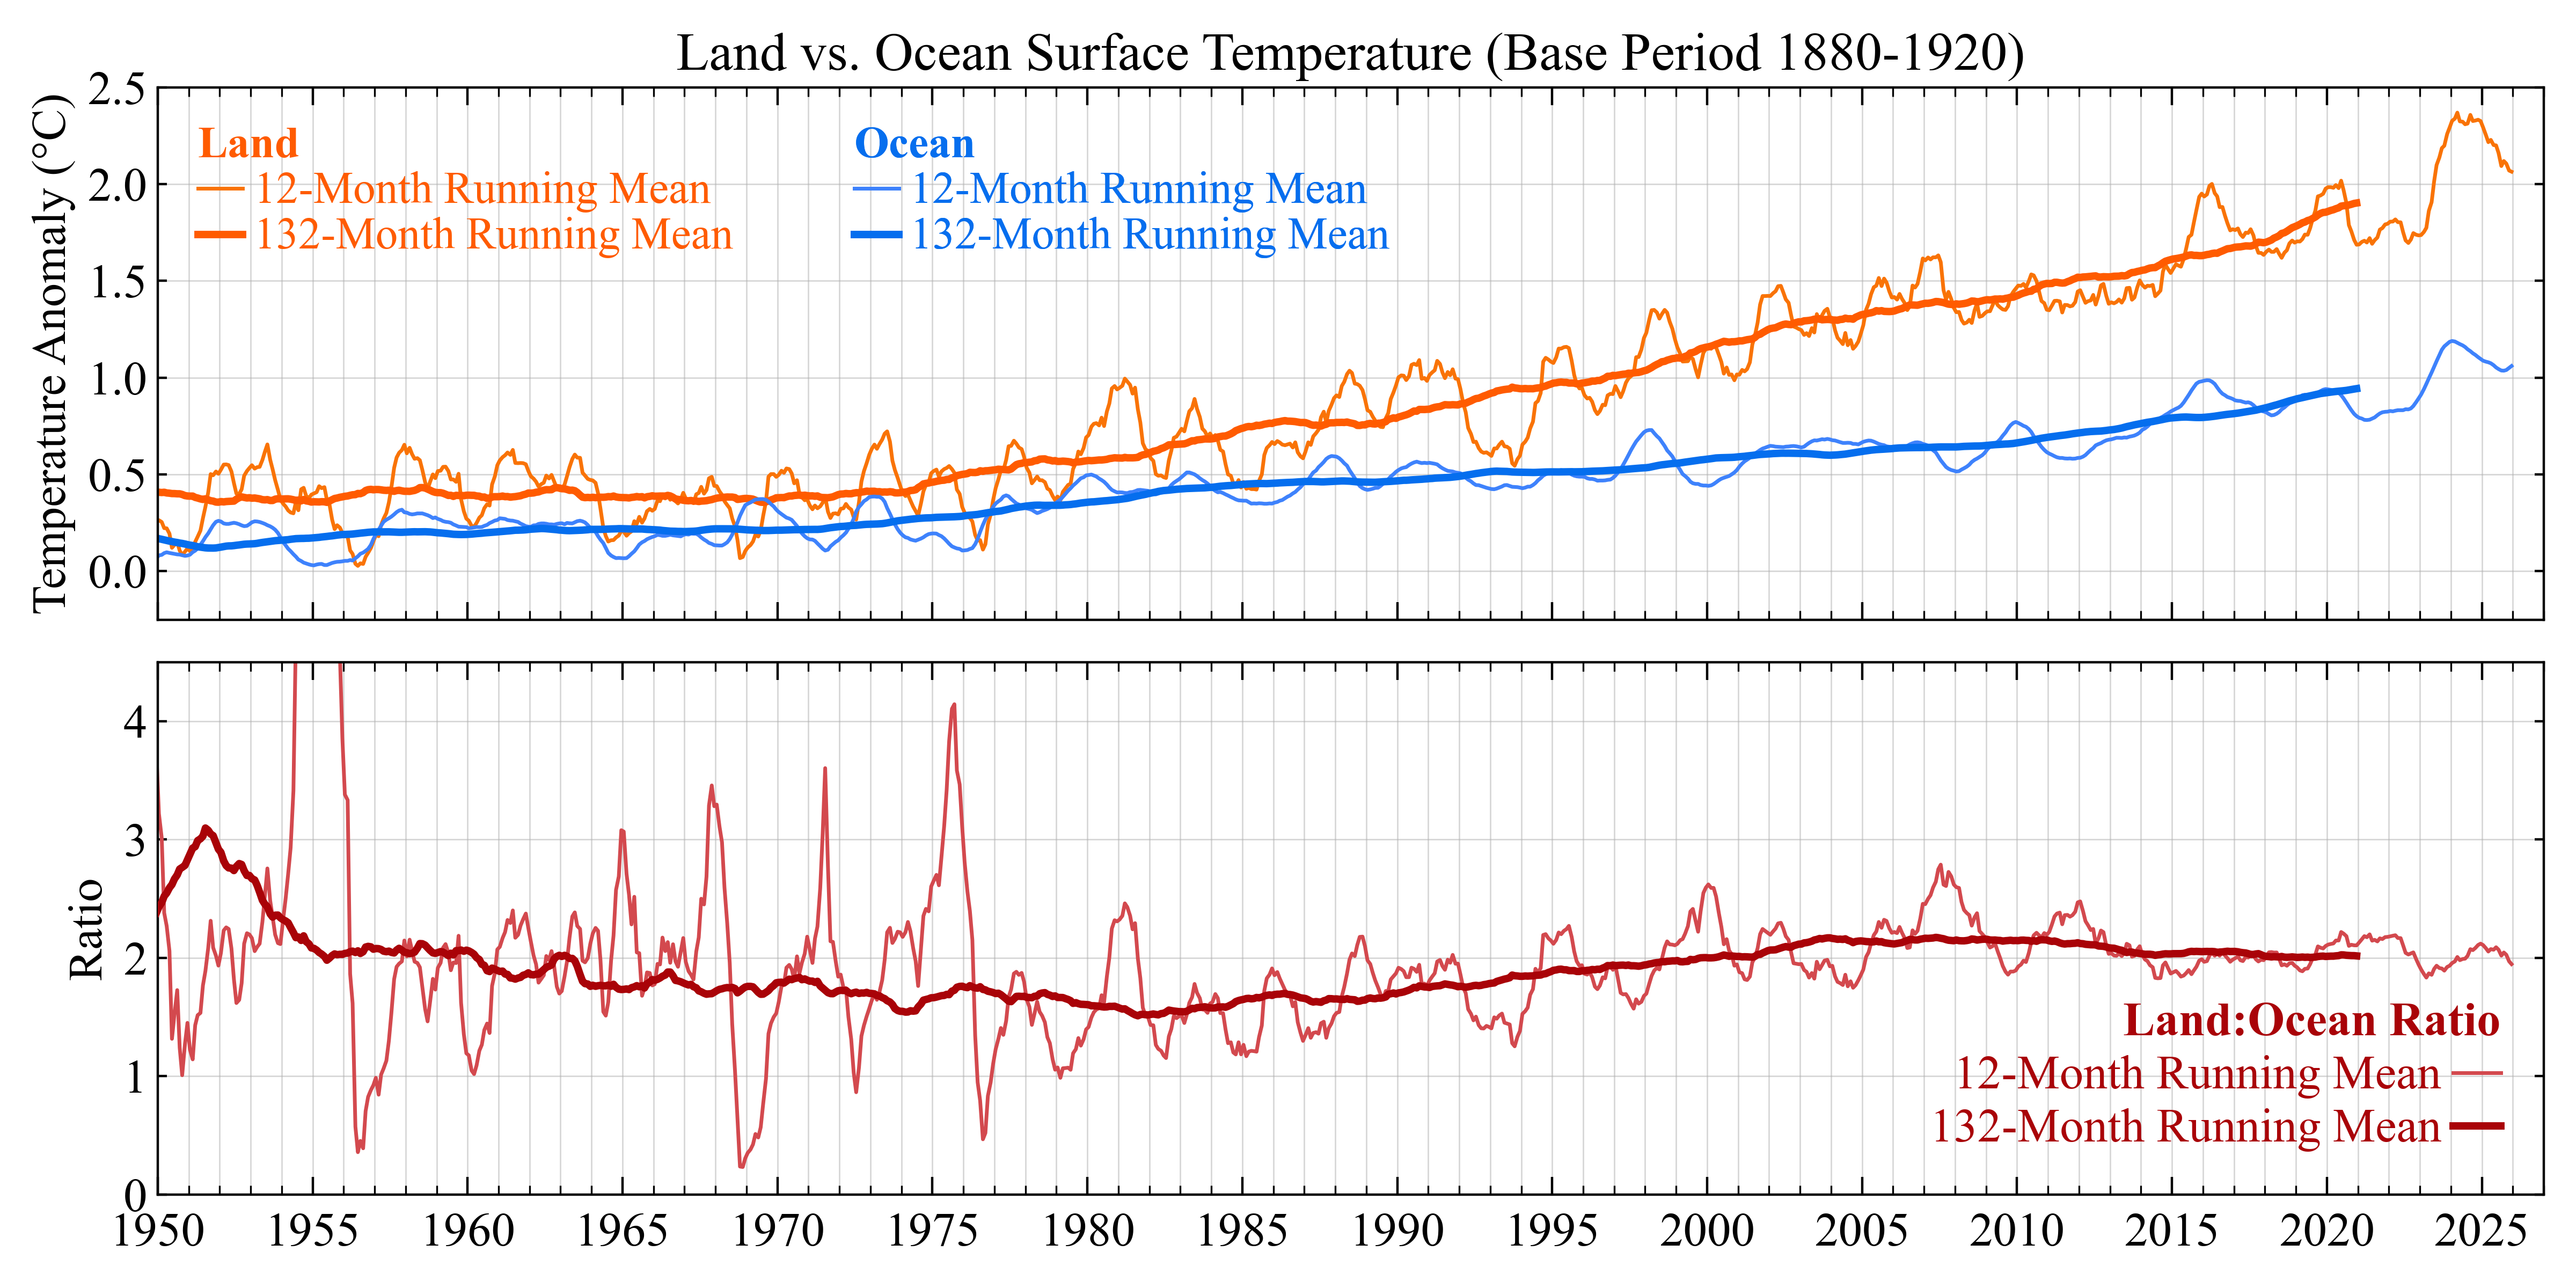
Global land-only and ocean-only mean surface temperature anomalies relative to 1880–1920, with 12-month and 132-month running-mean curves for land and ocean, 1950-present. The lower panel shows the land:ocean ratio for the same running means.
Data through June 2026. Data source: ref. [1].
Figure available as
PDF.
1e. Daily sea surface temperature, world
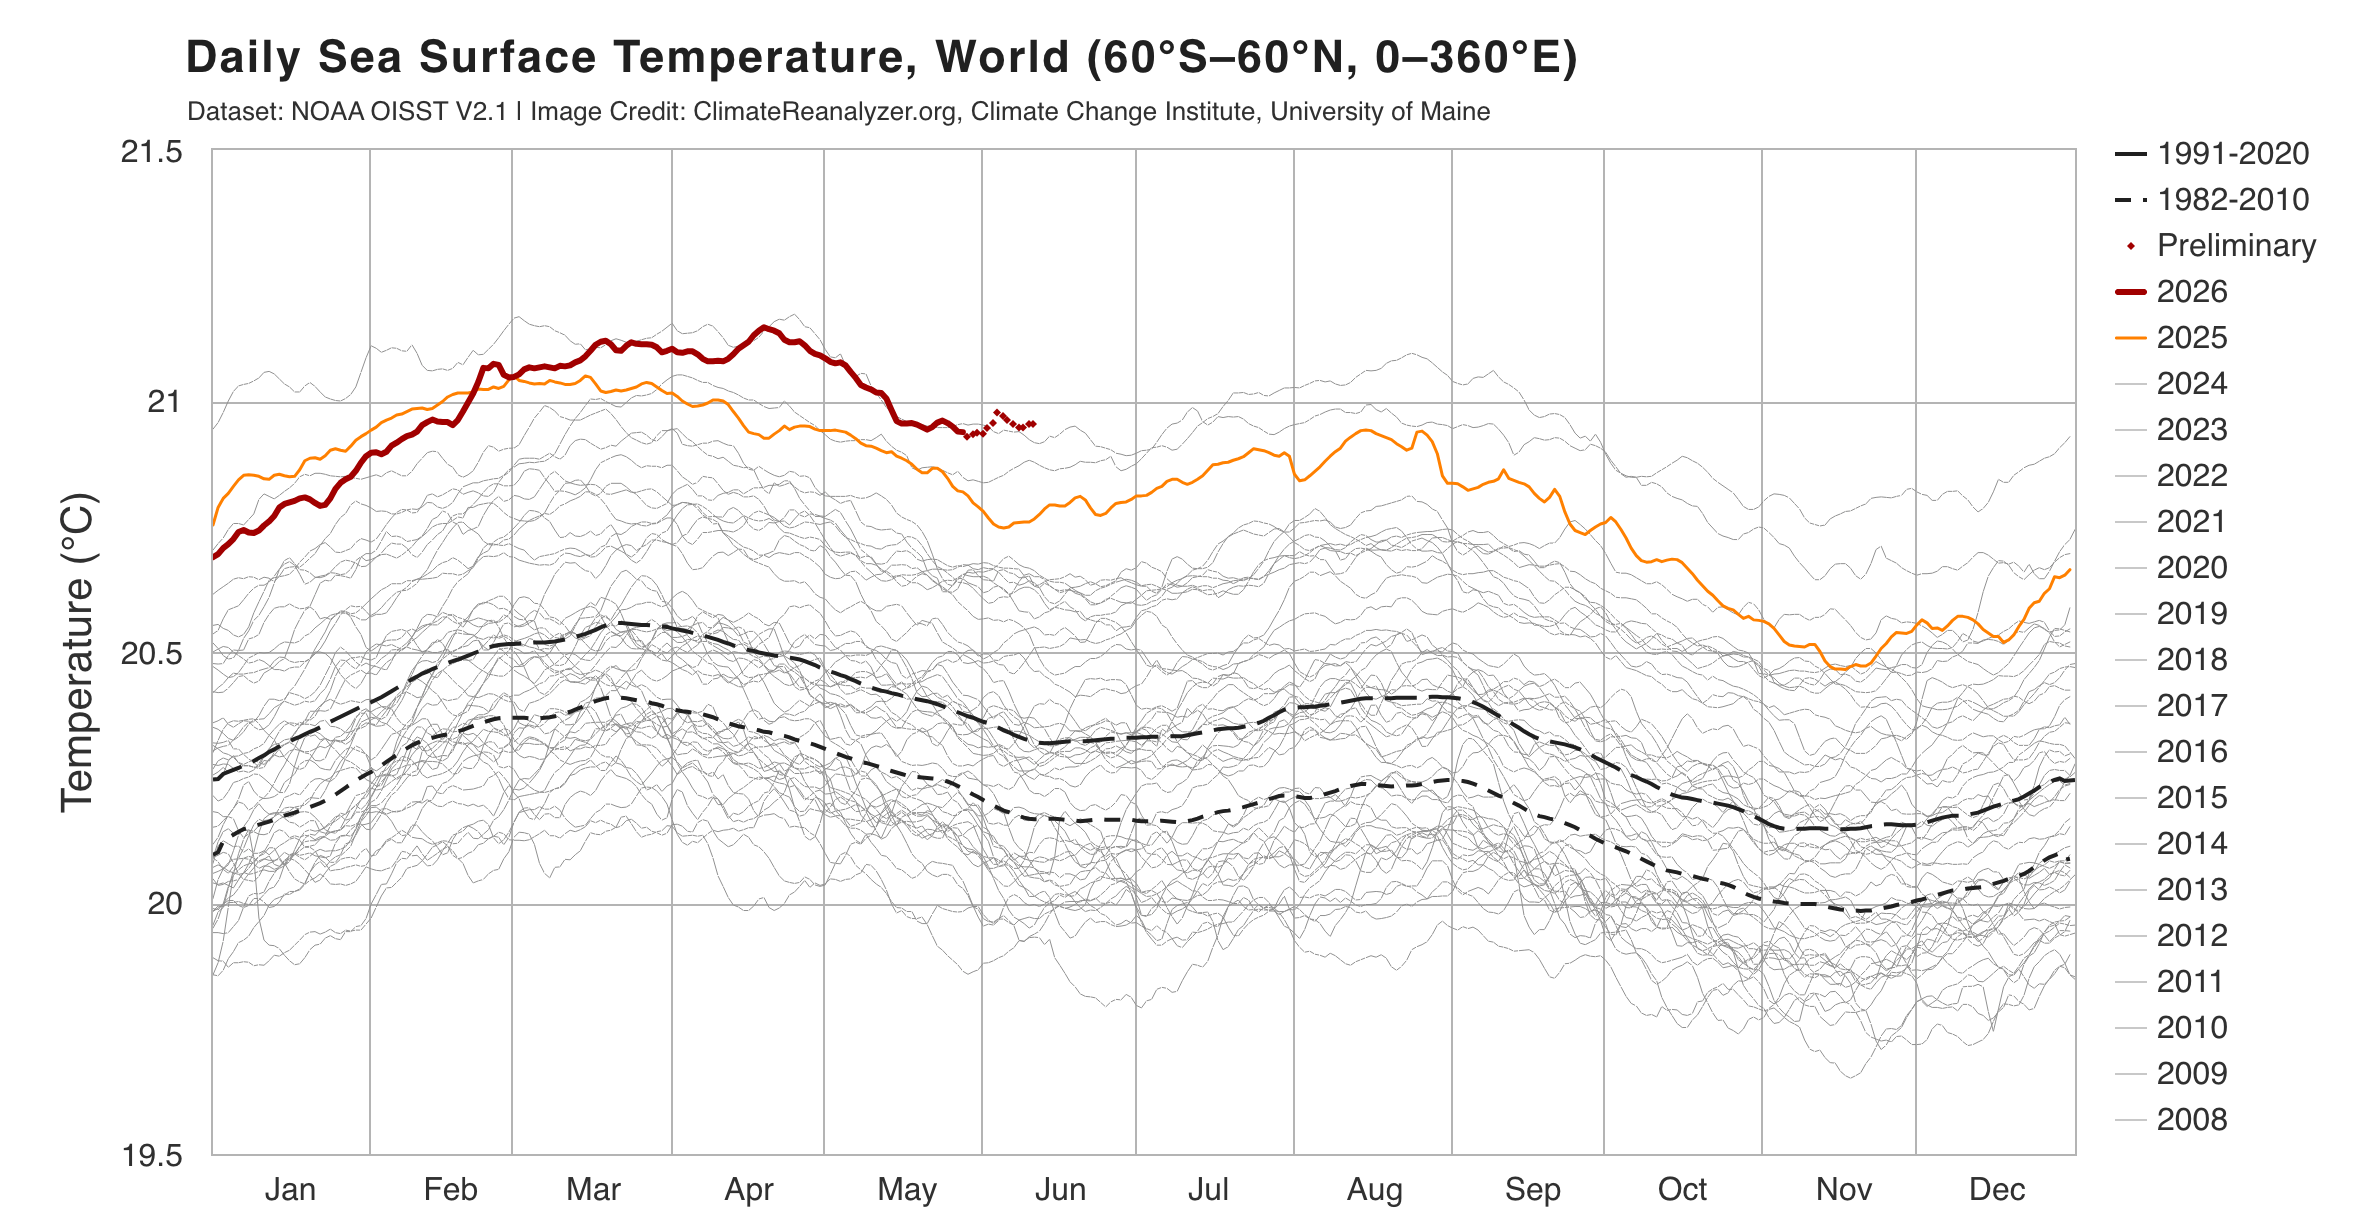
Daily sea surface temperature for the world (60°S–60°N, 0–360°E), comparing 2026 with prior years, together with the 1991–2020 and 1982–2010 climatological means. Data through: 14 July 2026.
Dataset: NOAA OISST V2.1. Image credit: ClimateReanalyzer.org, Climate Change Institute,
University of Maine. Data source and interactive figure:
Climate Reanalyzer.
Figure available as
PDF.
1f. Seasonal mean global temperature, 1990–present
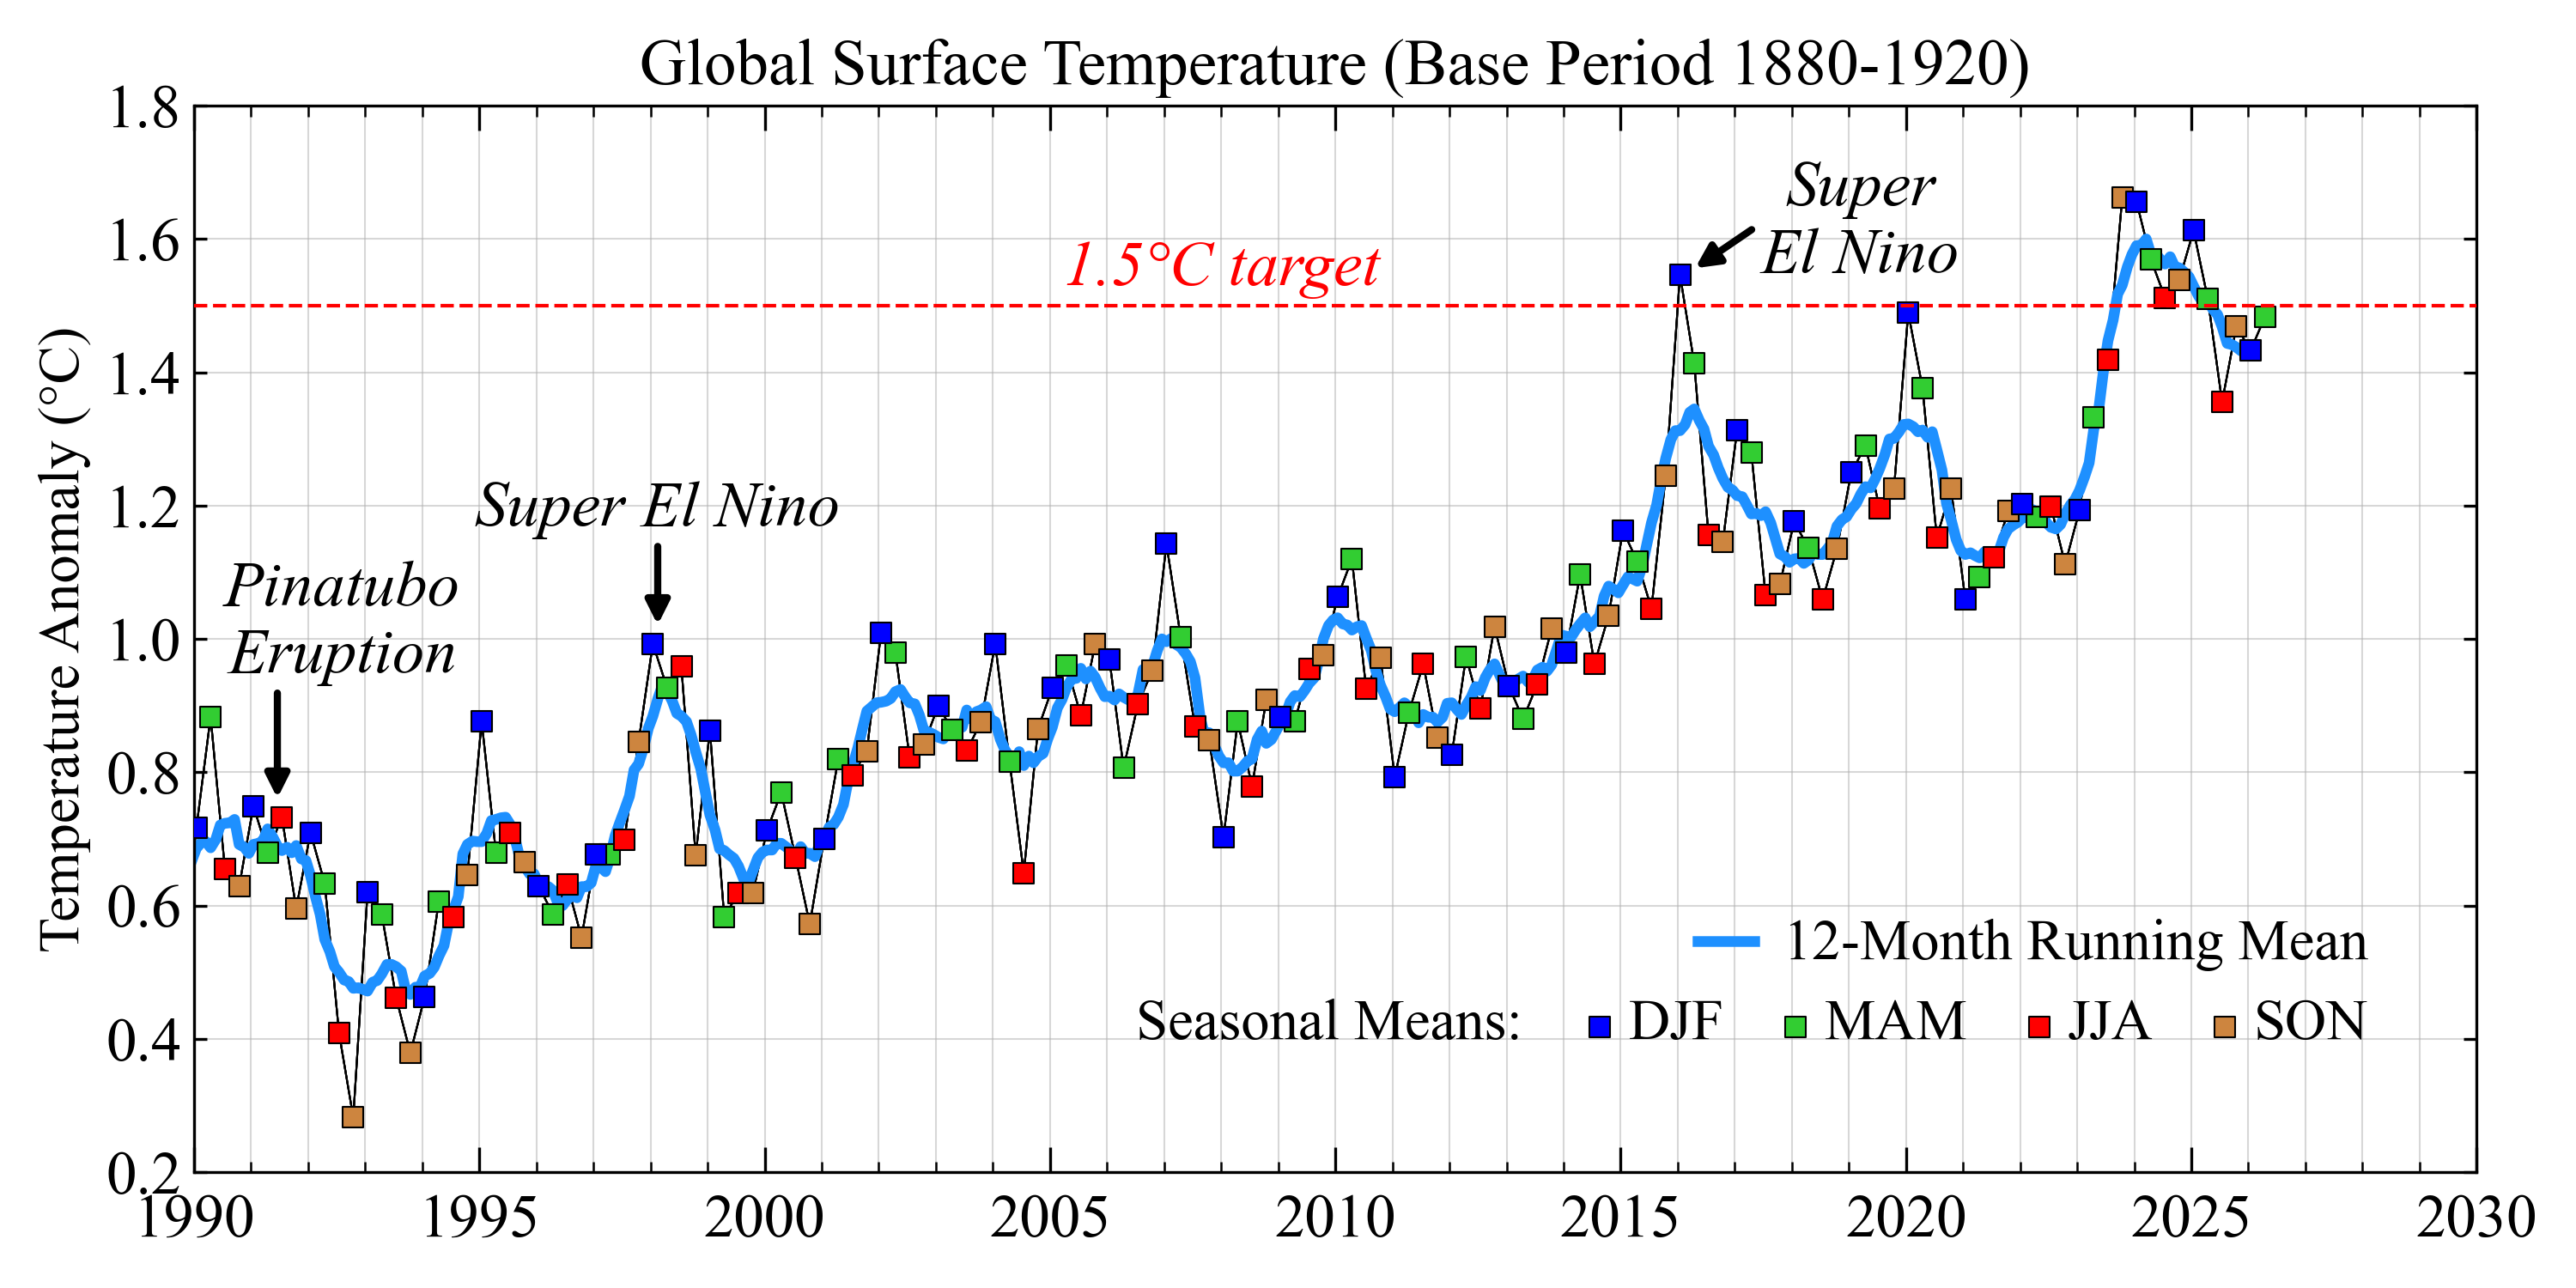
Seasonal mean global surface temperature anomalies relative to the 1880–1920 mean, 1990–present, shown together with the 12-month running mean. Seasonal means are plotted for DJF, MAM, JJA, and SON.
Data through June 2026. Data source: ref. [1].
Figure available as
PDF.
1g. Monthly global temperature anomalies, 1990–present
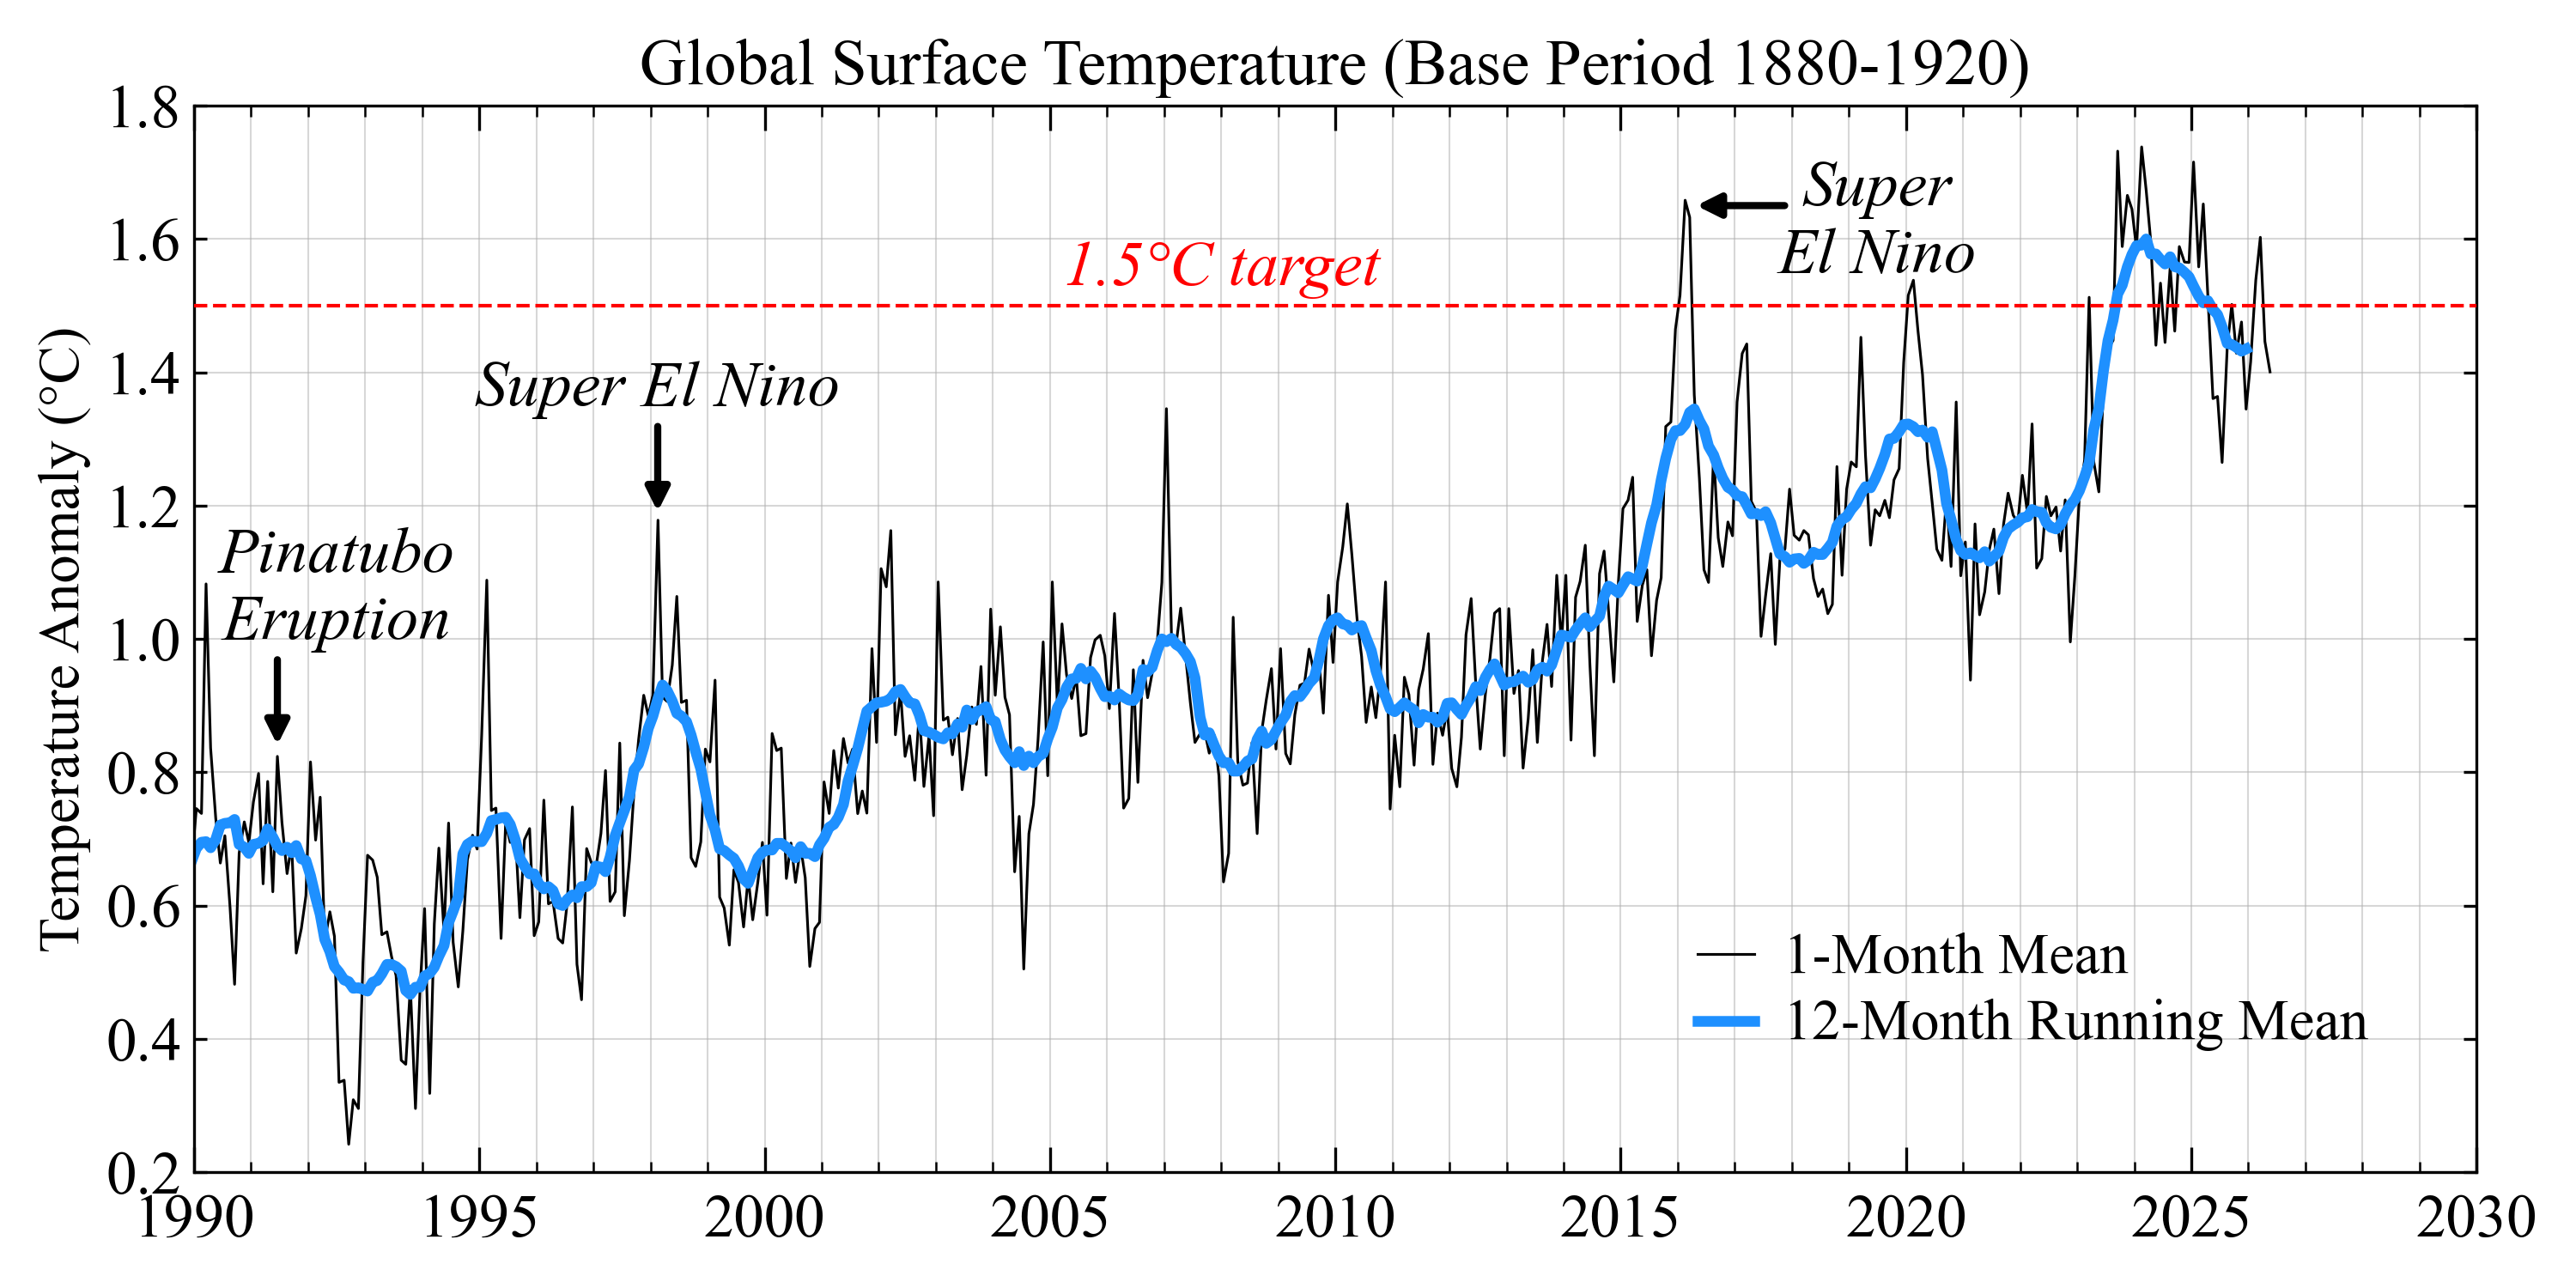
Monthly global surface temperature anomalies relative to the 1880–1920 mean, 1990–present, with a 12-month running mean overlaid. The plot highlights recent years and the emergence of the long-term warming trend above year-to-year variability.
Data through June 2026. Data source: ref. [1].
Figure available as
PDF.
2a. Zonal mean surface temperature, 1950–present
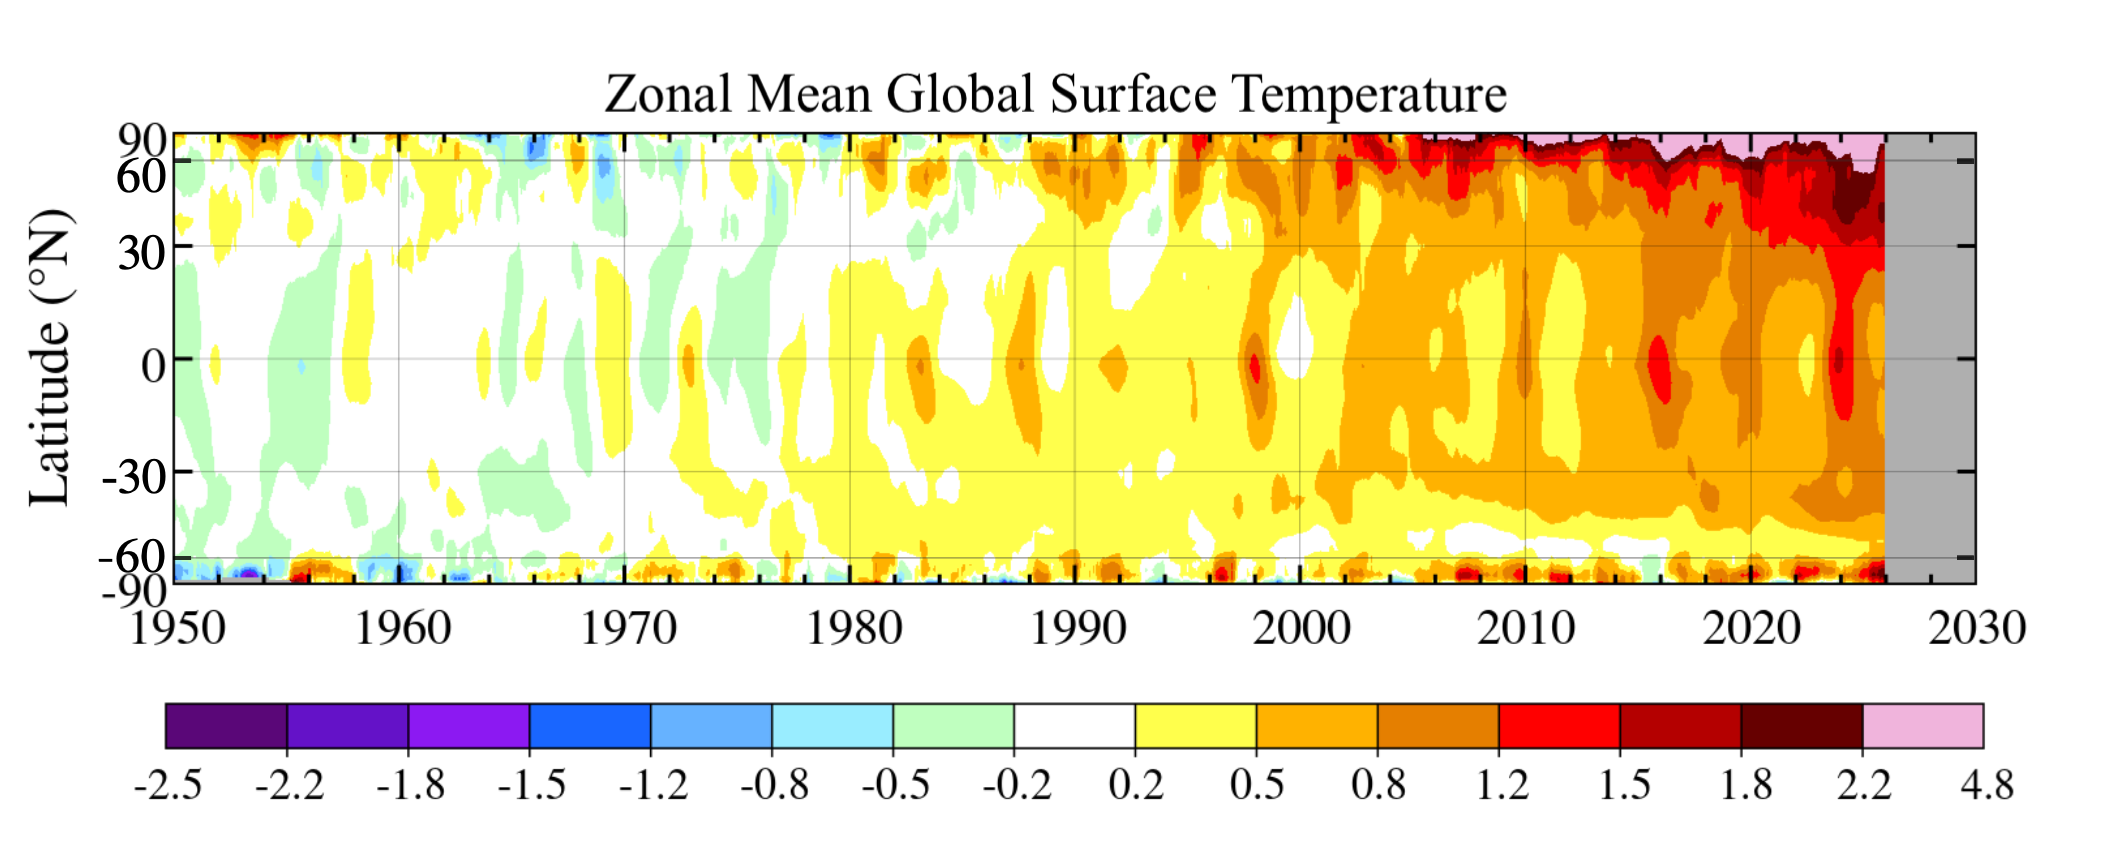
Zonal mean global surface temperature anomalies, 12-month running mean, 1950–present, showing the latitude dependence of global warming.
Base period: 1951–1980. Data through May 2026. Data source: ref. [1].
Figure available as
PDF.
2b. Zonal mean sea surface temperature, 1950–present
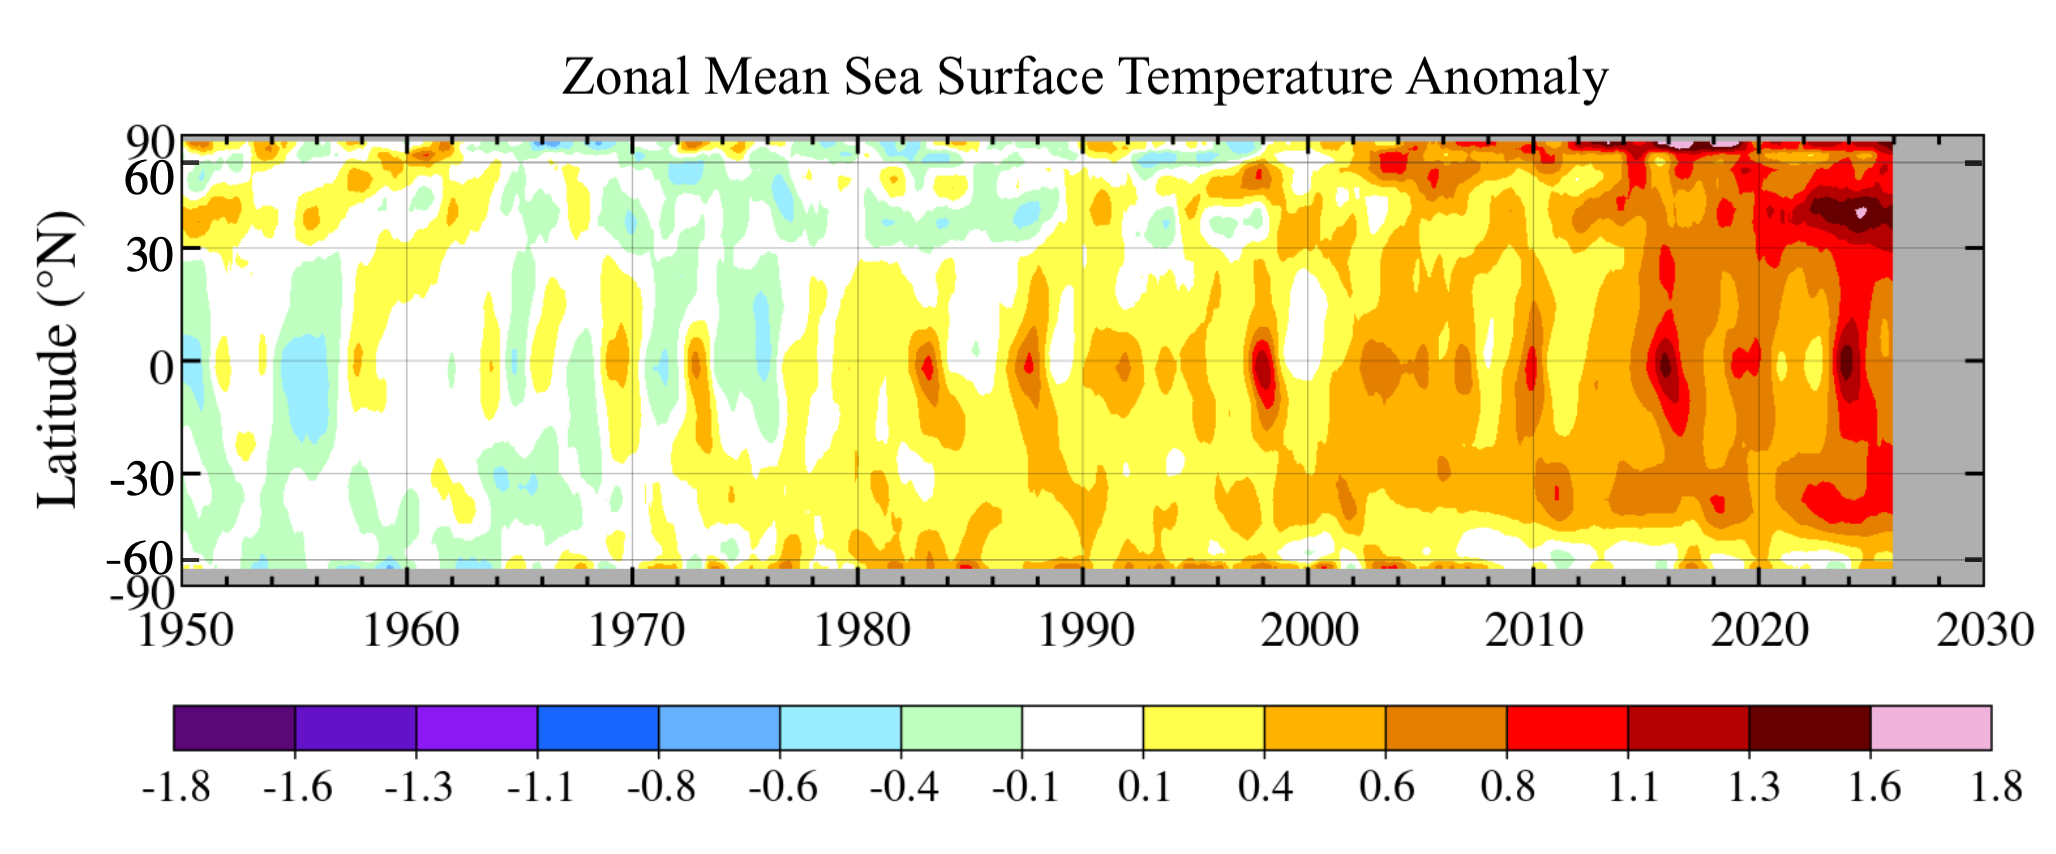
Zonal mean sea surface temperature anomalies, 12-month running mean, 1950–present.
Base period: 1951–1980. SST source: NOAA ERSSTv5, used in the GISS analysis; ERSSTv5 anomalies are defined relative to a 1971–2000 base period. Data through May 2026.
Data source: ref. [1].
Figure available as
PDF.
2c. Global and regional ocean temperature, 1950–present
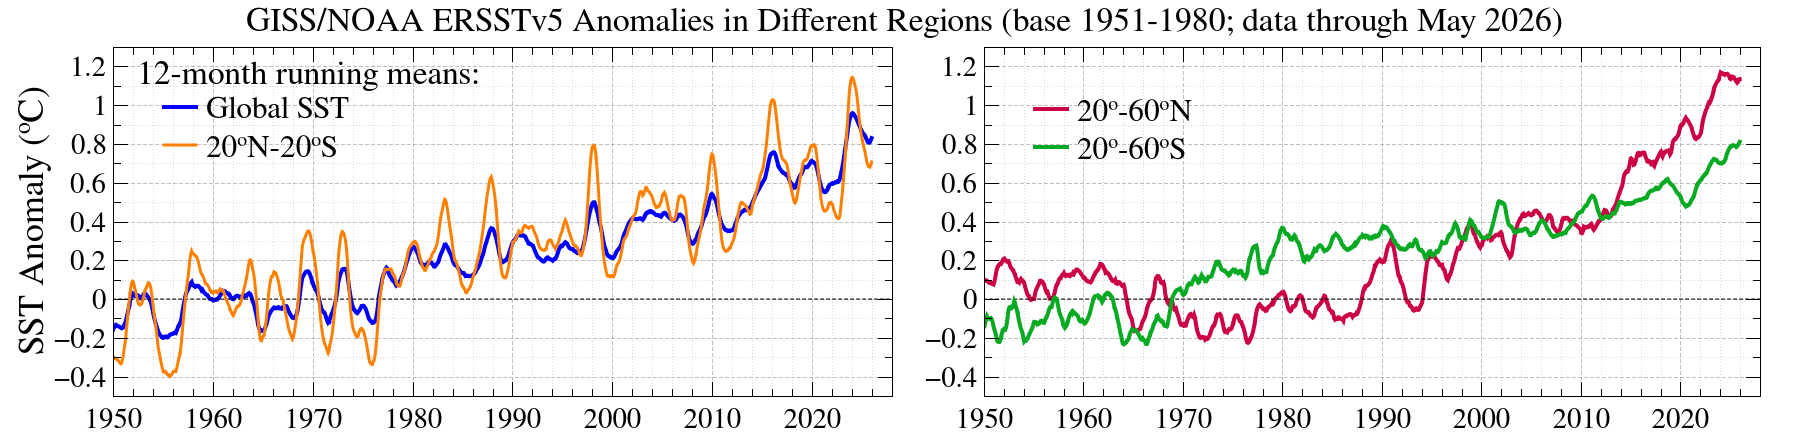
Sea surface temperature anomalies, 12-month running means, for the global ocean and three latitude bands: 20°N–20°S (tropical), 20°–60°N, and 20°–60°S, 1950–present.
Base period: 1951–1980. SST source: NOAA ERSSTv5, used in the GISS analysis; ERSSTv5 anomalies are defined relative to a 1971–2000 base period. Data through May 2026. Data source: ref. [1].
Figure available as
PDF.
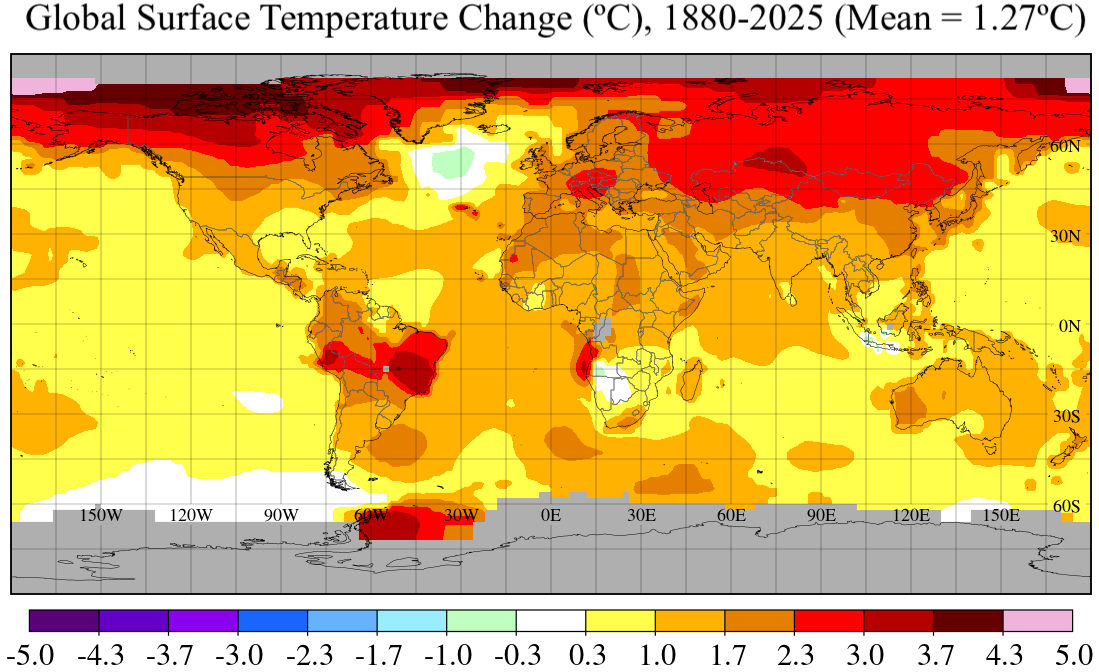
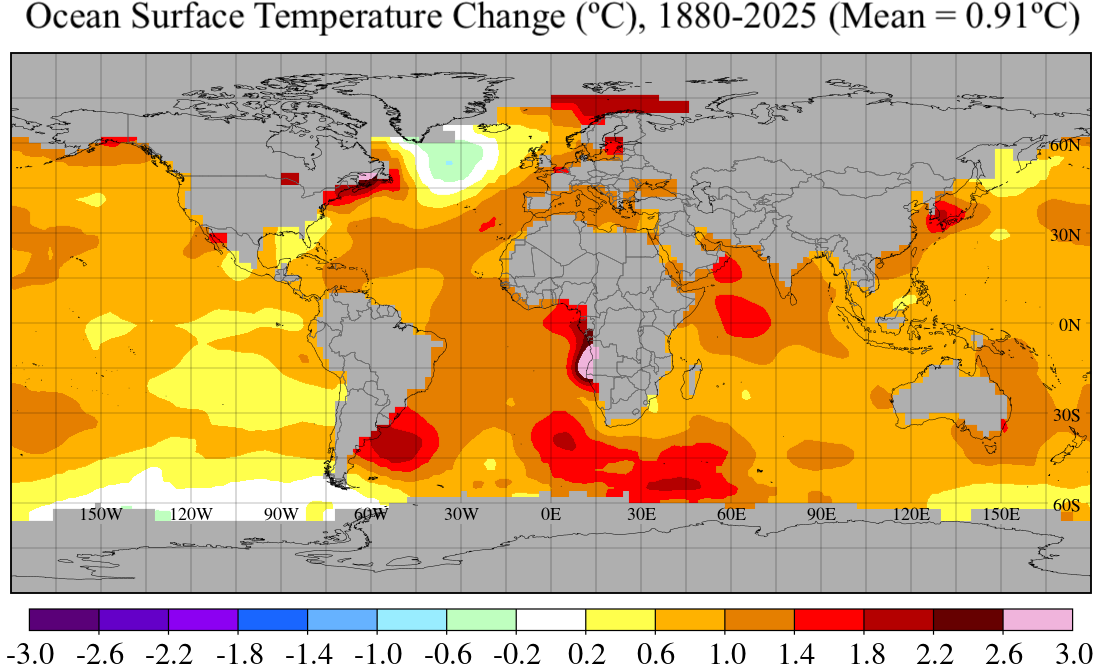
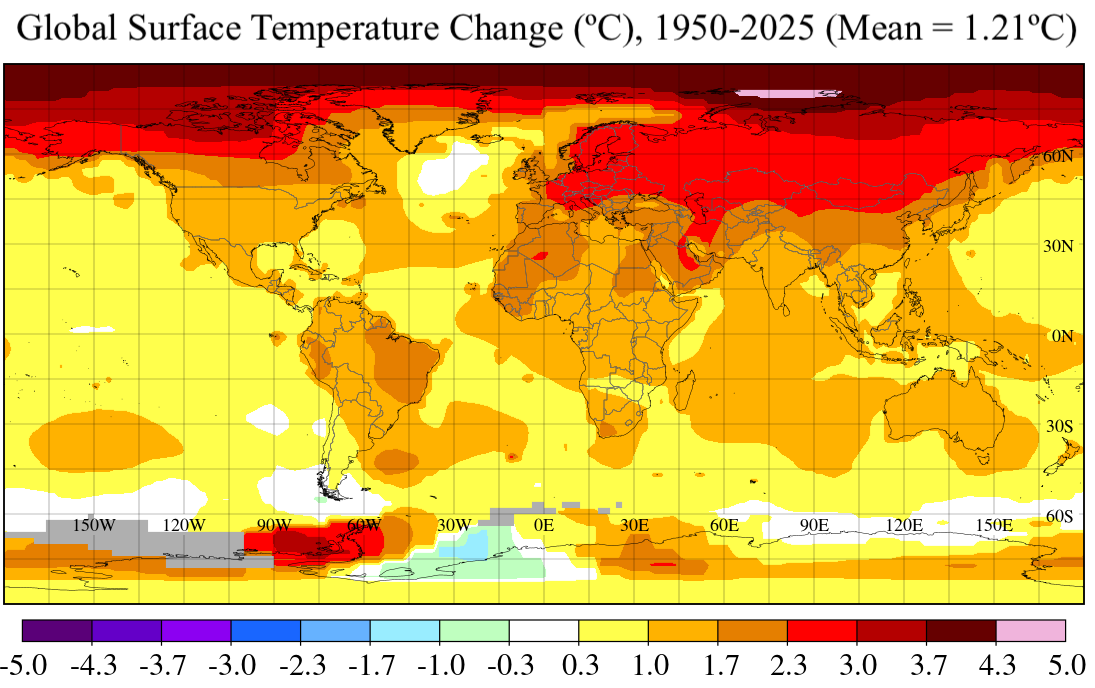
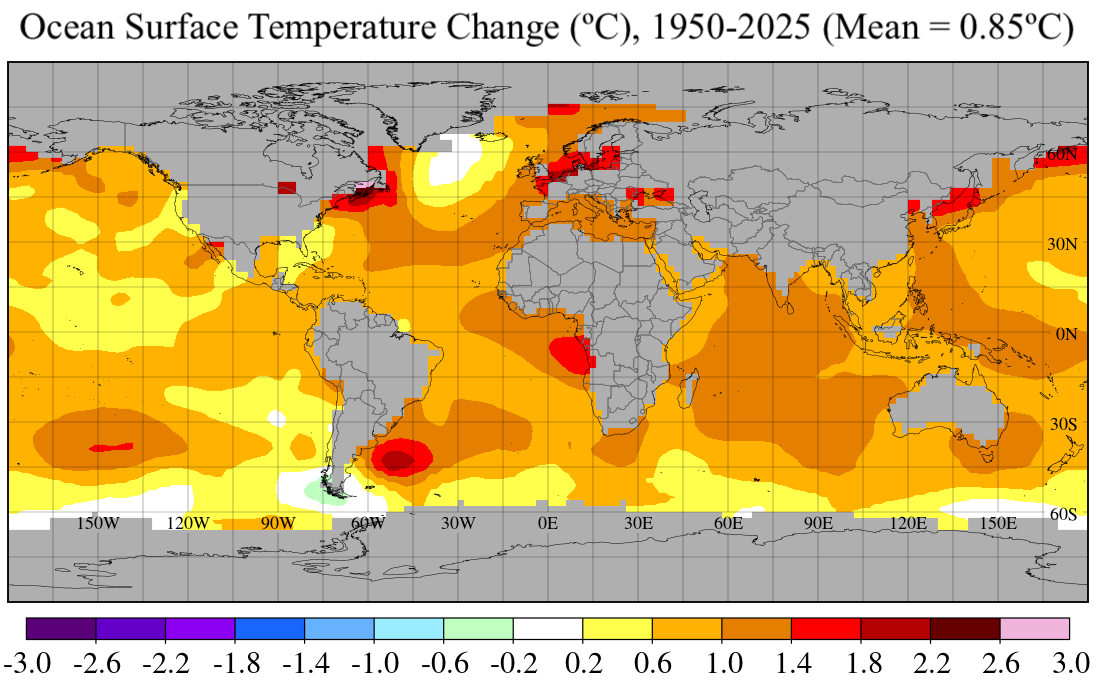
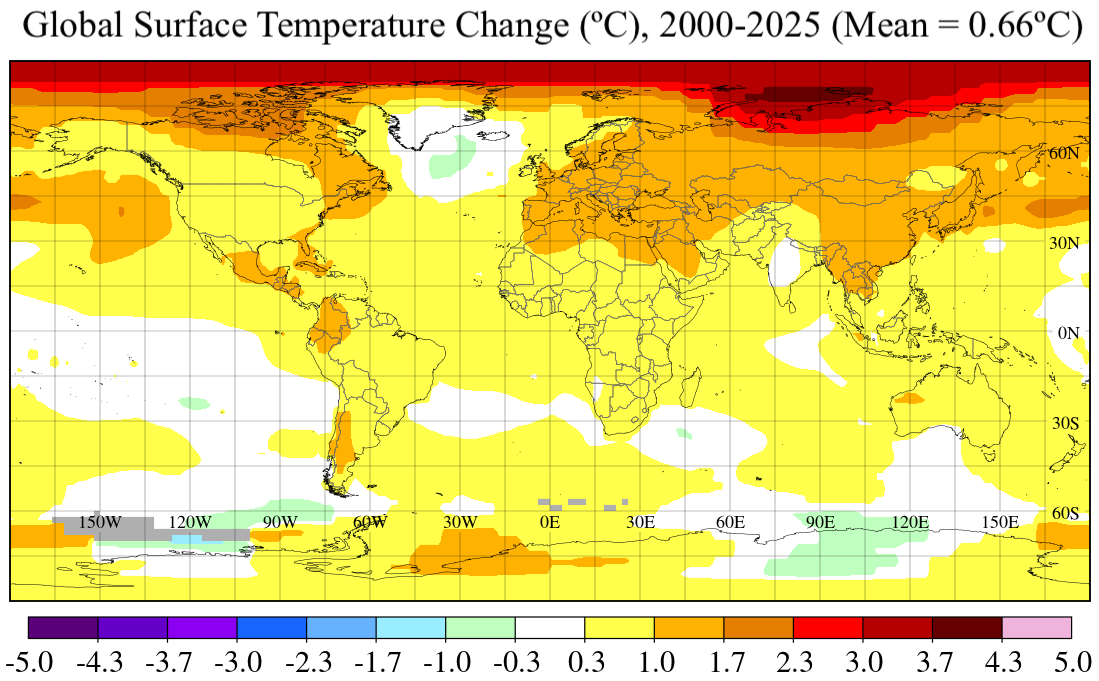
3a. Global temperature change based on local linear trends
 |
 |
 |
 |
 |
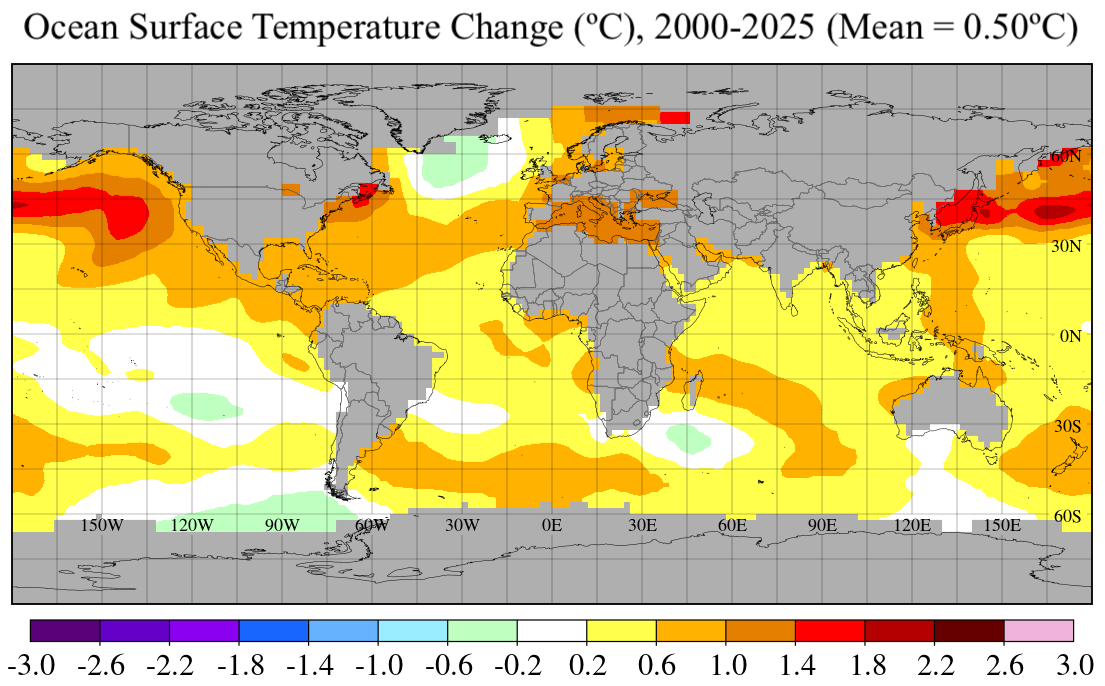 |
Global maps of temperature change based on local linear trends in land–ocean surface temperature and sea surface temperature (SST) for periods starting in 1880, 1950, and 2000. Changes are based on monthly anomalies from Jan 1880–Dec 2025, Jan 1950–Dec 2025, and Jan 2000–Dec 2025, respectively, relative to the 1951–1980 mean, using the GISS temperature analysis with NOAA ERSSTv5 sea surface data. ERSSTv5 anomalies are defined relative to a 1971–2000 base period, but the fields shown here are expressed relative to the 1951–1980 baseline used in the GISS analysis. Maps use the GISS 1200 km smoothing option. These maps highlight regional variations in warming, with amplified changes over land and at high northern latitudes.
Data through December 2025 using the May 2026 release
Data source:
ref. [1].
Figure available as PDF:
LOTI 1880–2025,
SST 1880–2025,
LOTI 1950–2025,
SST 1950–2025,
LOTI 2000–2025,
SST 2000–2025.
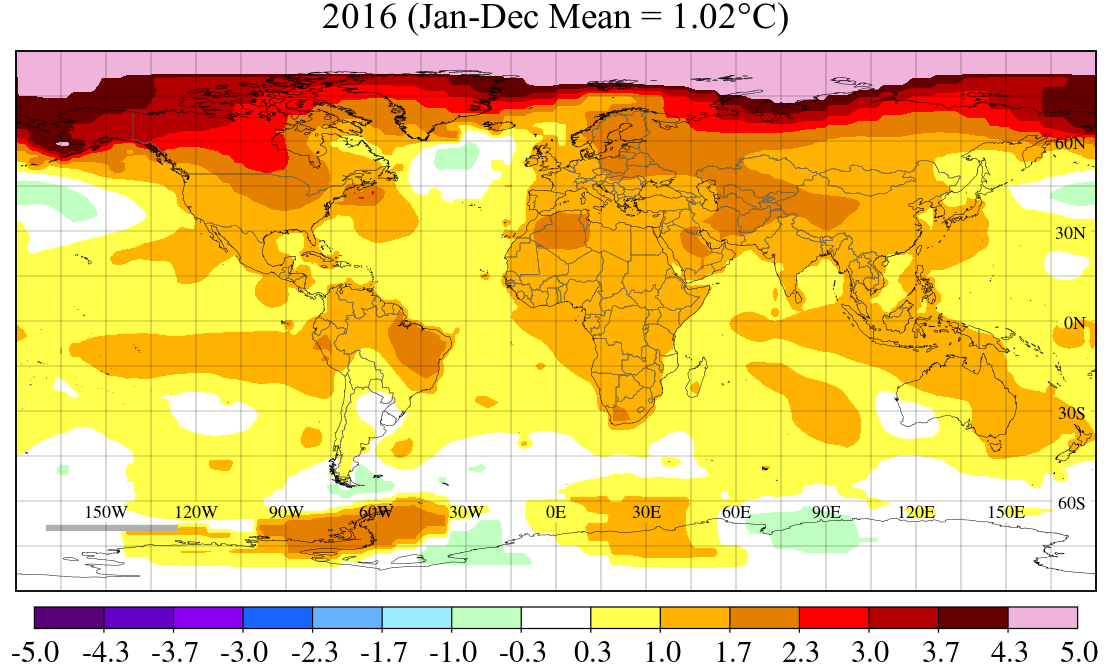
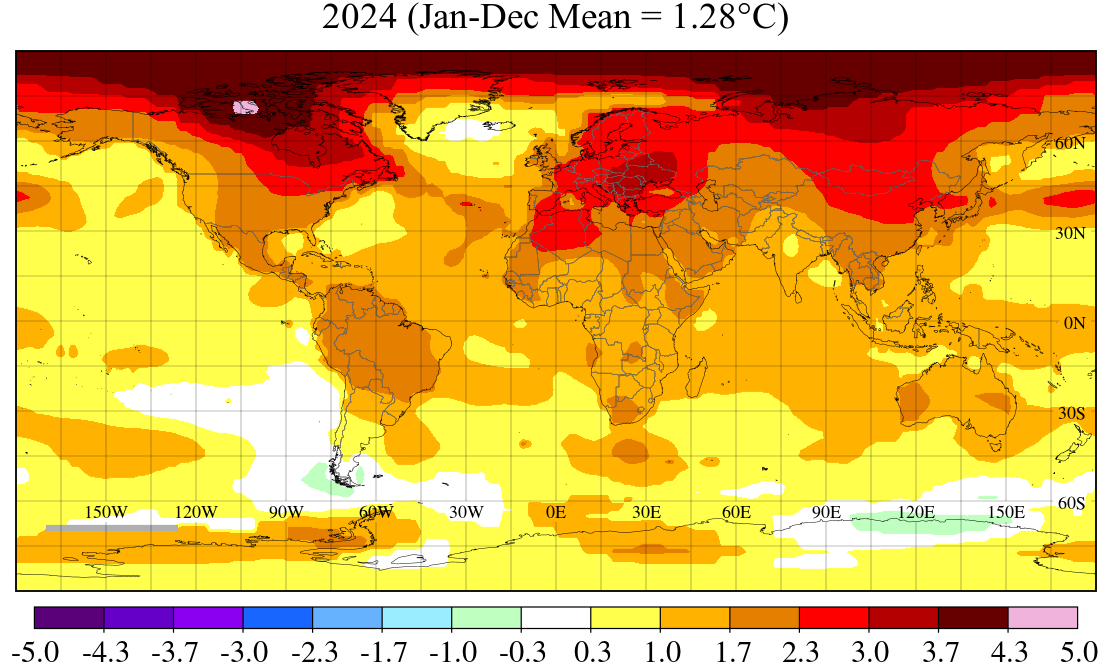
3b. Annual mean surface temperature anomaly maps, 2016–2025 (Jan–Dec)
 |
 |
 |
 |
 |
 |
 |
 |
|

|
Annual means through 2025. Based on the May 2026 GISTEMP dataset release.
Data source: ref. [1].
Figures available as PDF:
2016,
2017,
2018,
2019,
2020,
2021,
2022,
2023,
2024,
2025.
Annual mean global surface temperature anomaly maps for the past ten years (2016–2025), relative to the 1951–1980 mean. These maps show the spatial pattern of recent warming and allow comparison between different El Nino and La Nina years.
A full archive of annual maps beginning in 1990 is available on the More Figures page.
References