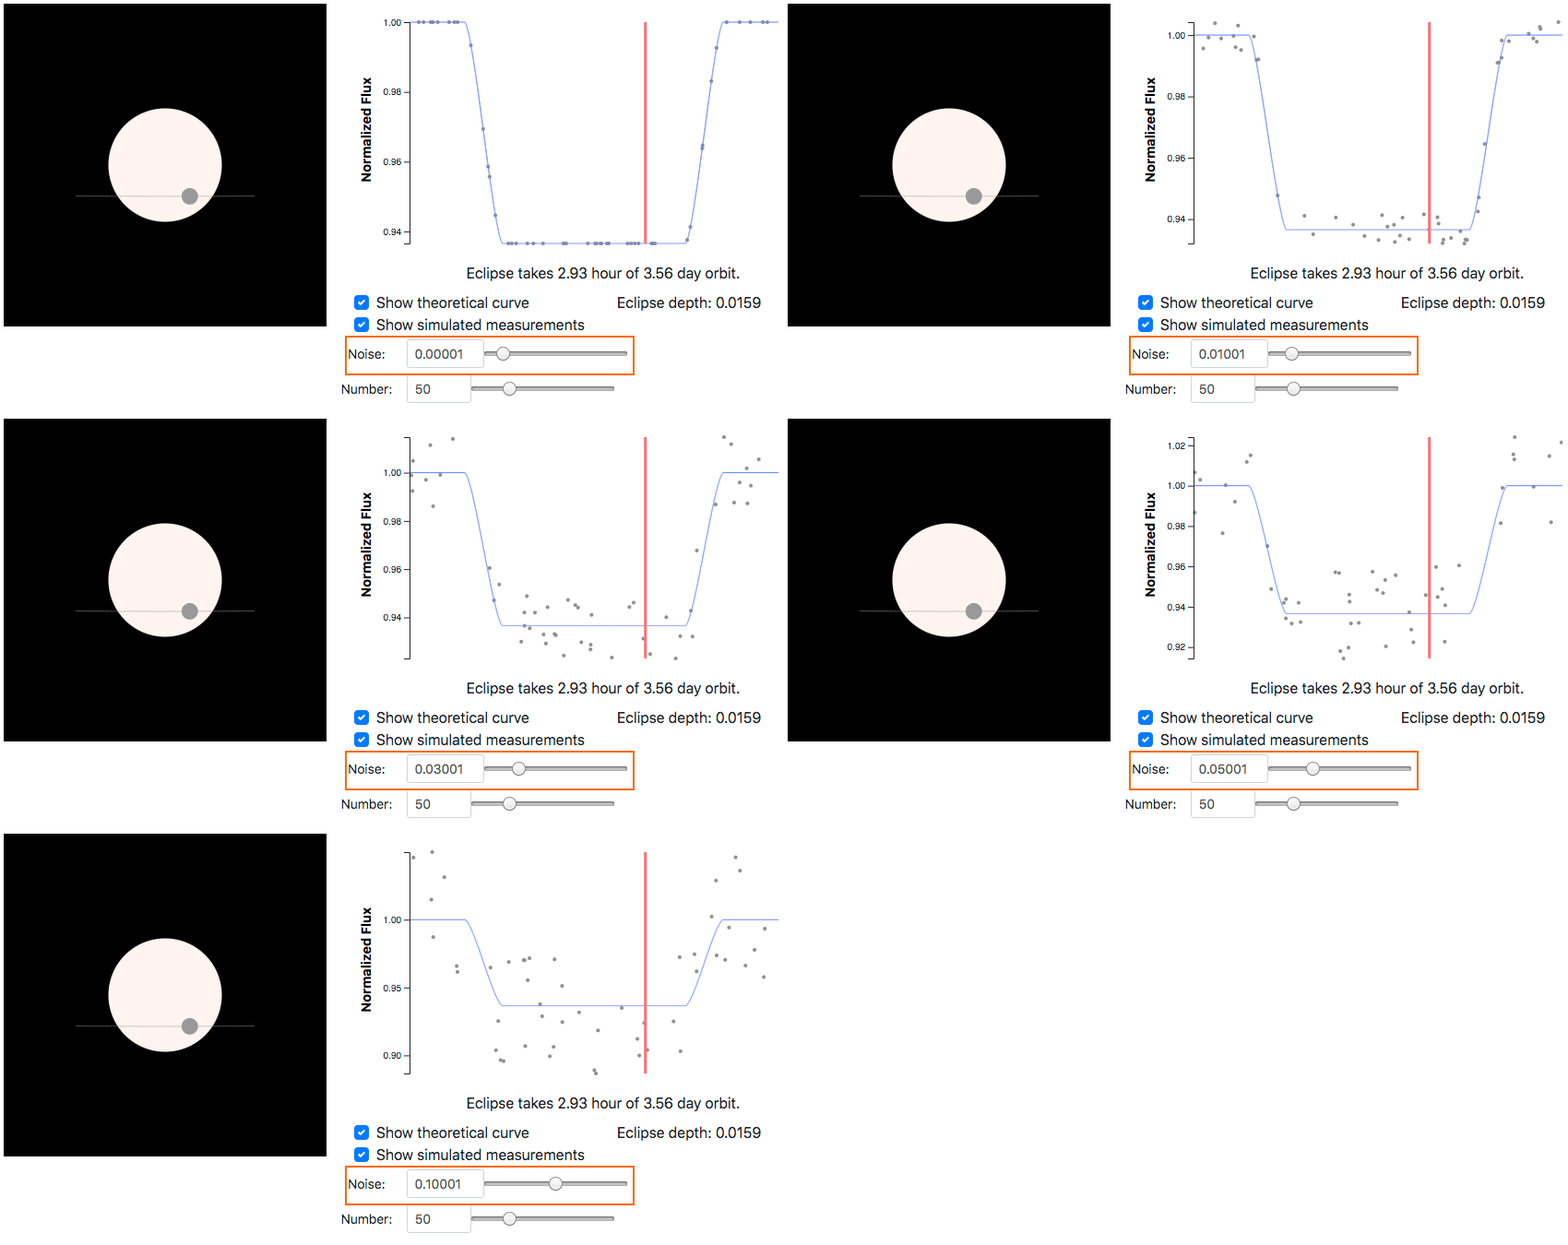
I've been working on an Exoplanet Transit Simulator, and part of this simulation displays randomized data, with an adjustable randomization factor, connected to an arbitrary curve. When you click "Show simulated measurements", you can adjust the noise level of data points connected to the lightcurve. These data points are what an astronomer sees when looking for clues of a planet orbiting a distant star.

We start off with the theoretical lightcurve. This is generated by some complicated calculations in Lightcurve.js. It's just a 2-dimensional array representing x-y values on the plot.
Here I'll go through the noise data function and describe how it's put together.
/**
 * Generate noise around the lightcurve.
 */
getNoiseData(lightcurveData) {
    if (!this.props.showSimulatedMeasurements) {
        return [];
    }
First, find the extent of the lightcurve data - these X values go somewhere between 0 to 400.
const xExtent = d3.extent(lightcurveData, d => d[0]);
xExtent is now [0, 400]. Now we'll make a bunch of
random X values for this noise. The Y values are influenced by the actual
lightcurve, but the X values are just completely random.
    const randomizedData = [];
    for (let i = 0; i < this.props.simMeasurementNumber; i++) {
        const randX = Math.random() * xExtent[1];
Now I have a random X value for this noise
data. Great. But how do I define the Y value? It
can't be completely random: it needs to be tied to
the lightcurve, with an adjustable randomness.
Well the first step is finding where the
lightcurve is at this random X value. That's not
so straightforward, because I don't have just a
mathematical formula for the curve that I can plug
randX into.
d3 has a family of "bisector" functions that return the index in an array where a given x value belongs, if it were to be inserted and maintain sorted order. So that's what I'm using here: this says, give me the index into lightcurveData where randX belongs. I don't actually modify lightcurveData, just use that index to find the closest Y value.
        // Find the closest lightcurve point to this random x
        // value.
        const idx = d3.bisector(function (d) {
            return d[0];
        }).left(lightcurveData, randX);

        // Generate noise based on the real y val.
        const y = lightcurveData[idx][1];
The rest is pretty straightforward: add some level of randomness to this Y value, depending on the adjustable noise value.
        const newY = y + (
            // Scale the randomization factor by the value
            // of the "noise" slider
            (Math.random() - 0.5) * this.props.noise);

        randomizedData.push([randX, newY]);
    }

    return randomizedData;
}
- LightcurveView.jsx