|
Networking > Modem Pool Usage Graphs The graphs below show the utilization patterns of the CUIT dialup modem pool. Because of the demand for access to the modem pool, we are providing these statistics to help people plan their usage patterns accordingly. CUIT also uses these statistics to help plan for additions and upgrades to the pool. Hourly | Daily | Weekly | Monthly Hourly GraphsColumbia Main Modem Pool (total lines: 506)  Columbia Express Pool (total lines: 23)  Back to Top Daily GraphsColumbia Main Modem Pool (total lines: 506)  Columbia Express Pool (total lines: 23) 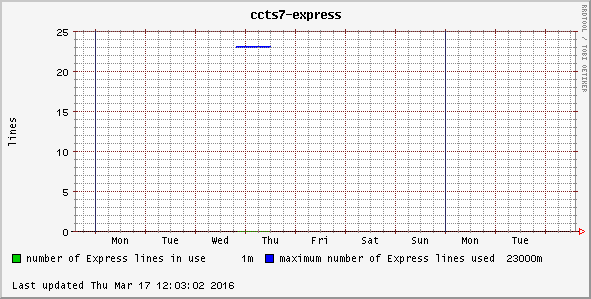 Back to Top Weekly GraphsColumbia Main Modem Pool (total lines: 506)  Columbia Express Pool (total lines: 23) 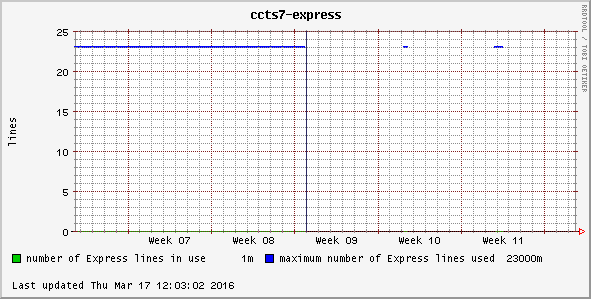 Back to Top Monthly GraphsColumbia Main Modem Pool (total lines: 506) Columbia Express Pool (total lines: 23) 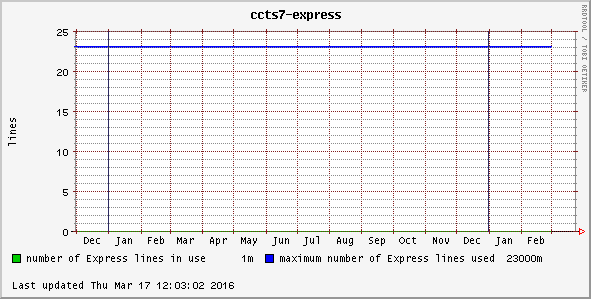 Back to Top |
| CU Home | A-Z Index | Help |
 |
||||||
|
|
|||||
|
|
|||||
|
|||||