
Stop the variance fetishism!
Variance is a descriptive statistic that maybe is more fundamental than anything mentioned so far in these pages. More fundamental than linear regression, p-values, sensitivity, specificity, multivariate analysis, correlation, etc. I think the variance concept can be appreciated by second-graders. Yet, variance is vastly under-appreciated by the stochastically illiterate American zeitgeist which is which -in its zeal to credit individual talents and efforts- does not like to give credence to chance. This is a topic for a whole book of social and cultural studies for which I am not qualified, so I will return to my main, much narrower, point here.
My concern is an inferential misunderstanding that pervades seminar and conference discussion in the Life Sciences. As I said at the beginning, variance is a descriptive statistic; the emphasis is on “descriptive”, but this is very easily forgotten. Many people –myself included- find it tempting to use variance as an inferential statistic, similar to a p-level, with absolute meaning. In seminars probably everybody has witnessed questions and discussions along the lines of ‘How much variance is explained in the dependent variable?’ with nods of approval about putative sufficient amounts, or quizzical looks over questionably small amounts. 20% might just be tolerable, while 1% might cause severe consternation.
It is good to sit back and recall some elementary facts about variance, particular as it pertains to “variance explained” in linear regression, or “variance accounted for” in multivariate decompositions. I would bet everybody has some familiarity with these facts and they are not surprising to most people. Regarding linear regression, let’s remind ourselves that the variance explained in the dependent variable varies with both the p-level and the number of observations. This can be seen easily in the figure below where I regressed a Gaussian variable against itself adding Gaussian noise of various severity levels. I also picked different numbers of observations, N=20, 40, 80.
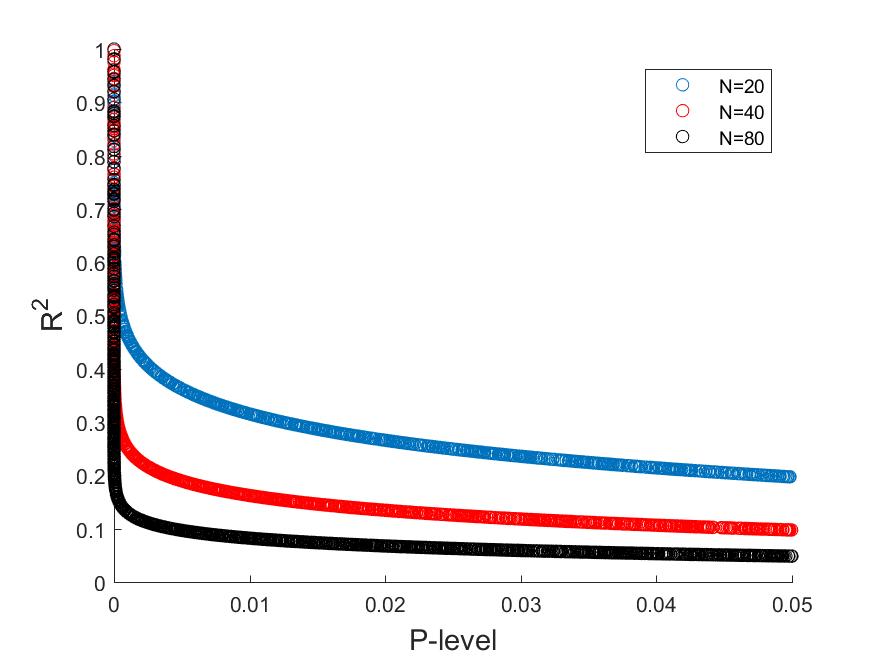
One can appreciate that the variance explained, R^2, varies inversely with the p-level and with the number of observations. For the same p-level, say p=0.01, N=20 requires R^2=0.35, while N=80 only requires R^2=0.1. If we increase the number of observations dramatically, say N=4,000, much smaller R^2 values (<0.05) are permissible. This makes the first problem obvious: variance is not an absolute inferential statistic, but it’s relative and descriptive, and depends on some other parameters. Even proponents of “variance fetishism” will probably concede this fact; yet their parlance suggests absolute meaning where particularly the number of observations does not really matter. This is similar for the statistic “variance accounted for” in multivariate data decompositions. For years I sat in a weekly lab meeting where multivariate linear models were discussed and exulted about with exclamations about the variance accounted for by the major singular values in the data. Sometimes these data sets contained only 4 data points(!). Similarly, some of my close collaborators will routinely ask “How much variance does the pattern account for?” for any derived linear combination of a set of Principal Components in a structural or functional MRI data set, as if that number by itself is an important metric of the quality of statistical robustness. This is understandable and usually comes from empirical heuristics these investigators have developed over lifetime careers, but –again- it does not make a lot of sense, particularly when the number of observations in different analyses shows considerable variation. By design, a linear combination of Principal Components has to account for less variance than PC 1 (the PC that contributes the highest variance amount), and for more variance than PC N (the PC that contributes the least amount). For a large neuroimaging data set, which is not uncommon nowadays in the era of population neuroimaging, the data rank N can be in the thousands. So it can easily happen after particular normalization schemes that PC 1 only accounts for a single-digit percentage of the total variance in the data set. Any derived pattern involving a set of PCs will thus account for even less variance, although it might be highly reproducible and predict some external variable with great reliability out of sample. Insisting on some absolute threshold for the variance accounted for in the data array –regardless of the number of observations- is thus quite misguided.
If we return to the linear-regression example: there is a further parameter, we have neglected to mention – model complexity, i.e. the number of inputs. In my toy example, there was only one independent variable. However, in general the variance explained in the dependent variable trivially increases with the number of independent variables, to the point of severe over-fitting. This is another caution against blind adherence to the principle of minimum thresholds for the explained variance. Your R^2 might look great according to some gut-feeling criterion, but are you sure the model has good out-of-sample predictive utility? The bias-variance trade-off is subject to a whole slew of information-theoretic criteria (AIC, BIC, MDL, N-fold cross-validation) and its own field of investigation – touting variance as sufficient for model fit in a way negates this whole endeavor.
Long speech, but here is the quick upshot: large variance is not always better (i.e. more robust and reliable), and how large a variance amount really is cannot be determined in a stand-alone way without referencing a lot of other statistics about the data set under consideration. Best to avoid the variance talk!