
Annual statistical report
(New York, N.Y. : The Company, )
|
||

 Click here and hold to drag menu around
|


|
|
|
|
| Page 66 |
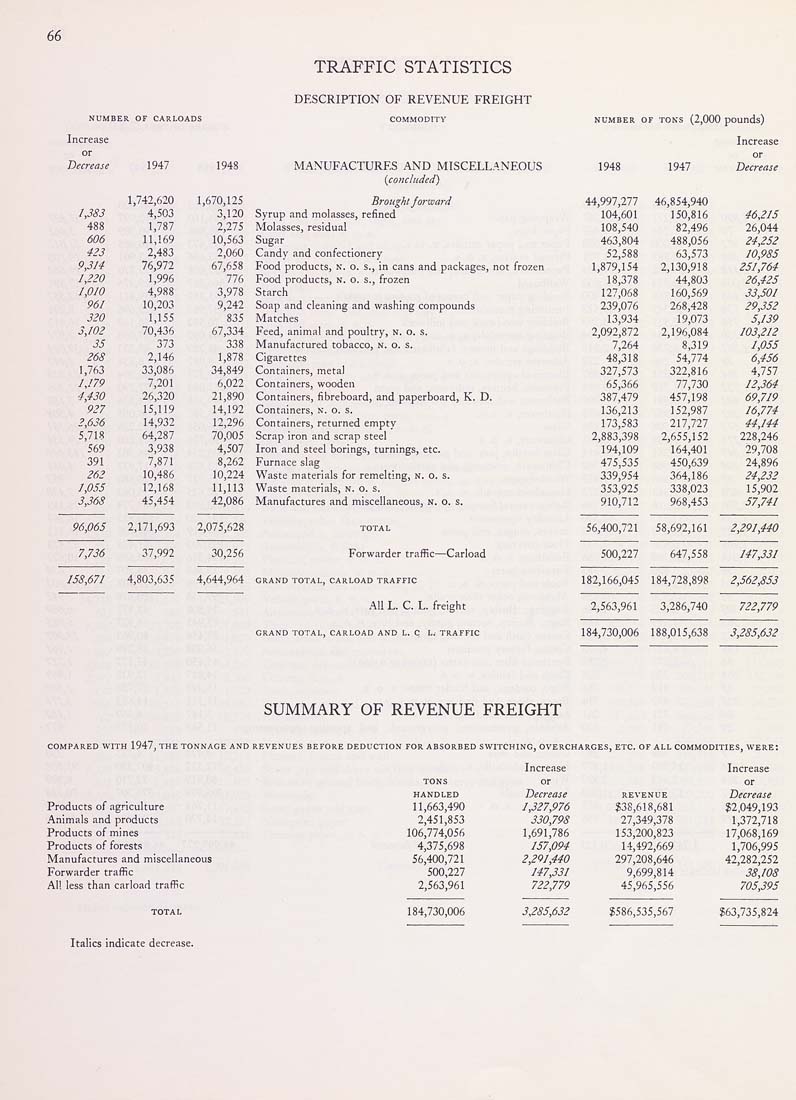
66 TRAFFIC STATISTICS DESCRIPTION OF REVENUE FREIGHT NUMB! Increase L OF carload: COMMODITY MANUFACTURES AND MISCELLANEOUS (concluded) 1,742,620 1,670,125 Brought forward 1,383 4,503 3,120 Syrup and molasses, refined 488 1,787 2,275 Molasses, residual 606 11,169 10,563 Sugar 423 2,483 2,060 Candv and confectionety 9,314 76,972 67,658 Food products, N. 0. s., in cans and packages. 1,220 1,996 776 Food products, N. o. s., frozen 1,010 4,988 3,978 Starch 961 10,203 9,242 Soap and cleaning and washing compounds 320 1,155 835 Matches 3,102 70,436 67,334 Feed, animal and poultry, N. o. s. 35 373 338 Manufactured tobacco, n. o. s. 268 2,146 1,878 Cigarettes 1,763 33,086 34,849 Containers, metal 1,179 7,201 6,022 Containers, wooden 4,430 26,320 21,890 Containers, fibreboard, and paperboard, K. D 927 15,119 14,192 Containers, n, o. s. 2,636 14,932 12,296 Containers, returned emptv 5,718 64,287 70,005 Scrap iron and scrap steel 569 3,938 4,507 Iron and steel borings, turnings, etc. 391 7,871 8,262 Furnace slag 262 10,486 10,224 Waste materials for remelting, n. o. S. 1,055 12,168 11,113 Waste materials, n. o. s. 3,368 45,454 42,086 Manufactures and miscellaneous, n, o. S, 96,065 2,171,693 2,075,628 total 7,736 37,992 30,256 Forwarder traffic—Carioad 158,671 4,803,635 4,644,964 GRAND TOTAL, CARLOAD TRAFFIC Al! L. C. L. freight ND TOTAL, CARLOAD AND L. C L.- TBAFF NUMBER OF TONS (2,000 pounds) Increase 44,997,277 46,854,940 104,601 150,816 46,215 108,540 82,496 26,044 463,804 488,056 24,252 52,588 63,573 10,985 1,879,154 2,130,918 251,764 18,378 44,803 26,425 127,068 160,569 33,501 239,076 268,428 29,352 13,934 19,073 5,139 2,092,872 2,196,084 103,212 7,264 8,319 1,055 48,318 54,774 6,456 327,573 322,816 4,757 65,366 77,730 12,364 387,479 457,198 69,719 136,213 152,987 16,774 173,583 217,727 44,1U 2,883,398 2,655,152 228,246 194,109 164,401 29,708 475,535 450,639 24,896 339,954 364,186 24,232 353,925 338,023 15,902 910,712 968,453 57,741 56,400,721 58,692,161 2,291,440 500,227 647,558 147,331 182,166,045 184,728,898 2,562,853 2,563,961 3,286,740 722,779 184,730,006 188,015,638 3,285,632 SUMMARY OF REVENUE FREIGHT COMPARED WITH 1947, THE TONNAGE Products of agriculture .'Animals and products Products of mines Products of forests Manufactures and miscellaneous Forwarder traffic Al! less than carload trafHc Italics indicate decrease. for ABSORBED SW ITCHING, OVERCH 4RCES, ETC. OF ALL COMMODITIES, WERE: Incre.tse Increase TONS or or HANDLED Decrease REVENUE Decrease 11,663,490 1,327,976 838,618,681 $2,049,193 2,451,853 330,798 27,349,378 1,372,718 106,774,056 1,691,786 153,200,823 17,068,169 4,375,698 157,094 14,492,669 1,706,995 56,400,721 2,291,440 297,208,646 42,282,252 500,227 147,331 9,699,814 38,108 2,563,961 722,779 45,965,556 705,395 184,730,006 3,285,632 $586,535,567 $63,735,824 |
| Page 66 |