Analysis and Testing
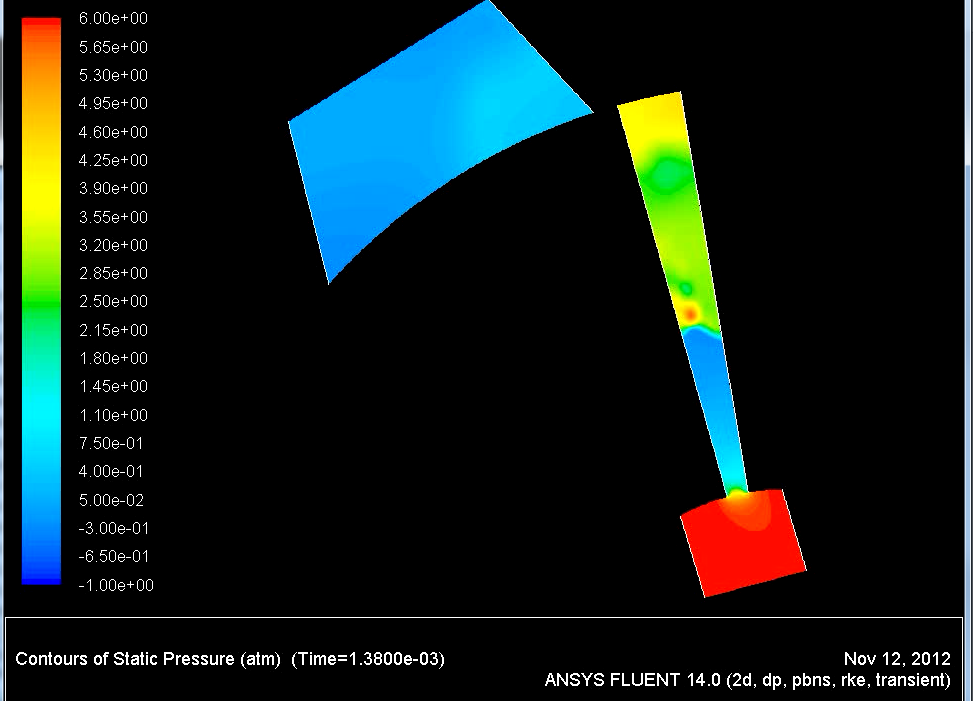
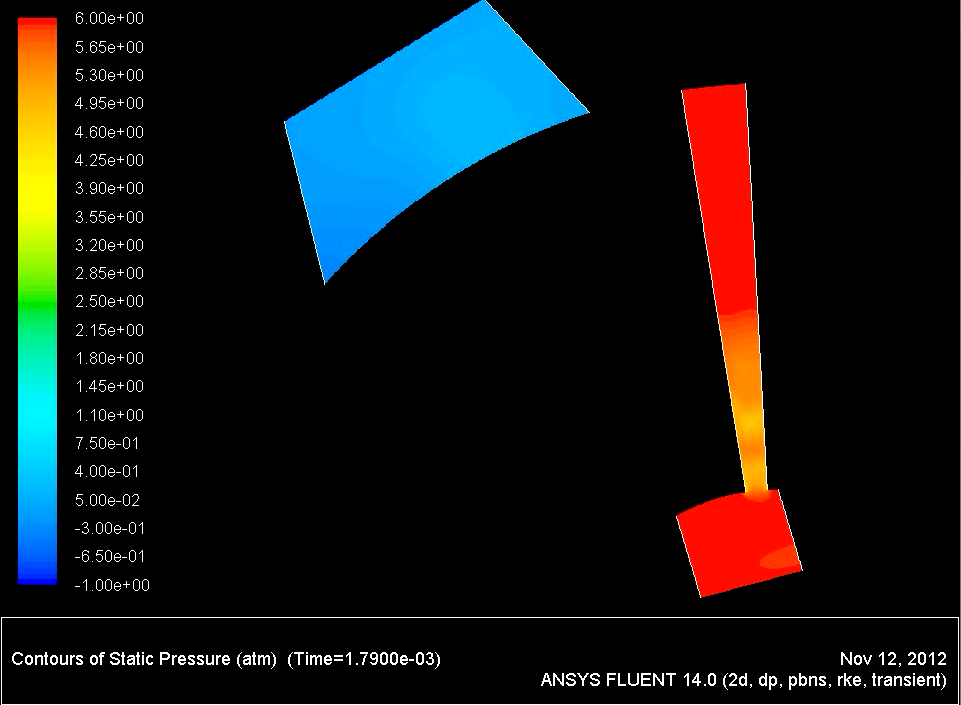
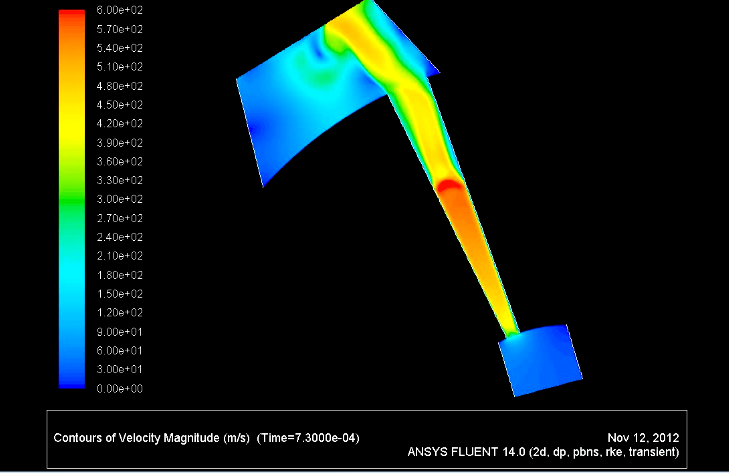
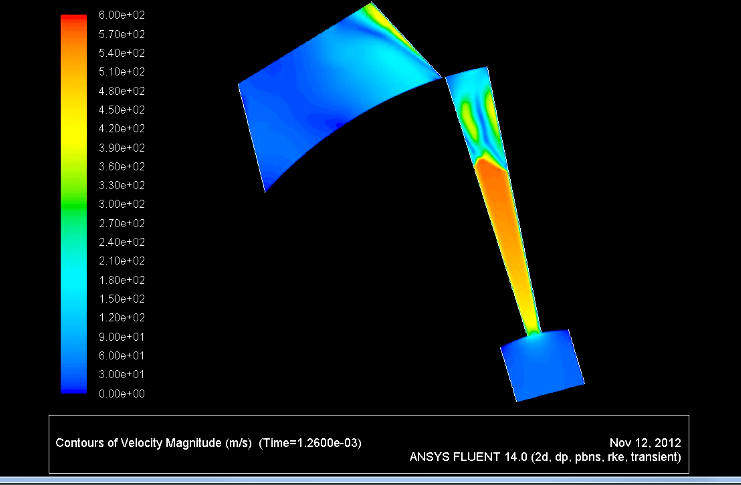
The idealized 2-D CFD analysis shows that at our given inlet pressure and rotation should be sufficient to obtain a hammer shock wave when the chamber is subjected to a sudden closing of the outlet port due to the rotary motion. The CFD design was integral in conjunction with our numerical analysis to move forward with the CAD design. We did not proceed to manufacturing until we were in good agreement. Currently we have done our 6th test with actual values of inlet ranging from 1-6 gauge ATM. From the 4th CFD analysis we have concluded that in order to experience shock waves we need four times our original RPM, and an inlet and outlet opening of greater than ninety degrees and relative angle of less than eighteen. These factors have help shape the current modular design. In order to avoid the situation of the design not reflecting the analysis, we have stressed the creation of the modular design; therefore, things likes the inlet and outlet geometries and relative angles can be fine tuned to more accurately reflect theoretical solutions in the physical world.


Some of our older and more preliminary CFD tests used higher pressures for the inlet. In order to try and capture the shocks we went back to our original plan to use higher inlet pressures. This was an acceptable solution since in jet engines the combustor receives high inlet pressures from the compressors. The figures below are gauge pressures.
Finite Element Analysis

The analysis performed on the design allowed us to determine whether or not the material chosen and the design itself would suffice in providing a fully functional device. An FEA analysis was performed on each of the components to make sure it could support the necessary loads it would be experiencing, 6atm-24atm (90psi) of pressure. It could not deflect significantly at any point in the design because it could destroy the entire device. It also needed to satisfy a certain failure criterion for pressure vessels, safety factor of 4-6, to ensure the safety of the team as well as innocent bystanders. No fatigue or buckling were taken into account due to the fact that the device would only run for maximum a minute for only 20-30 runs and it would not be undergoing compression that would lead to buckling. The final results are listed in the report. It shows the safety factor of each part, the maximum displacement, and maximum stresses. The images in the appendix of the report give a visual depiction of each of those numbers for each part. They were all done under an inertia relief with a 6 atm pressure [to a maximum of out tank at 24atm] acting on the surface(s) exposed to the air. Other analyses with constraints were done as well, but the change in stresses, safety factors, and displacements were negligible.


The outer housing, which consists of the walls, top plate, and bottom ring all have safety factors between 4 and 6 as desired. Disc 1 is also within this range satisfying our design requirements. The inlet has a safety factor of 2.12, but that is because it is made of aluminum 6061 instead of steel. There is a steel version of the inlet that may go into effect. The reason for making the inlet out of aluminum was to reduce the weight acting on the screws that will support it as it hovers slightly above the rotating disc. Machining such an intricate shape would also prove challenging if the material was made of steel instead. Although the safety factor was lower, there were no signs of displacement, which shows that this inlet can be used for our design. The second disc also lagged behind in safety factor. Therefore we redesigned this disc with thicker walls. None of the parts showed serious displacements that could harm the design. The parts that need special attention are the discs and the inlet. If any of these components were to fail, the inside of the housing as well as the failed part would most likely be destroyed.
Controls
The hardware of the control system for the motor is made out of 8 major components. These components are the power supply (batteries), 10 Amp fuse, 12 volt contactor, Sevcon Millpak 4QPM controller, Briggs & Stratton Etek motor, key switch, forward switch, and accelerator. Figure BLAH depicts the setup of the control system:
The battery is the power supply of the entire system. For our design 4-6 batteries that are 12 volts 35 Ah each will be used to power the system, providing a total of 48-72 volts. Power is transmitted to the contactor and the 10 amp fuse from the positive battery pole. The contactor draws power from the battery and transmits it to the positive terminal of the controller. The contactor acts like a switch for the high voltage and high amp draw for the motor. If the current and voltage is too high, the controller tells the contactor to open the circuit. The ten amp fuse is in place to the controller just in case the controller draws too much current to prevent damage to the controller. The fuse is connected to the key switch, which acts as the ignition key of the system. The key closes and opens the circuit manually as opposed to the contactor, which is under the directive of the controller. The key switch connects to the contactor, which then transmits smaller amount of voltage and amps to terminal 8 of the controller. The negative pole of the battery is connected to the negative pole of the controller for obvious reasons. The Forward switch is connected to terminals 2 and 3, which enables it the function to go forward and reverse. It controls the direction of the motor spin. For our applications, we only need the forward function. The accelerator is a 5K Ohm potentiometer or pot box, which allows us to change the speeds of the rotation of the motor. The wiper and positive poles of the potentiometer are soldered together to one wire, which enters terminal 11. The third pole is attached to the negative terminal of the controller. Lastly, the motor poles are connected to the motor poles on the controller. The wire used for the switches, potentiometer, 10 amp fuse were 18 gauge wire. The wire used for the motor batteries and contactor were 2/0 Welding wire to be able to handle the high current demand of the motor due to the weight of the steel Disk. And this sums up the hardware of the control system.
The motor was controlled using the Sevcon Millpak 4QPM Controller. The controller is able to power motors in the range of 24-48 volts. The controller was selected due to budget constraints as well as high end safety features. The settings and safety features we implemented include voltage max/min settings, current max/min settings, chopping for contactors, temperature sensors, maximum speed settings, acceleration settings, and proper startup safety settings. The voltage settings allow us to control the maximum voltage allowed to enter the controller without damaging, as well as the minimum voltage to allow it to power the motor. If the voltage goes above the range to a maximum voltage of 58 volts, the controller will automatically cut the contactor connection. This prevents the controller and all other components in the system from being damaged. The same is true for the maximum current of 330 Amps being drawn. The chopping of the contactor function allows for lower voltage contactors, such as the 12 volt contactor for this design, to handle higher voltages, 48 volts and up. As the name implies, the voltage is chopped, so for 1 second it runs at 48 volts and then down to 12 volts for the next second. This allows for the contactor to supply the correct amount of current without damaging the contactor. The temperature sensors within the controller will automatically shut off the controller if the temperatures reach inoperable temperatures that may damage the MOSFETS within the controller. The maximum speed settings allow for the user to choose the maximum speed the pot box will allow the motor to reach. In our case, that is approximately 3700 rpm for 48 volts. The acceleration settings allow us to use any potentiometer by measuring the zero voltage and ma voltage of the potentiometer and setting these within the controller. This setting also allows us to set the delay time and step size, allowing us to control how quickly the accelerator affects the motor rpm and how large an affect even the slightest turn of the knob will have on the motor. The final setting selected was proper startup procedure. This forces the controller to follow a certain startup to enable the motor to work. In our case, the key must be turned on with the forward switch and the accelerator off. If either are on, the controller will give off 2 flashes to indicate a false start. The key switch will have to be turned off before trying again. The controller will not permit you to turn off the forward switch or accelerator off after the key switch has been activated. This allows us to prevent any accidental start with the accelerator or forward switch on. This is how the software of the controller operates along with its safety features.

Data Acquisition
To verify the computational fluid models described earlier, pressure transducers were mounted on the top plate of the disk and empirical measurements were recorded of the dynamic pressure changes within the chambers of the disk. Two model XLT-190 pressure transducers were donated by Kulite to obtain the pressure measurements. The pressure transducers are differential pressure transducers, measuring the relative pressure between the ambient pressure and the pressure within a chamber, with a maximum pressure range of 100 PSI. The natural frequency of the pressure transducers is 380 kHz, with a resolution rated as infinitesimal by the specification sheet. The electrical diagram of the pressure transducers are fully-active Wheatstone bridges, with a 10V DC excitation and a full scale output of 100mV. To record these measurements, the pressure transducers were connected to a National Instrument’s PCI 6024E DAQ card.
Risk Mitigation
To further account for risks beyond leakages, we will attempt to situate the set up in a blast proof room, to protect the passersby of any mishap involving exploding shrapnel in the case of emergency or critical failure. To prevent this hypothetical situation from happening, we design with a safety factor of 4 or greater for each piece and will have our control and wire schematic double checked before running tests behind protective sand bags. Obtaining the pressure transducers from Kulite and the motor from the department along with using the laboratory DAQ card allowed this project to remain within budget constraints.
Results
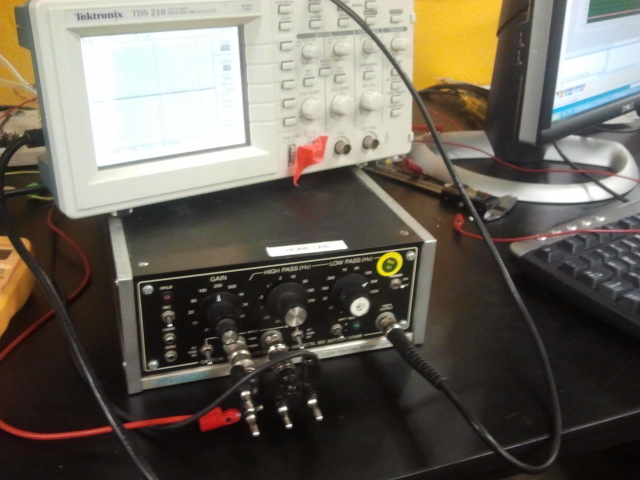
Currently we have a large amount of data to process; we went through preliminary data acquisition and found a large amount of noise inherent in the system. Some of the noise was limited by grounding the transducers, and covering the transducers in a makeshift magnetic barrier. With the help of Adam Hurst, we were able to augment the signal changes with an amplifier, while filtering the data. The data we have on hand acts as a first step towards converging reality of our design with our analytical solutions.
While the first 6 tests have much higher issues with noise, our later tests were much better. The initial tests showed rapid movement. Note- these are voltages not pressures.

Figure 55: Motor On, No Compressed Air

Figure 56: Motor On, Compressed Air
The following picture is with Air and no motor, Disc rotating due to air. You will notice much less noise; this is why we believe our motor has a large hand in skewing our data due to its large Magnetic field. Our motor comprised of a large contactor, Sevcon Millpak 4QPM Controller, and the powerful Etek 15hp motor, is known for its magnetic field.

Figure 57: Motor Off, Compressed Air
The data obtained using LabVIEW was imported to MATLAB r2012a for data manipulation and analysis. The pressure measurements from Test 8 of Pressure Transducer 1 were plotted against time in Figures 58-60, and the Discrete Fourier Transform of the measurements using MATLAB’s Fast Fourier Transform function were plotted in Figures 61-63 in a semi-log plot for the purposes of spectral analyses of the data. From MATLAB’s help section, The MATLAB fft function returns the DFT (y )of an input vector x using a fast Fourier transform algorithm. Seconds 4-6 show the motor rotating the disk without any compressed air injected into the disk, and during seconds 6-8 the compressed air is turned on, and seconds 8-10 show the pressure measurements after the system has reached a steady baseline static pressure. The following charts display the results of these measurements:

Figure 58: Test 8 Motor On, No Compressed Air

Figure 59: Test 8 Motor On, Compressed Air on at Approximately 7.5 Sec

Figure 60: Test 8 Motor On, Compressed Air on, Zoomed in to 5 Cycles

Figure 61: Test 8 DFT Motor On, No Compressed Air Sec 4-6

Figure 62: Test 8 Sec 6-8 DFT Motor On, Compressed Air on at Approximately 7.5 Sec
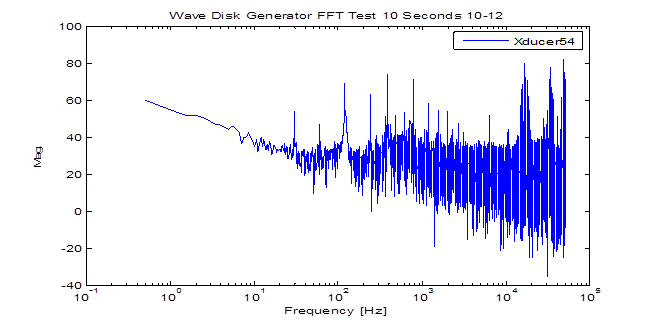
Figure 63: Test 8 DFT Motor On, Compressed Air On Sec 8-10
As shown in Figure 59, there was a noticeable increase in static pressure upon introducing the compressed air to the system. Figure 60 shows a periodic increase in pressure in the system. The group believes there are three overlaying prominent frequencies, that of the motors magnetic field, the frequency of the chambers passing by the pressure transducers, and that of the pressure fluctuations within the chamber: which may include shockwave propagation. The DFT of seconds 4-6 showed a significant amount of noise within the system, but in seconds 6-8 the noise at lower frequencies began to diminish, and seconds 8-10 showed multiple frequencies that began to dominate the system. The frequency that the chambers passed under the transducer was approximately 60 Hz, and the frequency of the pressure fluctuation was calculated at around 600 Hz within the chamber, and the noise of the magnetic field of the motor lies at higher frequencies.
To address the noise recorded by the magnetic field of the motor, the group’s last test before the compressed air tank ran out was a motor spin down test. For Test 10, the motor speed was increased to a high rpm, approximately 30 percent of the motor capacity, and the motor was turned off with the compressed air being injected into the system so measurements could be taken of a rotating motor without the disturbance of the magnetic field.
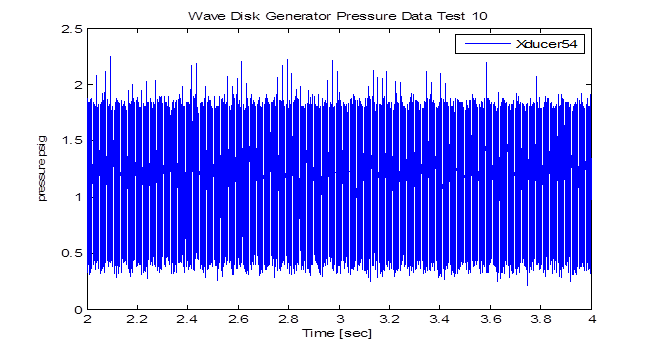
Figure 64: Test 10: Motor Running, No Compressed Air
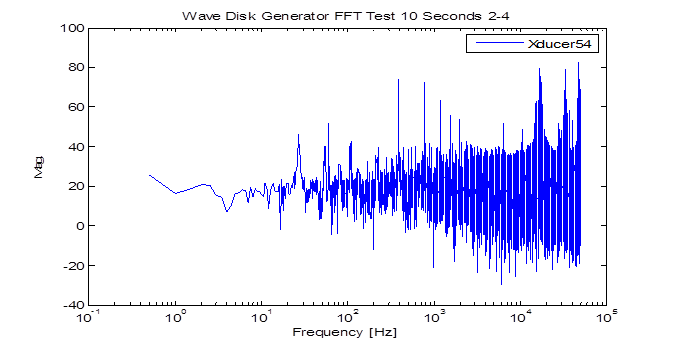
Figure 65: Test 10 DFT Motor Running, No Compressed Air Sec 2-4
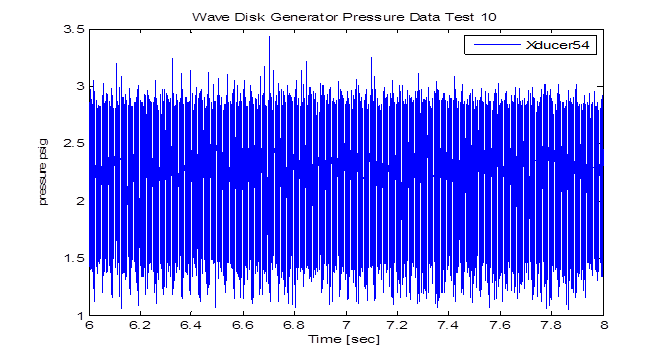
Figure 66: Test 10 Motor Running, Compressed Air
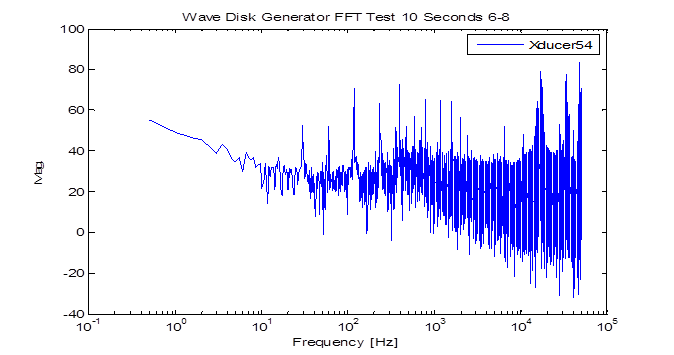
Figure 67: FFT Motor Running, Compressed Air Sec 6-8
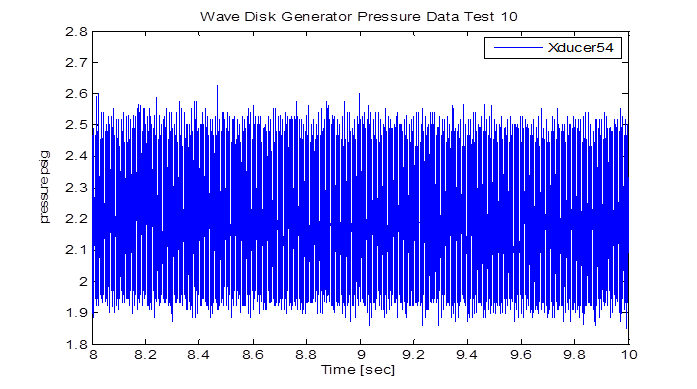
Figure 68: Test 10 Motor Off, Compressed Air
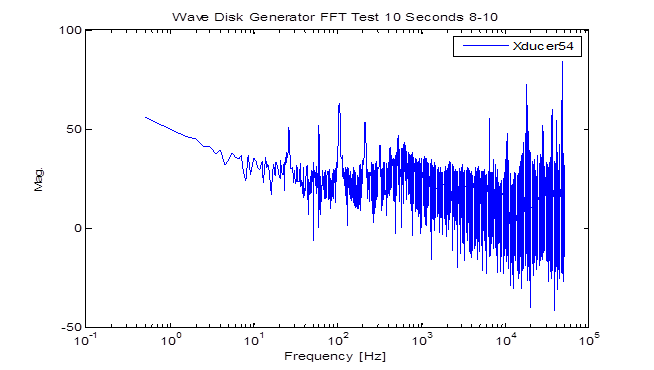
Figure 69: Test 10 FFT Motor Off, Compressed Air Sec 8-10
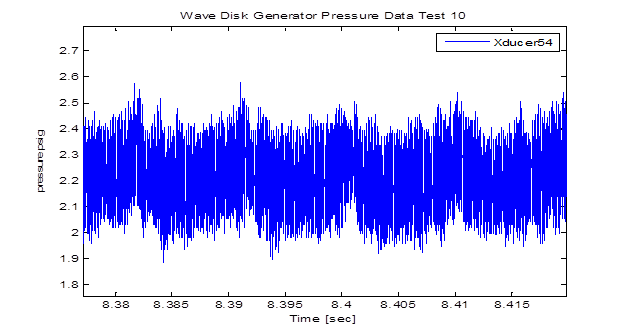
Figure 70: Test 10 Motor Off, Compressed Air, Zoomed to 5 Cycles
These results show that there was a pressure rise upon introducing high pressure air within the rotating system at the close of the exit port. After the motor was turned off, the noise recorded by the pressure transducers was significantly reduced. The noise caused by the motor was at approximately a 1000 Hz frequency, which was deduced by the reduction in spikes at or around 1000 Hz after the motor was turned off. Analyzing the pressure measurements recorded after the motor was turned off, the linear rise in pressure happens at a slower rate than the actual pressure rise within the chamber: due to convolution in the pressure measurements caused by the geometry of the pressure transducers. With further analysis, cross-correlation analysis can further identify the existence of these three overlaying frequencies and allow for auto-correlation data enhancement to remove the convolution from the pressure transducers and noise from the motor’s magnetic field.
Although the magnitude of the pressure measurements were significantly less than those predicted by the CFD analyses, the periodic nature of the pressure rise within a chamber was similar to that predicted by the analyses. The increase in pressure was not as sharp as anticipated due to the convolution of the pressure transducer’s geometry; witnessing periodic pressure increases above the baseline static pressure showed that tier 3 of our goals was accomplished and part of tier 4 was attained. The discrepancy in magnitude between the theoretical and empirical pressure measurements can be attributed to leakages within the system as well as 3-D phenomena, which were not accounted for in the CFD analyses. Moving forward, creating a 3-D simulation of a chamber could enhance the accuracy of the models.
Conclusion
While reflecting on our work, some things to take into account for future testing is a inlet and exit fluid throttling capabilities. We found that the mass flow into our device was choked due to the regulator we were using. We believe that the theoretical part of the design would do well to take into account 3-d phenomena and losses in the CFD. For the tangible part of the manufacturing, the next steps would be to make the steel walls with a smaller tolerance and using a stronger sealant like sikaflex. We hope that by using aerodynamics research on NACA air foils, we could make curved channels to impart more momentum to the fluid utilizing the forward leaning rotary setup. Lastly on the data acquisition and analysis side of the design, we feel that proper shielding from the motor will be necessary to limit the noise coming from the magnetic field. A proper DAQ card could be helpful in getting better data resolution as well as taking data measurements at different filtering schema to see which provides the clearest details.
On our path to success, our group was to be able to create computational models using computer aided design and computational fluid dynamics to provide specifications for the wave disk engine. Once these analyses were complete, in addition to material strength comparisons and procurement, a proof of design prototype was machined to show that such an device can rotate while enduring the loading of inlet and purging. This design took into account all the analytical results we garnered. The group took measurements of relevant thermodynamic properties at specific points and compared the experimental results to the analytical and computational results from the analyses performed. This proof of concept design was made to be modular. Beyond our second tier of success, we explored the effects of an increasing impeller angle and methods of attaching the inlet mass flow as well as the geometry and location relative to the inlet of the outer housing.
We integrated an accurate control system and data acquisition set up to monitor the flow and fluctuations of pressure. What were necessary, outside of a robust control system, were accurate sensors, transducers provided by Kulite, and a modular method of changing inlet and exit conditions. Taking into account a proper inlet supply, an appropriate control system, and data acquisition methodology, we were able to see pressure fluctuations thus proving the concept of pre-compression of fluid in the chamber. This concept allows for further research in the development of the device to allow for high efficiency combustion.
After several months of consistent work, we were able to accomplish third tier with great assurance. From our data we believe we may have accessed our fourth as well. We are very proud of the outcome and the fact that we were able to succeed even in the face of adversity; we hope that future groups will take on our project and push it further at Columbia University.