Full Page Version | Step-by-Step
version
Topic 4
Introduction to Earth Sciences I
Topic 4
Earthquakes, Seismic Waves, and the Earth's
Interior
Objectives:
Earthquakes are one of the most profound expressions of
the Earth's dynamics. They provide the most direct evidence that the rigid
outer shell of the Earth is in motion. They are also the cause of huge tragedy
as seen in earthquake losses in the last two years (see Case Studies below).
The objective of this part of the course is to provide some basic information
on earthquakes as physical phenomena, what makes them happen and why they
happen where they do, and how the propagation of seismic energy generated
by earthquakes propagates through the Earth and can be used to infer information
about the interior properties of the planet. So I hope you will come away
from this course having a basic understanding of -
1. What an earthquake is, why they occur, and why they
occur where they do.
2. How the seismic waves generated by earthquakes are used
to image the Earth's interior and some things we have learned from these
images.
Your text is reasonably good on the basics of this subject (Chapters
14 and 15) but neither of the book's author's are seismologists and you can
find better treatments of most of the material at Web sites created by researchers
at earthquake research centers. The four that I think will be most useful are:
http://vearthquake.calstatela.edu/ which is from Cal State LA and goes through a number of simple exercises
in finding earthquake locations etc that we will do in class or in the lab.
http://scecdc.scec.org/eqcountry.html
and http://www.scecdc.scec.org/Module/TableofC.html
from the Southern California Earthquake Center, a consortium of universities
in Southern California (but including Columbia) who combine to do research on
earthquakes and their associated hazards. I have had the most difficulty getting
to this site. We will use quite a lot of materials from this site.
We will discuss two new discoveries about the deep earth that
seismic analysis has revealed. One is the "super-rotation" of the
inner core. A description of that can be found at
http://www.ldeo.columbia.edu/press_releases/song/pr.html which includes
an animation. The scientific paper is published in the journal Nature
and would be too technical for our purposes.
We will also study the nature of the so-called D'' Layer
which is at the boundary between the outer core and the lower mantle. It
exhibits a surprising degree of heterogeneity and structure suggesting that
the core/mantle boundary is a very dynamic interface. This was published
in Scientific American in May 1993 by Jeanloz and Lay. It's a very accessible
article that you should be able to read without much difficulty.
4.1 Some Essentials
4.1.1 Earthquakes Occur On Faults
Three pages at SCEC
provide some good definitions.
Earthquakes occur when the Earth breaks. The breakage is called
a fault. They are the instantaneous failure of a place on the Earth that is
under stress caused by the far field action of the major lithospheric plates
that are in constant motion driven by the Earth's heat engine (see Topic 2).
This is an important point that the popular press often gets wrong -- earthquakes
result from the instantaneous localized release of stresses that are
broadly distributed and essentially uniform. They do not result from
an instantaneous increase in stresses. In this way they are analogous to the
landslide on Bak's sand pile in that the avalanches occur as instantaneous isolated
events driven by the steady drip of sand from the sand faucet.
Earthquakes usually occur on faults that were
known to exist before the earthquake happened, and have had a prior history
of earthquake activity. Many earthquakes occur on the San Andreas Fault, for
instance. In a simple way this is a type of prediction. We don't really expect
earthquakes to occur in places where there are no faults. Put another way, earthquakes
usually occur in places where they have occurred before -- on "active"
faults. This is where the sandpile analogy breaks down. To be accurate the sandpile
would have to be pre-figured with the scars of previous landslides leading to
a tendency for new landslides to occur at the locations of old landslides. The
Earth has a memory of where it broke before.
Activity: From SCEDC Section
#2 Activity #1 using Seismicity
for 1932-1996 chart
Although in detail faults really come in all
configurations and accommodate stress relief in many different ways, there is
a basic classification of faults into three types -- normal faults, reverse
faults and strike-slip faults. Your book has some reasonable diagrams that show
the motions associated with each type of fault.
Normal faults relieve tensional
stresses and result in two parts of the crust moving apart.
Reverse (or thrust) faults relieve
compressional stresses and result in two parts of the Earth moving together.
They look much like a normal fault on which the motion has been reversed. Hence
the name. SCEDC Section 1, Page
14 and Page
15
Strike-slip faults relieve lateral
stresses and result in two parts of the crust sliding along by one another.
Strike-slip faults can be right lateral or left lateral.. The difference is
easy to recognize -- imagine yourself standing on one side of the fault, the
other side moves to the right, the fault is right lateral, left lateral
if it moves left. The best known fault in the United States, the San Andreas
Fault, is a strike-slip fault. SCEDC Section 1, Page
16
It is rare for one type of fault to exist alone. Strike-slip
faults often have compressional stresses associated with the crust on either
side of the fault, especially if it isn't perfectly straight (and they never
are) so normal and reverse faults are commonly found as secondary features associated
with the main strike-slip structure. SCEDC Section 1,
Activity 13 and map
showing sense of slip density
4.1.2 Faults don't slip all at once
The animations of fault motion shown
above are intentional simplifications designed to show the basics of how the
different types of fault motions take place. In the real Earth faults do not
move all in one simple motion. Typically one segment of fault moves leaving
the remainder without any motion. The San Andreas is a huge fault several thousand
kilometers in length. When an earthquake occurs on that fault only a very small
portion of that fault actually moves.
Generally slip on a fault nucleates at
one place and ruptures a segment of the fault surface. The fault block model
shows this idea. The earthquake is said to occur at the nucleation point and
the area affected by fault motion is called the rupture zone. Large earthquakes
have very large rupture zones, perhaps several square kilometers, small ones
may effect only a few square meters of the fault. The hypercenter of an earthquake
is the place where the earthquake nucleates and the epicenter is the location
on the earthís surface directly above the hypercenter.
SCEDC Section 1,
Page 6 (Epicenter/Hypercenter diagram)
Slip on a fault is typically progressive. The fault ruptures
in one place and the area slipping moves along the fault from one place to another.
The two examples below illustrate this. They show the evolution of slip on
two recent earthquakes in southern California, the Northridge and Landers events.
Particularly in the Landers case we see the slip progressively move from south
to north along the fault triggering activity on three separate fault segments.
SCEDC Section 1,
Activity 3 (Rupture Model Animations including Landers rupture
and energy models and Northridge rupture model)
We are starting to learn some surprising things about the
evolution of fault slip. It now seems that motion on one fault can trigger
activity on other faults that are quite some distance away and that new seismic
activity may occur quite some time in the future.
What happens is, in principal quite easy to understand. A
place like southern California is a complex deformation zone with many different
faults of different type and in different states. Some have recently had
earthquakes and some have not had earthquakes for many years. Because an earthquake
represents a release of stress in the earth this complex array of faults are
in different states of stress, some ready to rupture. When an earthquake
releases stress on one fault or segment the earth motion may transfer the stress
to another fault region. The release of stress in one place may increase
stress in another place. This newly stressed region may then become prone to
new earthquake activity.
4.1.3 Damage Can Occur At Considerable Distance From An Earthquake.
The great San Francisco earthquake of 1907 did not occur
on a fault that ran directly through San Francisco. The largest ground motions
associated with earthquakes occur on the faults themselves but a great deal
of damage is often reported a considerable from the trace of the fault.
Sometimes the fault itself can be quite difficult to locate and not an especially
dramatic feature.
This distant damage results because the energy that is
released at the fault by the earthquake cannot stay localized to the region
of the fault itself. The energy propagates away in seismic waves which travel
through the Earth and disturb the crust as they pass. These waves are something
like the waves one sees in a body of water if a stone is dropped in. The
ripples move away from the site of the dropped stone in circles and as they
do they reduce in size. At some great distance one would never know that
the stone had been dropped into the water. The same is true of earthquakes
in that as distance increases from the earthquake the disturbance reduces
in size. A large earthquake will cause disturbances at distance from the
quake that are capable of significant damage, just as a large object thrown
into water will cause large waves that travel considerable distances.
The motion associated with an earthquake is very complex and
the waves that travel away from the earthquake are similarly much more complex
than a simple ripple in a pond. Several different types of waves are generated
simultaneously and are associated with different types of ground motion. For
instance, to effect a city located north of an earthquake the seismic waves
obviously must travel north to reach the city. But when they arrive the motion
of the ground will be in both a north-south direction (the
direction the waves traveled) and east-west, exactly orthogonal to the direction
of travel. And the two types of disturbance don't arrive at the same time. Those
making motion in the direction of travel of the wave arrive ahead of those making
motion in the orthogonal direction. The first type are called Primary or P-waves,
the second are called Secondary or Shear waves designated S-waves. Both
are elastic waves and both can travel from one side of the Earth to another
from sufficiently large earthquakes. Even small earthquakes send waves to great
distance and can be detected by sensitive instruments called seismometers that
can pick up very tiny ground motions much too small to be detected by people.
These two types of seismic waves will prove to be very useful when we come to
use seismic energy to learn about the interior of the Earth.
SCEDC Section 3,
Page 9 (Seismic Waves Identified)
SCEDC Section 3,
Activity 2 (Measuring Earthquakes -- Seismic Waves)
SCEDC Section 3,
Page 10 (P.S. I Rayleigh Love U)
SCEDC Section 3,
Page 11 (P is for Primary Waves)
SCEDC Section 3,
Page 12 (Secondary Shear Waves)
4.1.4 Earthquakes Have A Distinct Global Distribution
Even a cursory look at a map of the world showing the locations
of earthquakes makes it clear that they are anything but uniformly distributed.
They occur in distinct bands. In fact, most of the Earth is relatively free
of earthquakes. A map showing the locations of the deepest earthquakes we see
that their locations are even more restricted. Deep earthquakes are essentially
absent in the US, for instance, but common along the west coast of South America.
If instead of looking at a plan view, we were to make a section through the
Earth at one of the locations where deep earthquakes occur we see that they
form a very distinct band penetrating deep into the Earth.
Go to Pre-Assembled
Event Information page.
These zones of intense earthquake activity mark the major
lithospheric plate boundaries -- those places where the plates are being
created, destroyed and are sliding past one another. The latter two types
of boundary create the most intense activity. The most destructive earthquakes
to have taken place on Earth occurred at subducting plate boundaries where
the lithosphere is being thrust deep down into the mantle. Where one plate
is diving beneath the other tremendous forces are at play. One plate literally
rubs against the other, sometimes sticking and building stresses released
in earthquakes, sometimes sliding. In a subduction zone dipping at a relatively
shallow angle a large area of the two plates is in contact and when such
a large area slips instantaneously there is the potential for a very large
earthquake. The larger the rupture area the larger the earthquake will be.
So if a very large section of a strike-slip fault gives way, a very large
earthquake is also possible.
The type of faulting associated with the three different
plate boundaries is consistent with the overall motion of the plates --
normal faulting dominates at divergent boundaries where plates are being
created, reverse faulting at subduction systems and strike-slip faulting
at transform boundaries. It is possible to analyze the seismic waves from
an earthquake recorded at a number of locations around the world to determine
the location, depth, magnitude and focal mechanism (the type of motion that
gave rise to the earthquake). http://vearthquake.calstatela.edu/
is a good source for how to do earthquake location and magnitude determination.
That is, we do not need to be on top of an earthquake to know where it occurred
and why. Today, there is a world wide network of identical seismometers
operated to monitor earthquakes and quickly determine their size and location.
An earthquake larger than about magnitude 4 anywhere in the world will be
detected by this network and quickly located. Smaller earthquakes are recorded
on local parts of the network. The accuracy of earthquake location depends
on the number of seismometers that recorded the event and how well they
are distributed with respect to the quake. Generally, the more seismometers
that record the event the better it will be located but the best locations
are obtained if the seismometers actually surround the earthquake.
4.1.5 Locating Earthquakes and determining their magnitude.
The Web site http://vcourseware5.calstatela.edu/VirtualEarthquake/VQuakeExecute.html
provides easy to follow exercises on how to locate earthquakes and determine their
magnitude. You can follow the instructions to do your own location and magnitude
determination. It uses real seismograms from actual seismograph recording stations.
The basic principal of location is fairly simple. We know that earthquakes generate
both p-waves and s-waves and that the p-wave energy travels faster than the s-waves.
Like two cars starting from the same place with one going faster than the other, the
faster car will reach its destination sooner, and the longer the cars are driving the
further ahead the fast car will be. With the cars both heading for the same very
distant destination, the amount of time the slower car is behind the faster will increase
as the destination distance increases. For seismic energy the s-to-p separation time
is a measure of how far away the earthquake must be - the greater the separation the
greater the distance to the source. Of course, a single recording cannot tell us the
direction the energy came from and, as the Web exercise demonstrates, a minimum of
three recordings is needed to determine the location. In fact, accurate locations
require about 10 independent recordings and there is always some uncertainty associated
with the location because, as you will see in the exercise, the s-to-p separation time
cannot generally be determined with complete precision.
Determining the magnitude is a little more difficult. Any recording of an earthquake
at some distance from the source will produce a wiggle on the seismograph. But for
a given wiggle, how can we know that it resulted from a small earthquake nearby, or
a large earthquake at a large distance? The estimate of magnitude has to include
some knowledge of both the distance and the amplitude of the wiggle. That's the
key. The Web site shows how it's done.
Given that earthquakes generate a lot of different types of energy (p-waves, s-waves,
surface waves) its not surprising that seismologists have come up with several
different magnitude measures. The well known Richter scale measures the s-wave
amplitude.
4.1.6 It Is Not Hard To Tell An Earthquake From A Nuclear
Explosion
The worldwide network of seismometers was set up in large part
in response to the need to establish a mechanism to verify compliance with the
Comprehensive Nuclear Test Ban Treaty. But how can we distinguish a nuclear explosion
from an earthquake? In fact it is not terribly difficult.
Figure 4.1.1
Think about the mechanism of any earthquake. Regardless
of whether it is generated by normal, reverse or strike-slip faulting what
is always taking place is the sliding of one part of the crust against another.
This produces very distinct seismic energy radiation patterns. Imagine yourself
standing in front of a normal fault. The ground motion you felt (as would
a seismometer at that location) would be down and toward you as the crustal
block slides down the inclined fault. On the other side of the fault the
opposite motion would occur and to the side some shearing motion would take
place. So the motion you feel depends on where you are with respect to the
fault and the seismic energy radiated from the fault is similarly different
in different directions away from the fault. It is this information that
allows us to determine what sort of fault caused an earthquake.
Now think about an explosion. Unless the explosive agent
is distributed in a line or other pattern we would expect a fairly uniform
distribution of energy in all directions from the explosion. There is no
reason why any direction away from the explosion would receive more energy
than any other. No fault-generated earthquake can produce that sort of radiation
pattern. Also. because there is no real sliding motion associated with an
explosion very little shearing occurs and hence very little S-wave energy
is present. The ratio of S-wave to P-wave energy from an explosion is therefore
unusually low and quite unlike a fault-generated earthquake.

Figure 4.1.2
Figure 4.1.2 illustrates the differences in how seismic signals
are generated for both earthquakes and explosions. The P-waves associated with an earthquake
are a four-lobed pattern of compressions and rarefactions due to the shearing motion across a fault,
while those associated with an explosion radiate out uniformly in all directions
due to the relatively uniform pressure applied to the walls of the cavity
created by the explosion.
Another way to determine whether seismic signals are due to an earthquake
or a nuclear explosion is to look at the ratio of surface wave magnitudes, Ms,
to body-wave magnitudes, mb. Body waves are seismic waves that travel through Earth's sphere, while surface waves travel around Earth's
surface. Underground nuclear explosions produce seismic signals that have different
surface to body wave ratios than those produced by earthquakes. Figure 4.1.3 below
is a Ms: mb diagram. The diagram separates
earthquakes and explosions into two distinct populations which makes identification
reliable.
Figure 4.1.3
4.2 An Earthquake Or A Clandestine Nuclear Test
On August, 16 1997, there was a small seismic event in the Kara
Sea, near a nuclear test site on the far northern island of Novaya Zemlya,
used by Russia for nuclear weapons research. Within days, scientists determined
that the event was in fact an earthquake, having occurred 130 km from the test
site and beneath the bottom of the Arctic Ocean. However, US agencies took longer
in reaching that conclusion, claiming that the event was an underground nuclear
explosion. It took the CIA 10 weeks to finally concede that the event was not
a nuclear explosion, as it had previously insisted. More about this:
Nature Article
4.3 Earthquakes Disasters and Prediction: Three Case Studies
Living in New York there seems to be little need to worry
about earthquakes. We hear about earthquakes but they always occur somewhere
else, either in a distant part of the world, or on the opposite of the US.
Few people living in Manhattan would rate earthquake risk very highly among
the hazards to life of living in the city. One is much more likely to be
run down by a taxi than to be injured in an earthquake. So why worry?
For the most part there is probably little need for Manhattanites
to be too concerned about earthquake hazard. Earthquake have occurred in
the northeast and some have been very destructive. Destructive earthquakes
are sure to occur again in the area and when they do the potential for property
damage is very real and the possibility of loss of life is also real. It
is extremely unlikely, however, that loss of life in a Manhattan earthquake
will rival that which occurred in two very recent earthquakes that we will
use in this class as examples of how different types of earthquakes in different
setting can cause loss of property and life. The first is the earthquake
and tsunami that took over 2000 lives in a small village on the north coast
of New Guinea in July 1998. The second occurred in August 1999 in a densely
populated part of Turkey and took more than 12,000 lives, and the count
is still increasing. The causes of these earthquakes are very different.
4.3.1 Sissano Lagoon, July 17, 1998
The USGS Web site provides an excellent description of this earthquake event.
The lives that were lost in this earthquake were not caused by the earthquake
itself, but by a submarine landslide that the earthquake caused. This is a very
dramatic example of a very common phenomenon - earthquakes don't usually kill
people. It is extremely rare that people are swallowed up in gaping chasms caused
by earthquakes (Superman movies notwithstanding) or crushed by the movement of
the Earth itself. Usually people die in the ruins of buildings that collapse on
them or by being struck by falling objects. There is an old adage that says ....
earthquakes don't kill people; buildings do. In Sissano Lagoon the earthquake
of July 17 didn't harm anyone. It was felt by many people, but no damage was done
and no-one was injured. What killed more than 2000 people was a tsunami (Tidal
wave) that resulted from the earthquake.
Off Sissano Lagoon the sea floor slopes very steeply and rapidly
attains depths of 4000 meters (http://walrus.wr.usgs.gov/tsunami/itst.html).
Sediments that collect on the steep slope are unstable and can slide down the slope in a
phenomenon that is the submarine equivalent of a landslide or avalanche (a term
restricted to the description of snow slides). Witnesses have described how air
is pushed in from landslides creating strong winds. When a submarine slide,
called a slump, moves down-slope a large amount of water is displaced. Because
the surface of the ocean is free to deform the displaced water tends to cause
the sea surface to bulge upward and a wave of risen water moves out in all directions
from the area of the slump. Tsunami waves created in this manner can travel at
frightening speeds of as much as 400 miles per hour or more. The figure below
shows the progress across the Pacific Ocean of a hypothetical tsunami wave
origination off Hawaii along with the wave heights.
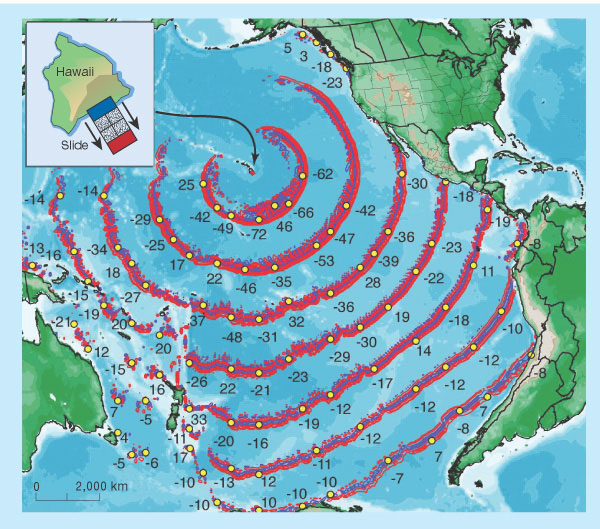
Figure 4.3.1
Traveling away from the coast tsunamis cause no discernible effect but traveling
toward the coast they are natural hazards of immense destructive force. These waves
break as they enter shallow water just as normal ocean waves do at a beach. When
they move to shallower regions and begin to break they become much larger, in the
sense that the water piles up into a mountainous steep wave. The only good news
is that on entering shallow water the waves actually slow down some, but generally
not enough for people to escape unless they knew it was coming a long time before it
made landfall. An excellent Web site describing many aspects of tsunami waves is at
the University of Washington site www.geophys.washington.edu/tsumani. The site includes
a description of the tsunami warning system that is used to detect these great waves
and alert populations that might be in harms way.
The villagers of Sissano Lagoon, gathered in the evening for their meal, would have
seen a wall of breaking water as much as 50 feet high coming directly at them so fast
that escape was impossible. Four villages were completely wiped out and others badly
damaged. While the loss of life of 2000 seems gruesome enough, the coastline here is
very sparsely populated. A similar event off Miami, Seattle or New York would kill
tens of thousands. Is this impossible? The answer is "no".
The offshore slope of the sea floor adjacent to many coastlines is often quite steep.
Sediments are thick and unstable. Almost all continental slopes exhibit some real
potential for unstable behavior.
4.3.2 Turkey, August 17, 1999
At perhaps the worst possible time of day, 03:02 a.m.,
on August 17th, a magnitude 7.4 earthquake struck
near the town of Izmit in Turkey. At that time of day almost everyone is
in bed asleep and unable to take any actions to evade the catastrophe. Loss
of life in earthquakes is strongly dependent on the time of day at which
the earthquake strikes. People die in houses and other buildings. The more
people who are out of their houses during an earthquake, or at least awake
enough to get out of their houses or find a safer place within, the lower
the death toll. The fact that structures, not the Earth, kill people was
bought home graphically and sadly in Izmit.
The New York Times ran headlines
on August 18th through the 21st on the quake together with an article in the Week in Review Section
on Sunday the 22nd, and an article in Science
Times on Tuesday, the 24th. Watching the changing
emphasis of these pieces it becomes increasingly apparent that the social
cost of this event was due to many factors under the control of humans.
In a 7.4 magnitude earthquake people will die and property loss will be
high. The state of our science and the understanding of earthquakes does
not presently allow any useful prediction skill - we don't know when an
earthquake will occur or how large it might be, but we do have a refined
knowledge of where earthquakes will occur. The Izmit earthquake took
place on the Anatolian Fault, a structure of known historic earthquake activity.
Seismologists knew that large earthquakes would occur in this region
- not when or how large exactly - but that they certainly would occur. Knowing
that, we can take some preventive actions. Primarily we can build earthquake
resistant houses and buildings. The second day of reporting in the Times,
the headline featured the key issue, "Recrimination and Rescue in Turkey;
Toll hits 4,000. Shoddy Housing Vulnerable". What is always apparent
in an earthquake is that the damage seems capricious. Some structures stand
almost unscathed, others completely collapse. Why ?
In general there are two reasons:
1) Poor construction - although people live in areas that
have experienced repeated earthquakes over centuries, and their description
appears in the historic records of those people, construction practices
for structures that house people put those individuals in danger. In general,
the knowledge of engineering practices that allow buildings to resist earthquake
shaking is quite new. So, many older structures in earthquake prone areas
are highly vulnerable to damage by shaking and loss of life occurs from
building collapse. Today it is possible to make most structures earthquake
resistant, even large sky scrapers such as the Petronas Towers in
Malaysia. Part of the secret is to allow the building to experience a controlled
yielding to the shaking motion. Buildings have internal members that absorb
the motion. Think about how a car would be shaken if there were no shock
absorbers at the wheels. In a car the shock absorbers take up a large amount
of the motion that would be transmitted to the car due to bumps in the road.
Building design now includes shock absorbing elements in their frame structure
which act the same way. Smaller, domestic structures can be improved in
many ways also. One simple measure is to ensure that the main frame of the
house is firmly attached to the foundation. There have been many instances
where houses have literally shaken off their foundations. In the Kobe earthquake
one of the series of issues was that many traditional Japanese style houses
have fairly sparse, light frame construction with heavy tiled roofs. This
works if the structure is static, but if shaken the roof often collapses
the light frame beneath, completely squashing the underlying structure.
In the final analysis, however, there are few structures
that can withstand a direct hit from a huge earthquake. The job of the earthquake
engineer is to design structures that minimize damage - not eliminate it.
In the Izmit earthquake it appears that human greed was the major cause
of loss of life. Although earthquake building codes existed many new buildings
were built in ways that did not conform to code using poor construction
materials. Corrupt local officials have been blamed, but the outcome of
inquiries is not yet known.
2) Poor underlying ground conditions - No matter how strongly
a building is constructed it will suffer major damage if it is not built
on solid ground. In many graphic news photos of earthquake damage we see
many in which a building appears to have toppled over almost intact. In
most instances this occurs because the ground beneath the structure has
failed. Most often the ground is not solid rock but a weak soil and the
foundations are set into this weak material. The shaking associated with
an earthquake causes the weak material to become even weaker - in fact,
it can lead to a liquification of the soil in places. Where the foundation
sits on the liquefied soil it will sink causing the building to topple over.
As an aside, the leaning tower of Pisa is leaning because
it is built on very weak material and it rains a lot in the Pisa area. The
water table is quite high so the weak soil is often saturated. It is in
a near-liquid state. The soggy soil is somewhat weaker on the Southern side
so the tower, which has sunk as a whole several meters into the ground,
has simply sunk more on one side than the other, causing the lean.
The condition of the material on which a building resides is an essential indicator
of how the building will perform in an earthquake. The USGS publishes soil maps
such as the ones for the San Francisco Bay area that can be seen at
http://ncweb-east.er.usgs.gov/prepare/hazards.html.
Particularly poor materials include landfill - the land produced when soil is
dumped in to bays and riverbanks to create "new" land. The material is poorly
compacted and water logged and very weak. Buildings often topple essentially intact.
The Notre Dame site http://www.nd.edu/~quake/
shows some excellent examples of buildings and other large structures that have fallen
over as the ground beneath them fails to support their weight when shaken by the earthquake.
Go to the part of the site that shows the Java Applets of shake table experiments.
One of the movies shows a model building being shaken and toppling over followed
by the surfacing of a buried object like a fuel storage tank that erupts out of the ground.
These surfacing events are well known from earthquake damage. Under the Education part
of the site there is a section called the "Virtual Laboratory for Earthquake Engineering".
It shows several different ways in which buildings can be isolated from the motion of the
ground using huge shock absorbing. You can change various parameters and see how well
they work. In all cases the motion of the building is initially isolated from the ground
motion then catches up with continued shaking. The objective is to isolate the building
long enough that the shaking from the earthquake has stopped as the seismic wave passes.
Note that the isolation is from the back and forth motion associated with p-waves.
The Izmit event provides an example of how, although earthquakes
cannot be predicted with precision some aspects of the way they behave can
give clues to where they might occur next. ( http://www.sciencenews.org/sn_arc99/8_28_99/fob2.htm).
The Izmit event occurred on the North Anatolian Fault; a feature that has
experienced significant historic activity. In fact, there is a distinct
pattern to the seismicity. Major earthquakes have been marching east to
west over the last century. Each earthquake ruptures a certain length of
the fault and in doing so releases stress in that region. What appears to
be happening is that each stress release event also increases the stress
on another part of the fault. On the North Anatolian fault this progressive
release/loading phenomenon is moving west implying that the area that has
been loaded is now to the west of Izmit. Istanbul, an ancient city with
many old structures, lies to the west of Izmit. It is generally thought
that the Izmit earthquake has made Istanbul more vulnerable to earthquakes
in the future. Just when, where and how strong the quake will be is not
known.
Figure 4.3.2
Figure 4.3.3
Earthquakes marched west along the North Anatolian
fault this century (top).
These shocks created stress, in red, in the
region of the August 17th, 1999 quake (bottom).
4.3.3 The Parkfield Prediction Experiment
The Parkfield experiment is a long-term earthquake research
project on the San Andreas fault in California. The ultimate goal of the project
is to better understand the physics of earthquakes and provide a scientific basis
for earthquake prediction. An elaborate and dense network of instruments has been
set up in Parkfield in order to allow scientists to study what actually happens on
the fault and in the surrounding region before, during, and after an earthquake.
Figure 4.3.4
The San Andreas fault in central California. A "creeping" section (green) separates
locked stretches north of San Juan Bautista and South of Cholame. The Parkfield
section (red) is a transition zone between the creeping and southern locked section.
Spotted areas mark the surface rupture in the 1857 Fort Tejon earthquake.
Parkfield was chosen as an ideal location because of its unique earthquake history.
Moderate-size earthquakes of about magnitude 6 have occurred on the Parkfield
section of the San Andreas Fault at fairly regular intervals - in 1857, 1881,
1901, 1922, 1934, and 1966 (a repetition rate of around 22 years). In addition,
the seismographs recorded from the 1922, 1934, and 1966 earthquakes are strikingly
similar, suggesting that these earthquakes all ruptured the same area of the fault.
Adding to this pattern of repetition, similar-size foreshocks occurred 17 minutes
before both the 1934 and 1966 Parkfield earthquakes. These observations suggest
that there may be some predictability in the occurrence of earthquakes, at least
in Parkfield. In the figure below, the similarity of the seismographs recorded
in the 1922, 1934, and 1966 earthquakes are shown. This similarity is only possible
if the ruptured area of the fault is the same for all three events.
Figure 4.3.5
The investigations at Parkfield have advanced scientists' understanding of the
earthquake process. For example, the link below allows you to view earthquakes
at Parkfield in 3-D. Rotate and zoom with your mouse. These earthquake locations
were obtained with the "double difference" method, which provides extremely high
resolution and reveals structure not seen in earthquake catalogs produced with
conventional methodology.
http://quake.wr.usgs.gov/3D/parkfield.html?file=parkfield.3d&Submit=Start+Display.
Many hypotheses have been proposed to explain the regular behavior of the Parkfield
earthquakes as well as why there has not been one of significant size since 1966.
In addition, scientists have been reworking prediction models to take into account
the information they have learned from the Parkfield research. The Parkfield
Prediction Experiment predicted that a moderate-size earthquake would occur at
Parkfield between 1985 and 1993. This prediction was unusual both in its precision
(as to location, time and magnitude) and high degree of confidence (95% within the
9-year window). However, there has not been a moderate size earthquake in Parkfield
since 1966.
While the Parkfield experiment can no longer serve as a confirmation of
time-predictability, it is very much alive as a test of slip-predictability,
in which the longer the wait, the larger the next earthquake. Some argue that
an earthquake of magnitude 6.6-6.9 would balance the moment deficit that has
accumulated since 1966, and the magnitude increases with each passing year.
When the next Parkfield earthquake occurs, if its magnitude approaches this
expectation, the Parkfield experiment would be transformed from a lesson in
patience to a successful tracking the nucleation and propagation of a much larger
earthquake with Parkfield's dense array of instruments. This would be a scientific
prize. Perhaps in the end the delay will appear beneficial and Parkfield will
turn out to be an inspired long-term investment for science.
4.4 Earthquakes And The Interior Of The Earth
The analysis of the seismic waves sent
out by earthquakes provides us with some of the greatest insights into the
interior structure of the Earth. They provide perhaps the most direct way
to view the Earthís interior since they can be used to create an image of the
interior.
This is because the interior of the Earth is composed of layers
and structures that propagate seismic energy at different speeds. We learned
above that an earthquake gives rise to many types of seismic waves, the P-wave
and S-wave being the first two to arrive at any site from an earthquake. The
interior layers of the Earth propagate these waves at different speeds, generally
increasing downward in the earth. At the top of the mantle the p-wave velocity
is about 8 km/sec and this increases downward to about ____ km/sec. The S-wave
speeds vary from ___ to ___ km/sec.
Most important for deriving an understanding of interior properties,
S-waves do not propagate in liquids. Remember that the S-wave is a shear
wave that results from a motion in the earth that literally tries to shear the
rock. Liquids cannot be sheared, of course, so S-waves cannot pass through
them. So S-wave velocities increase in the mantle until the core is reached
then they go abruptly to zero in the liquid outer core.
Figure 4.4.1 |
| Summary of the average seismic-wave velocity and density
profiles through the Earth according to the PREM model. The velocities of
compressional (VP) and shear (VS) waves are given on the left, density on
the right, and pressure as a function of depth on the top scale (see Table
2). From : Encyclopedia Britannica view this link for more context. |
The seismic waves bend (refract) as they pass through different
layers and bounce off the interfaces between layers of very different material
just as sound echoes off the walls of a canyon. They refract around the liquid
outer core giving rise to shadow zones on the opposite side of the earth from
the location of the earthquake.

Figure 4.4.2: From
Geophysical Properties of the Earth
By recording and analyzing the many seismic waves that are
recorded at many locations throughout the Earth we can build up a picture of
the structures beneath in much the same way as is done in medical imaging. The
technique is called seismic tomography and is borrowed directly from the CAT
scan techniques of medicine.
A detailed description of Seismic Tomography:
http://www.geof.ruu.nl/~bijwaard/abstracts/vakidioot/vak_uk.html
Tomography using S-waves or P-waves or a combination of the
two has in recent years been used to create remarkable images of the interior
structure. What is being images are changes in seismic velocity which are associated
with temperature variations in the Earth. Particularly for S-waves propagation
speed is very sensitive to temperature with faster regions being associated
with colder material, warmer with slower velocities. Thus, we are able to image
the decent of a slab at a subduction zone because that material is relatively
cold compared to its surroundings. Similarly regions of hot upwelling mantle
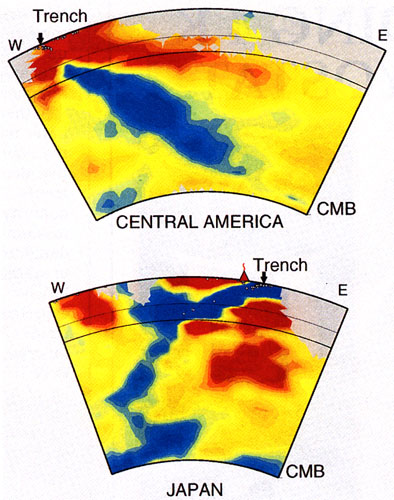
appear as distinct regions of slower velocity material. One thing we have learned
most recently is that some slabs seem to penetrate much deeper into the mantle
than most scientists had thought possible. In fact, they appear, in places,
to penetrate to the core itself!
 Figure 4.4.3
 |
 Figure 4.4.4
 |
Figure
4.4.5
Figure 4.4.6
As well as these general pictures of mantle structure emerging from tomographic analysis, special properties of seismic waves can be used to reveal features of the deep structure in surprising detail. Here are some examples.
4.4.1 Inner Core Rotation
Lamont news site: http://www.ldeo.columbia.edu/press_releases/song/pr.html
This site describes an astonishing discovery published in 1996 about the Earth's inner core -- the Earth's inner core actually rotates inside the Earth. How can we
possibly know such a thing? The first and essential piece of information is that
it had been known for some time that the solid inner core of the Earth is anisotropic
in the way it propagates seismic energy. What this means is that seismic body waves
that pass through the inner core travel faster if they pass in one direction than in
another. How do we know that in the first place? Imagine an earthquake that occurred
in Chile (say) recorded by seismometers on exactly the other side of the Earth. The
amount of time the seismic energy takes to make that long passage can be measured quite
accurately. Imagine another earthquake that occurred further around the world in,
maybe in Indonesia, and recorded also on exactly the opposite side of the Earth from
Indonesia. Its time of passage through the Earth can also be measured. What is known
is that the time of passage for seismic energy taking these trips from one side to the
other varies quiet a bit depending on where the earthquake occurred. The surprising
but clear cause of these time differences is that the energy travels faster through
the inner core when traveling in certain directions. That's what is meant by anisotropy.
Many Earth materials display this property and it is usually caused by internal layering
- the energy will travel faster along a layer than it will across the layers. What was
not known was that the inner core, made of solid iron, would display this property.
Most scientists believe that it results from the preferred orientation of iron crystals
in the core.
It is this property combined with other measurements that lead to the idea that the inner core is rotating. The web site gives the details but in simple terms
we use measurements of seismic signals that travel all the way across the entire
Earth as described above but in this case two waves from the earthquake are used;
one that travels through the inner core and another that skirts the inner core and
travels only through the outer core. There will be a difference in time of travel
of these two signals because the one traveling through the inner core picks up
speed because the inner core propagates energy faster than the outer core so this
wave will arrive earlier than the other. Seismic signals of this type have been
recorded for many years and a seismologist at Lamont chanced to compare seismograms
recorded over the last several decades. To his surprise he saw that the time
difference between the wave that traveled through the inner core and the one that
traveled through the outer core appeared to systematically change. What could
make the travel time of seismic energy propagating across the Earth change over
the historic past? The answer is contained in the above Web site and is that
the anisotropic inner core must be rotating, and thereby changing the orientation
of "fast" direction for propagation.
Since the finding was first published in 1996, other seismic observations have been
used to examine the same effect. The figure below shows three independent approaches;
the middle one being the one discussed above. To the left we see a seismic wave reflected
off the inner core. The core-mantle boundary is known to be rough (see discussion below)
so the energy received from an earthquake (at the star location) to a receiver (at the
triangle) will vary in strength over time as the inner core rotates. On the left we
see a slightly different idea. The earthquake energy is scattered from many sources
within the inner core, and will also vary in strength and character as the inner core
rotates.
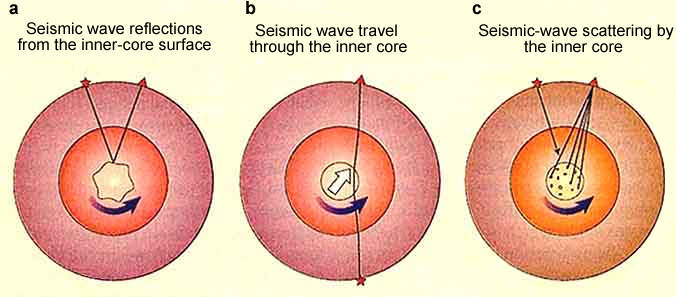
Figure 4.4.7
Since the original finding many approaches have been used, some have come up
with negative results suggesting that there is no discernible rotation. Most have
suggested that the rotation rate is slower than originally proposed. But the
idea that the inner core might be rotating differentially with respect to the
outer core and hence the Earth as a whole remains one of the most surprising findings
of whole Earth seismology in the decade of the 1990's.
4.4.2 Structure of Mantle Discontinuities
So far in these lectures you have learned about some of the
major divisions within the Earth - the crust, the lithosphere (involved in plate
tectonics), the inner and outer core - but there are a number of other boundaries
that are much more subtle. The major boundaries involve significant changes in
the physical properties within the Earth and some are often associated with major
chemical changes also. Several "discontinuities" occur in the mantle that are most
likely to be associated with phase transitions. It is believed that the
bulk composition of the mantle is of the material peridotite that is composed of
an iron and magnesium silicate (Mg, Fe) SiO4. This is the material that lies
immediately beneath the crust and is sometimes exposed in oceanic fracture zones
and in other tectonically active parts of the Earth. Deep in the Earth the
increasing pressure squeezes the peridotite and cause the atoms to form a more
compact structure. No chemical reaction occurs, but the re-packing of the atomic
structure causes the same atoms to become a new material known as spinel or Ringwoodite.
It is still made of Mg, Fe, Si and O (magnesium, iron, silicon and oxygen) but it is
a different material because of the atomic packing. This may be a hard idea to
understand at first but remember that graphite (the material in your "lead" pencil),
coal, and diamonds are all made of carbon. They are just in different atomic
arrangements associated with pressure due to burial (diamonds come from very deep
within the Earth). A second phase transition occurs from spinel to different
material known as perovskite. The first phase transition causes a discontinuity
in the mantle about 410 km beneath the surface and the second at about 660 km
(they actually vary in depth depending on the tectonic setting.
The physical property changes across these boundaries that occur over quite short
distances (on the scale of the mantle) are not large enough to be detectable by
seismic tomography which gives a fairly low resolution, smooth picture of the structure
of the mantle. To resolve the discontinuities we need to study the very weak direct
reflections they cause or from refractions along their surface. Even trickier, there
appears to be a very subtle boundary at about 520 km. It too is most likely caused
by a phase transition like the 410 and 660 discontinuities. In fact it may be a pair
of boundaries, one at 500 and the other at 560 km.
The difficulty with using waves to detect the physical world is
that the quality of your image is limited by the wavelength you
use. When using a particle as a probe, we need to use particles
with short wavelengths to get detailed information about small
things. To probe down to smaller scales, the probe's wavelength has
to be made smaller.
Things with long wavelengths are analogous to the 'throwing
basketballs in the cave to discover what is in growling in front of
you' story because neither can provide too much detail about what
they hit. Things with short wavelengths are like the 'throwing
marbles in the cave to discover what is in growling in front of
you' story in that they can provide you with fairly detailed
information about what they hit. The shorter the probe's wavelength
is, the more information you can get about the target.
The resolution of your measurement is the wavelength of light
divided by the diameter of the aperture. This means that you would
either need a small wavelength or a very large diameter to have
good resolution.
Check out this website for a more detailed explanation.
http://pdg.web.cern.ch/pdg/cpep/cave.html
In an innovative investigation shown below seismologists used shear waves that
bounced underneath the boundary as shown below.
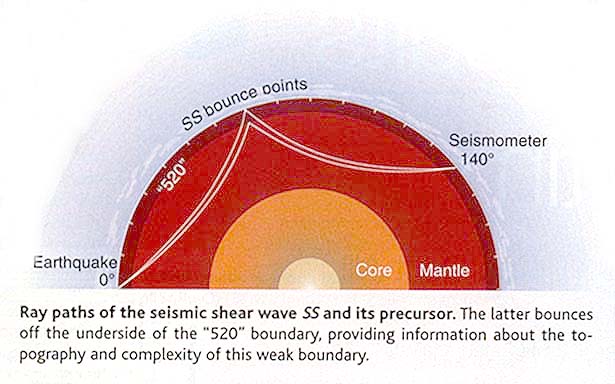
Figure 4.4.8
They used two energy paths, one that bounced at the Earth's surface and one that
bounced off the "520" discontinuity. Because the latter travels a shorter path
length it takes less time to reach back to the surface (about 20 seconds less).
This second path makes a very weak wiggle in seismograms, but it is definitely
present. In some places we see a single "520" wiggle; in other places there appears
to be two wiggles suggestive of a splitting of the boundary into one at 500 and one
at 560 km.
Detecting these very subtle boundaries requires the analysis of very high
quality seismogram data from many different parts of the Earth. Every year
it seems, new information about the structure of the mantle comes to light
from these studies. One reason they are important is that although they are
subtle they represent a partitioning of the mantle into different zones with
different physical properties. In particular these properties are thought to
have an influence on the pattern of mantle convection and the way in which
subducting slabs penetrate into the deep mantle.
4.4.3 Structure of the Core-mantle Boundary
Open any High School or undergraduate science text book to the section on the
Earth's deep interior and you will see the core represented as a fairly passive
blob; more or less inert and not doing much. In fact we now know that a lot is
going on in the core. It has been known for quite a while that vigorous convection
in the liquid outer core is responsible for the Earth's magnetic field. It
works something like an electric dynamo but the motions are very complicated
and that statement simplifies things a lot (too much really). We also know
that the solid inner core rotates with respect to the liquid outer core. In
fact, it may be electromagnetic energy that is responsible for driving the
rotation. The core is actually quite and active body.
One of the most dynamic parts of the Earth turns out to be the boundary between
the core and lower mantle. This boundary (sometimes referred to as the Gutenburg
discontinuity) places liquid iron in contact with the perovskite of the lower mantle.
One thing that happens is that the core eats into and absorbs the lower mantle. As
a consequence the iron outer core gets contaminated with the material of the mantle
causing it to be perhaps 10% less dense than pure iron. Outer core and lower mantle
also react chemically and produce new compounds as reaction products. The liquid iron
is able to permeate upward into the lowermost mantle by a process called capillary action,
the same process that trees use to draw water from the soil through their roots and
up into the body of the tree. The liquid iron reacts with the lower mantle rocks and
creates a thin reaction zone. The reaction products are new materials, even more exotic
than those of the lower mantle. But the really intriguing part of the story involves
the dynamic interaction with the mantle. Convection, as we learned in Topic #3, stirs
the deep mantle and plumes rise from the surface of the core. These actions move the
mantle around and stir up the reaction zone. These motions entrain reaction zone products
and move them upward in regions of mantle upwelling, perhaps exposing mantle to the core
and initiating further reactions. The reaction zone products are both liquid and solid
(crystalline) and as they get entrained in the mantle flow and move upward the heavier
solids will drop out and fall toward the core. The figure below from a Scientific American
article by Ray Jeanloz and Thorne Lay in May 1993 gives a sketch of what might be going on.
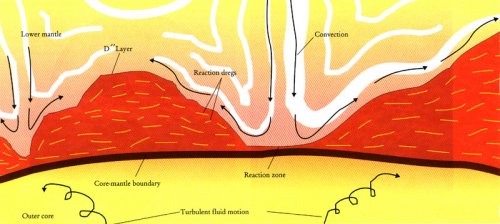
Figure 4.4.9
The uneven layer of entrained reaction products is called D'' and is a highly irregular
and dynamically variable feature of the core-mantle boundary. How can we possibly know
this? One way is direct simulations of the conditions present at the pressures and
temperatures of the core-mantle boundary. Jeanloz and Lay describe how a device called
a diamond anvil can be used to bring tiny samples of materials typical of the mantle and
core to the pressure and temperature of the core-mantle boundary. They react in the anvil
and their reaction products can be studied.
Seismic evidence involves the study not of the time of arrival of seismic energy but
the shape of the seismic waves. When seismic waves are emitted from their earthquake
source they travel away in a fairly smoothly expanding sphere (actually a half sphere
because they don't go into the air). So long as the structures in the earth through
which they pass are also smooth the wavefront will stay smooth and the shape roughly
spherical. But imagine the smooth wave encountering a rugged interface. The wavefront
will become distorted. Seismic energy propagating such that it just glances the core-mantle
boundary will pass along the highly variable D'' Layer described above and wavefronts
will become distorted as they travel through. This is shown schematically in the figure
below.
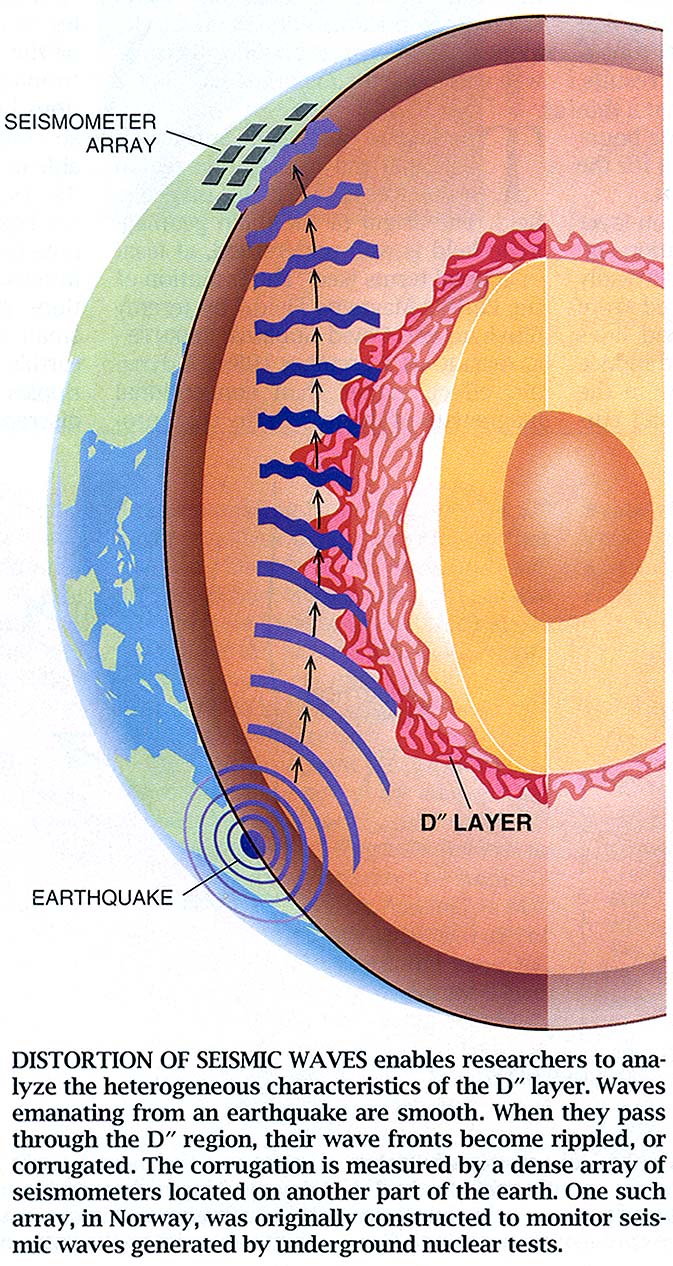
Figure 4.4.10
To detect these distorted waves we need many closely spaced seismic recording stations
set out in a dense array. These arrays can track the passage of a seismic wave across
the surface of the Earth and detect whether it is smooth or distorted. Studies of this
type have established that the D'' layer is indeed highly variable in shape and thickness
from place to place around the core-mantle boundary.
These studies tell us that D'' is quite variable but don't tell us much about its
internal properties. For that we must look closely at individual seismic records
from energy that has traveled for a while in D''. The figure below shows four
different interpretations of what the region of the core-mantle boundary might be
like. In the figure ULVZ means ultra low-velocity Zone.
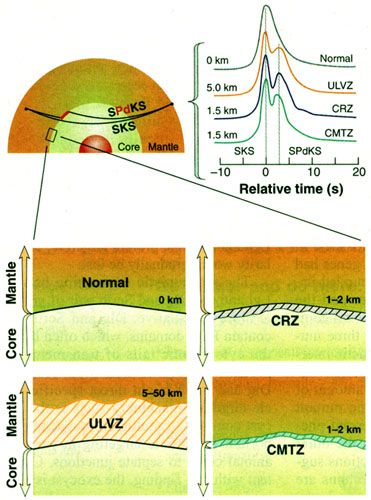
Figure 4.4.11
The above sketches are the seismograms expected for the energy that
travels in each of the possible D'' Layers. There are distinct but very small
differences between the seismic signals even though the D'' structures are really
quite different. The problem is one of resolution. At the depths of the core-mantle
boundary seismic energy has very long wavelengths - many kilometers -- and structure
can only be resolved to about a quarter of a wavelength.
Basically we are trying to examine structure in the deep Earth that is right
at the limit of our ability to resolve.
Study Exercises
Topic 1
/ Topic 2
/ Topic 3
/ Topic 5