Measure the power spectrum of a convergence map
The code you have to run to measure the power spectrum of a convergence map looks something like this
#The operations on convergence maps are handled with the ConvergenceMap class
from lenstools import ConvergenceMap
import numpy as np
import matplotlib.pyplot as plt
map_filename = "Data/conv1.fit"
conv_map = ConvergenceMap.load(map_filename)
l_edges = np.arange(200.0,50000.0,200.0)
#Measure the power spectrum calling the powerSpectrum method
l,Pl = conv_map.powerSpectrum(l_edges)
#Plot the result
fig,ax = plt.subplots()
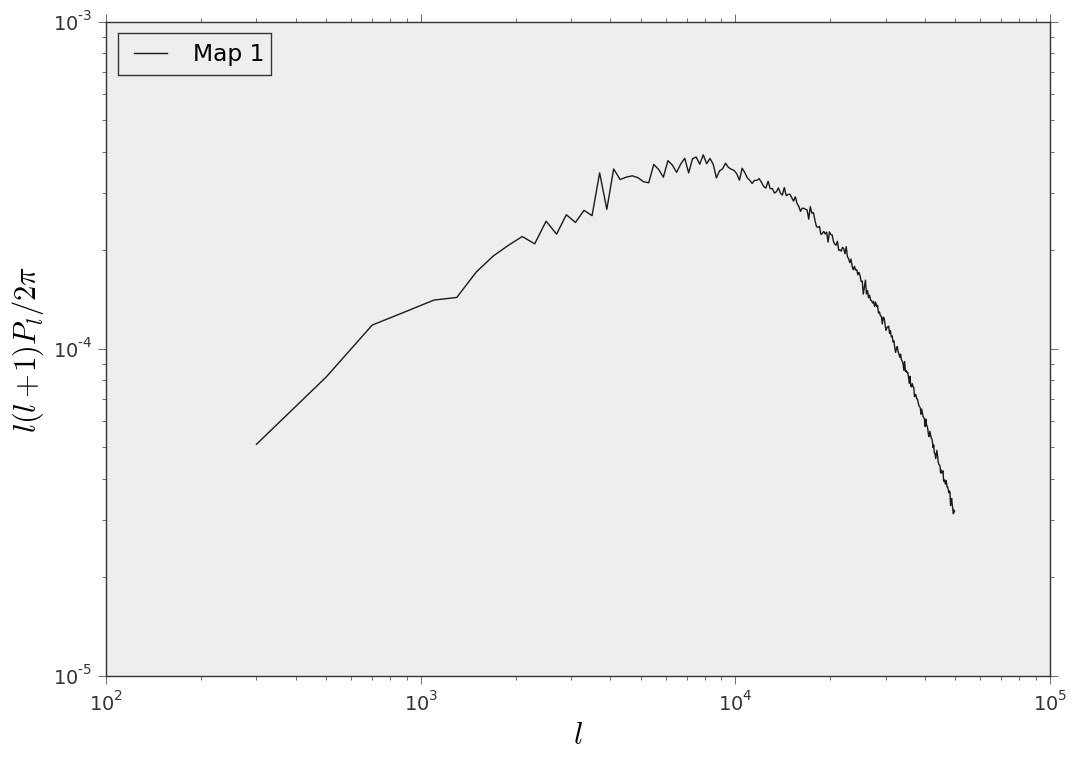
ax.plot(l,l*(l+1)*Pl/(2.0*np.pi),label="Map 1")
ax.set_xscale("log")
ax.set_yscale("log")
ax.set_xlabel(r"$l$")
ax.set_ylabel(r"$l(l+1)P_l/2\pi$")
ax.legend(loc="upper left")
fig.savefig("power_spectrum_one_map.png")
And this is the result