Measure the power spectrum of a convergence map (MPI)
When you need to measure the power spectrum of many different convergence maps (for example 1000 different realizations of a field of view), you are effectively measuring an Ensemble of quantities. lenstools provides Ensemble computing tools through the Ensemble class. This class supports parallel operations too through MPI, like in this example. First define a function that measures the power spectrum out of a single map:
#The operations on convergence maps are handled with the ConvergenceMap class
from lenstools import ConvergenceMap

def measure_power_spectrum(filename,l_edges):

        conv_map = ConvergenceMap.load(filename)
        l,Pl = conv_map.powerSpectrum(l_edges)
        return Pl
This is the actual code:
#The lenstools Ensemble class comes in handy
from lenstools import Ensemble
#MPI
try:
from emcee.utils import MPIPool
MPIPool = MPIPool
except ImportError:
MPIPool = None
import logging
import numpy as np
import matplotlib.pyplot as plt
logging.basicConfig(level=logging.DEBUG)
if MPIPool is None:
logging.warning("You need to install emcee in order to test the parallel statistics features!!")
try:
logging.debug("Attempting to create MPIPool")
pool = MPIPool()
logging.debug("Succesfully created MPIPool!")
except ValueError:
logging.debug("No reason to create one, one process only!!")
pool = None
except TypeError:
pool = None
#Create the MPI Pool
if (pool is not None) and not(pool.is_master()):
pool.wait()
sys.exit(0)
map_list = ["Data/conv1.fit","Data/conv2.fit","Data/conv3.fit","Data/conv4.fit"]
l_edges = np.arange(200.0,50000.0,200.0)
l = 0.5*(l_edges[:-1] + l_edges[1:])
conv_ensemble = Ensemble.fromfilelist(map_list)
#Calls measure_power_spectrum on each map, spreading the calculations evenly across processors
conv_ensemble.load(callback_loader=measure_power_spectrum,pool=pool,l_edges=l_edges)
if pool is not None:
pool.close()
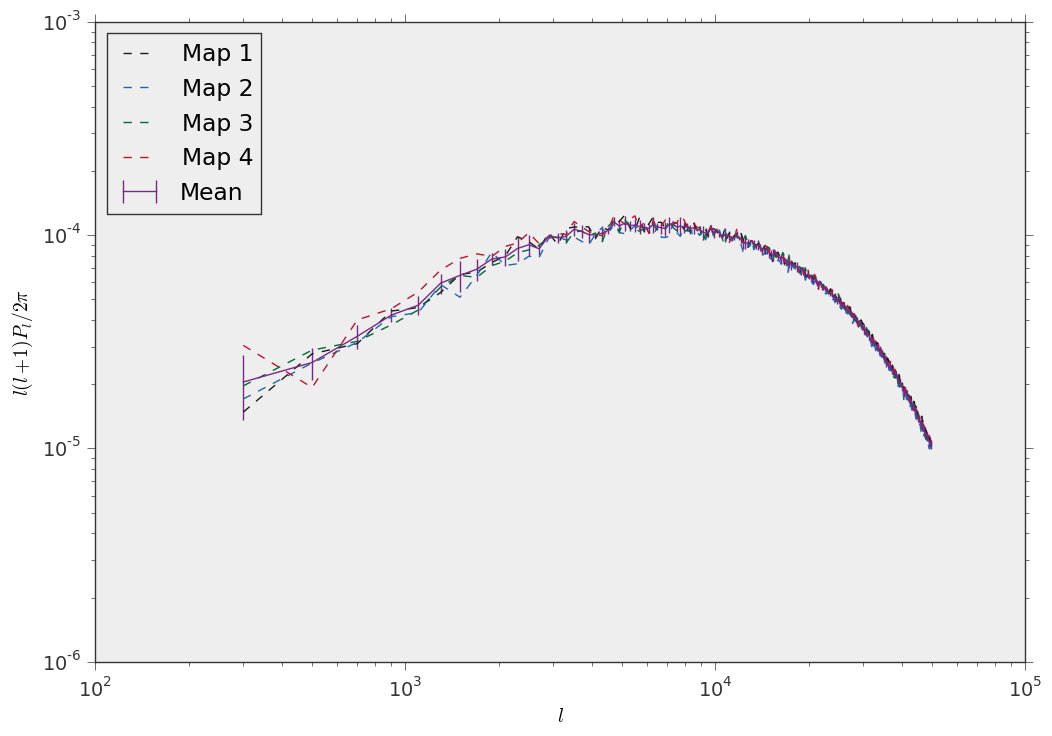
#Plot the result
fig,ax = plt.subplots()
for n in range(conv_ensemble.num_realizations):
ax.plot(l,l*(l+1)*conv_ensemble.data[n]/(2.0*np.pi),label="Map {0}".format(n+1),linestyle="--")
mean = conv_ensemble.mean()
errors = np.sqrt(conv_ensemble.covariance().diagonal())
ax.errorbar(l,l*(l+1)*mean/(2.0*np.pi),yerr=l*(l+1)*errors/(2.0*np.pi),label="Mean")
ax.set_xscale("log")
ax.set_yscale("log")
ax.set_xlabel(r"$l$")
ax.set_ylabel(r"$l(l+1)P_l/2\pi$")
ax.legend(loc="upper left")
plt.savefig("power_ensemble.png")
And this is the result